Microwave optical links (MOLs) are widely used in radar, electronic warfare and wireless communications because of wide bandwidth, low loss and immunity to electromagnetic interference (EMI). With the continuous improvements in the performance of the microwave optical links, nonlinearity produced by the photodiode (PD) at the end of the link plays a more important role in total link performance. The physical mechanisms of the nonlinearity like space-charge screening, carrier bleaching, or external circuit loading have been studied in the past few years [1-3]. Among these studies, voltage-dependent nonlinearity was proposed to be a result of impact ionization in the depletion region of the PD [4]. As nonlinearity of the PD may modulate low-frequency noise up to the phase noise close to microwave carrier frequency, we present a new approach to quantify the residual phase noise (RPN) of the PD to find whether voltage-dependent nonlinearity has an impact on the RPN of the PD. The RPNs of PDs were previously measured by carrier suppression method [5-6] or heterodyned measurement [7, 8].
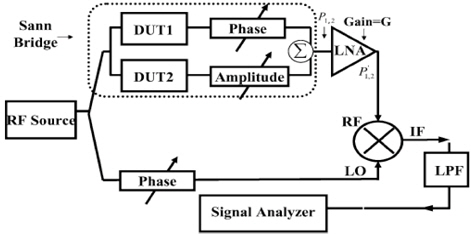
The carrier suppression method is illustrated in Fig. 1. A single-tone RF source is split into two branches of the phase bridge [5]. The reference branch is introduced to LO port of the mixer through a phase shifter. The signal branch is further split into two branches passing through two identical DUTs. The latter two signal branches are maintained in equal amplitude and 180° apart in phase before being recombined and launching into the RF port of the mixer. The differential noises attributed to the RPNs of DUTs are preserved while the common noises attributed to RF source and other components of the MOL, such as electro-optical modulator and optical fiber, are suppressed. Another simplified carrier suppression method was proposed later in which a 180° hybrid coupler was used instead of the power combiner so that the carrier signal was preserved at the ∑-port of the coupler and then fed into the LO-port of the mixer while the reference branch was no longer needed [6].
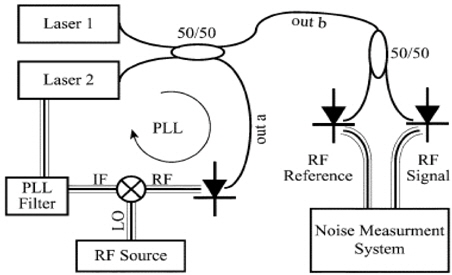
Besides carrier suppression method, the RPN of a PD can also be measured by detecting a 1-GHz beat frequency signal generated by heterodyned optical sources and feeding it to a phase noise measurement system, as illustrated in Fig. 2 [7-8]. An optical phase-lock loop (OPLL) is used to correlate the phase noises of the two lasers so that the noises could be canceled in the generated beat signal. With this method it is difficult to measure very low RPN because the RPN may be lower than the phase noise of the reference RF source. Furthermore, the optical path lengths from the optical splitter to each photodiode should be length matched to better than 1 ps so that the OPLL is hard to apply in practical measurement.
Moreover, owing to two exactly matched PDs are employed in these methods, it is not convenient to adjust the operation conditions of the two PDs and keep them matching all the time.
In this letter, we present a new method based on two-tone correlation to measure the RPN of a single PD so that it is convenient to adjust the operation condition of the PD. By measuring the RPN of the PD with different bias voltages, we are able to obtain the relationship between the RPN characteristics and the bias voltages.
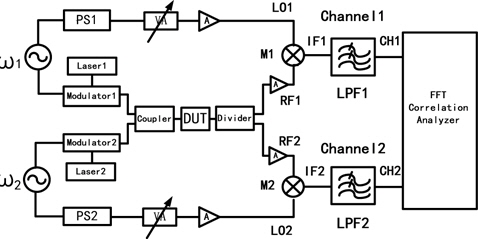
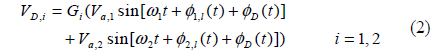
In order to measure the RPN of a PD, the phase noise contributions of the microwave sources and other components need to be effectively suppressed. This method is designed to suppress the phase noises attributed to the two reference microwave sources and the RPNs introduced by other components in the links. The proposed RPN measurement system is schematically illustrated in Fig. 3, two single-tone RF sources are split into two branches respectively. The reference branch is introduced to the LO port of a mixer through a phase shifter. The phase shifter (PS) of the LO is adjusted to keep the phases of the RF path and LO path in quadrature. In the RF path, the single-tone microwave signal is modulated on optical carrier. Two optical signal beams are coupled into the same PD. As illustrated in Fig. 3, PD is the device under test (DUT). The RF path of
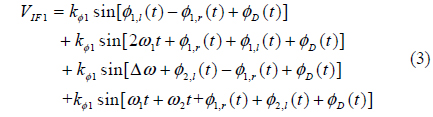
The phase noise is converted to voltages by a mixer. The output signals from both mixers are low-pass filtered. The cut-off frequency
The two signals generated by two microwave sources on the reference path are expressed as

Where
With gain

The power spectrum
The output cross-correlation power spectrum density

Where Φ
The measurement setup was depicted in Fig. 3. Two independent multiplied crystal oscillators at 9.5 GHz and 9.6 GHz respectively were used as the two sources, whose SSB phase noises were almost the same. The MOLs consisted of two DFB semiconductor lasers (Ortel 1772), two optical Mach-Zehnder modulators (Covega LN81) and a high speed photodiode (Discovery DSC40S). The signals were respectively modulated on optical carriers with two different modulators. Then the optical signals were coupled into the same PD. The phase noises of the sources and RPNs of the modulators were uncorrelated because they were in different arms. Thus, they could be suppressed by cross-correlation. Since the output power of the microwave sources were approximately only 12 dBm, two Marki Microwave M8-0420 level 7 dBm mixers were chosen based on the isolation characteristics and low conversion loss. Besides, some low phase noise amplifiers (LPNAs) were inserted before the mixer inputs in order to saturate the mixers. The variable attenuators (VAs) were used to adjust the input power of the amplifiers to prevent them from saturation. The phases of the input signals into the two ports of the mixer were set in quadrature. The cut-off frequencies of the LPFs were both 10.7 MHz (Mini circuit, BLP-10.7). A two-channel FFT correlation analyzer (Agilent 35670A) was used to implement the measurement of the cross-correlation power spectrum.
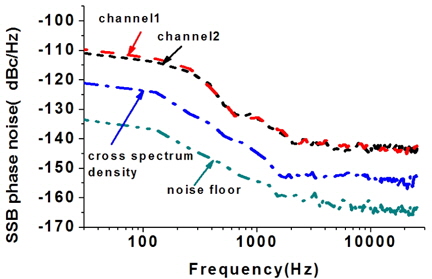
Figure 4 plots the experimental results by taking cross-correlation with 1000 times average while the incident optical power into the PD is 28mW and the bias voltage is 5 V. The measured offset frequency range is 0 to 25.6 kHz. The noise floor of the experimental system is -155 dBc/Hz@1 kHz and -165 dBc/Hz@10 kHz which is obtained by replacing the DUT with a microwave cable. The RPNs measured by the two separated channels are a little difference which may be caused by differences in sources, modulators, mixers and filters of different paths. It is clear that the RPN measured by two-tone method is 10dB lower than the phase noise measured with a single tone because the phase noises produced by the sources and the RPNs introduced by other components in different paths are mostly suppressed. Only the RPN of the PD is preserved. The RPN changes little when we increase the average times in that the number of averaged spectrum set a statistical limit to the measurement [10].
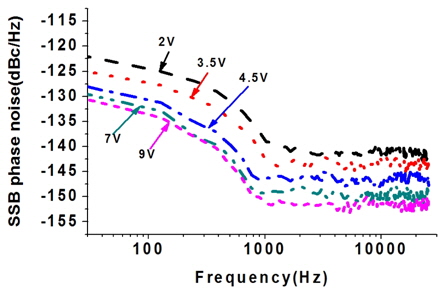
Figure 5 shows the results of different operating conditions when the bias voltage is changed from 2 V to 9 V. The incident optical power remains unchanged as 28 mW. With the increase of the bias voltage, the RPN of the PD is lower and lower. The RPN of the PD is 12 dB lower with 9 V bias voltage than the RPN which is measured with 2 V bias voltage. We have tested the RF gain curve and find that the RF gain is 2 dB compressed when the bias voltage is 2 V compared to the situation with 9 V bias voltage. The gap between the RPN with 7 V bias voltage and the RPN with 9 V bias voltage is not so big and merely 0.2 dB compression is observed. RF compression is presented as related to the bias voltage. Since RF compression is regarded as a parameter to quantify the degree of nonlinearity, it is clearly shown that the degree of the nonlinearity in the PD is dependent on the bias voltage. Besides, the RPN is also related to the the bias voltage and it raises up as the RF gain is compressed. So we conclude that the nonlinearity deteriorates the RPN of the PD. However, the physical mechanisms leading to this phenomenon needs further study.
In this paper, we present a novel approach to measure the RPN of a PD by means of a two-tone correlation method. It is more convenient to apply in practical measurement compared to the previously reported methods. The phase noises of the microwave sources and the RPNs of other components in the link are effectively suppressed so that the RPN of the PD can be measured. The RPN is -144 dBc /Hz@1 kHz and –153 dBc/Hz@10 kHz when the incident optical power is 28 mW with 5 V bias voltage. Significant change happens in the RPN of the PD when the bias voltage varies from 2 V to 9 V. The voltage-dependent nonlinearity may worsen the RPNs of PDs. But why nonlinearity has an impact on the RPN is still an unsolved problem and more research should be done in the future. It suggests that this characteristic should be considered for high performance optical links.