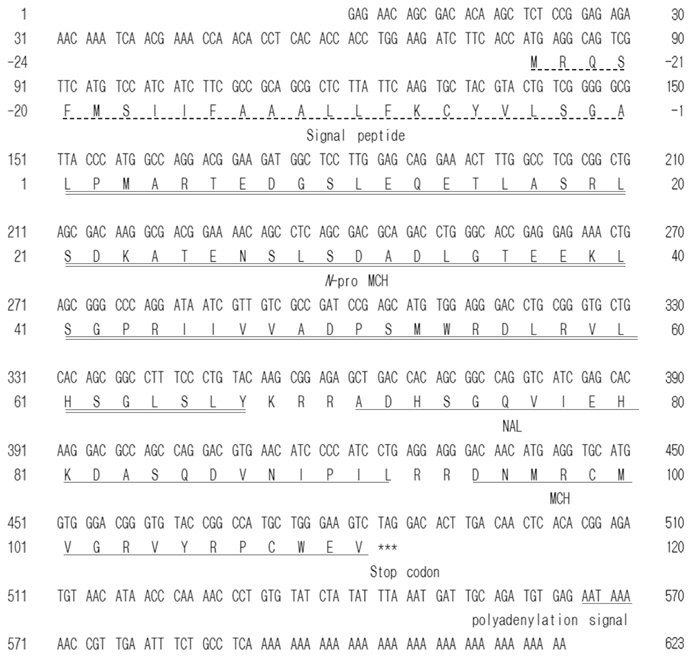
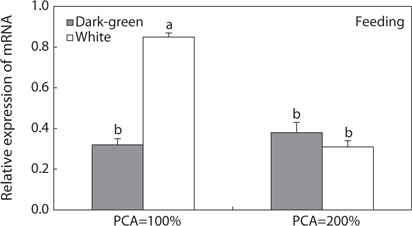
To assess the functional structure of prepro-melanin-concentrating hormone (pMCH), we isolated and cloned pMCH (of-pMCH) mRNA from the brain of the olive flounder, Paralichthys olivaceus, and compared its amino acid sequence with those from other animals. In addition, to examine whether activation of the brain of-pMCH gene is influenced by background color, density, and feeding, we compared pMCH mRNA activities against different background colors (bright and dark) and at different densities (100% PCA and 200% PCA). To examine whether the pMCH gene is related with malpigmentation of blind-side skin and appetite, we compared pMCH gene expression between ordinary and hypermelanic flounders, and between feeding and fasting flounders. The of-pMCH cDNA was 405 bp in the open reading frame [ORF] and encoded a protein of 135 amino acids; MCH was 51 bp in length and encoded a protein of 17 amino acids. An obvious single band of the expected size was obtained from the brain and pituitary by RT-PCR. In addition, of-pMCH gene activity was significantly higher in the bright background only at low density (< 100% PCA) making the ocular skin of fish whitening, and in ordinary fish. However, the gene activity was significantly decreased in dark background, at high density (>200% PCA), and in hypermelano fish. These results suggest that skin whitening camouflage of the flounder is induced by high MCH gene activity, and the density disturbs the function of background color in the physiological color change. Moreover, our data suggest that a low level of MCH gene activity may be related to malpigmentation of the blind-side skin. In feeding, although pMCH gene activity was significantly increased by feeding in the white background, the pMCH gene activity in the dark background was not influenced by feeding, indicating that the MCH gene activity increased by feeding can be offset by dark background color, or is unaffected by appetite. In conclusion, this study showed that MCH gene expression is related to ocular-skin whitening camouflage and blind-skin hypermelanosis, and is influenced by background color and density.
The primary structure of melanin-concentrating hormone (MCH), which is produced in neurons in the hypothalamus and released from the neurohypophysis, was first identified in chum salmon,
Other studies have indicated that MCH and α-MSH (antagonist of MCH) are commonly involved in morphological color change, as well as in the rapid color change of fish that results in skin darkening (Höglund et al., 2002; Sugimoto, 2002). Indeed, it was shown that intraperitoneal injection of MCH turned the ocular skin pale in barfin flounder (
In mammals, the neurons in which MCH, as a hypothalamo–pituitary peptide hormone, is produced are the most downstream peptidergic neurons involved in the chain of hypothalamic signals that regulate food intake and energy homeostasis (Pritchard et al., 2002; Shi, 2004; Pissios et al., 2006). A series of studies using rodents established the roles of MCH signaling in the regulation of food intake and energy balance in mammals (Presse et al., 1996; Qu et al., 1996; Rossi et al., 1997; Ludwig et al., 1998; Stricker-Krongrad et al., 2001; Della-Zuana et al., 2002; Abbott et al., 2003; Gomori et al., 2003). However, despite the known involvement of MCH in feeding and somatic growth in mammals, little information is available regarding its effects on food intake in fish. Thus, 326the effects of MCH on feeding behavior in fish remain to be explored. Some studies (Lin et al., 2000; Matsuda et al., 2006; Matsuda et al., 2007; Pérez Sirkin et al., 2012) have suggested that MCH is involved in the regulation of food intake and energy balance in teleosts. Experiments in barfin flounder suggested that teleost MCH is associated with food intake (Takahashi et al., 2004). However, recent studies indicating that fish possess two forms of MCH precursors (Berman et al., 2009; Tuziak and Volkoff, 2012) suggest that the two prohormones likely have different roles in physiological color change and feeding behavior; fish-type MCH (MCH1) expression may be correlated with pigmentation changes, but increased mammalian-type MCH (MCH2) expression may occur in response to chronic food deprivation. However, there is currently insufficient data to determine the functional role of the fish-type MCH gene in feeding. Therefore, it is necessary to clarify the functional relationships between the fish-type MCH genes with respect to appetite.
In the present study, we first determined the primary structure of the fish-type prepro-MCH of olive flounder (
>
Identification of the of-pMCH gene
To isolate
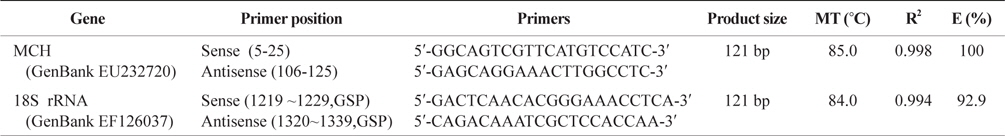
Reverse transcription and PCR (RT-PCR) amplification were performed to detect partial strand of pMCH mRNA. RTPCR primers (Table 1) were designed from highly conserved regions of pMCH from barfin flounder (GenBank BAC82350). PCR amplification were performed using AccuPower RT/PCR PreMix (Bioneer, Daejeon, Korea) with MyiQ PCR system (Bio-Rad, Hercules, CA) according to the manufacturer’s instructions. The amplified PCR product was separated on an agarose gel, extracted using the AccuPrep Gel Purification Kit (Bioneer), and sequenced by COSMO Gen Tech. (Seoul, Korea). A single PCR product of the expected size (280 bp) was obtained.
For rapid amplification of the cDNA-ends (RACE) reactions, gene-specific primers (GSP) were selected from the 280 bp PCR product obtained by RT-PCR (Table 1). For RACE, the RACE primers supplied with the CapFishing Full-Length cDNA Premix Kit (Seegene, Seoul, Korea) was used as the sense and anti-sense primers. After preincubation at 94°C for 180 min, PCR was carried out for 35 cycles of denaturation at 94°C for 40 s, annealing at 55°C for 40 s, and extension at 72°C for 60 s, followed by an extension step of 5 min at 72°C. After RACE, we obtained target cDNA 5′- and 3′-RACE products that shared an overlapping region. The full-length cDNA was generated by direct PCR using 5′- and 3′-RACE fragments.
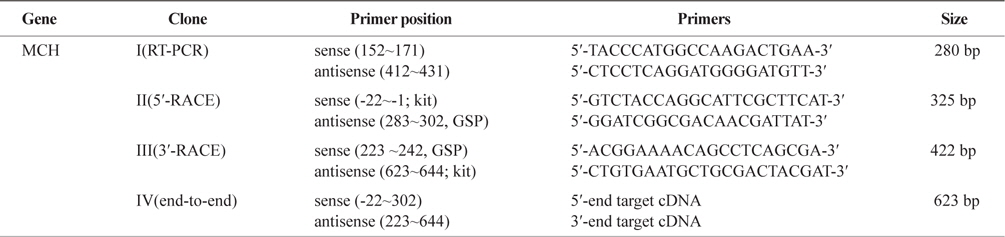
Primers used for the isolation of MCH 1 & 2 cDNAs, the synthesis of full length- first strand cDNA and the 5′-and 3′-RACEs
The full-length cDNA was inserted into a PCR cloning vector using a TOPO TA Cloning Kit (Invitrogen), which was then transformed into
>
pMCH tissue distribution analysis and phylogenetic tree
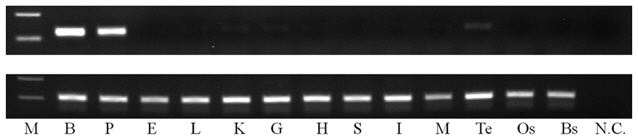
The brain (B), pituitary (P), liver (L), eye (E), kidney (K), gill (G), heart (H), stomach (S), intestine (I), muscle (M), testis (Te), ocular skin (Os), and blind skin (Bs) were removed from ordinary olive flounder (TL 16.2 ± 0.2 cm, BW 41.9 ± 1.9 g;

Gene specific primers used to analyze tissues distribution and compare mRNA expression between groups
>
Influence of background color, density, and appetite on MCH gene expression
Experimental animals and experimental conditions
To evaluate the influence of density and background color on
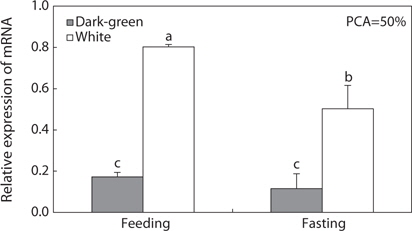
To determine whether MCH gene expression is related to food intake, we randomly divided size-matched hypermelanic flounders (TL 33.2 ± 1.31 cm, BW 468.5 ± 72.82 g) into feeding and fasting groups, and transferred the fish from the two groups into dark-green and white tanks (1000 L/m3) at a density of 10 fish/m2 (PCA = 50%). The fish were acclimated to each tank supplemented with food for 3 days. After 3 days, we continuously supplied food to fish in one group (feeding group), while those in the other group were deprived of food (fasting group) for 7 days. On the final day, we sampled five fish from the dark-green and white tanks in the feeding and fasting groups and extracted the brains. Sampled fish were euthanized with the general anesthetic 2-phenoxyethanol (1/1000 dilution, 0.3–0.4 mg/L), and then rinsed with distilled water to remove salt. The brain tissues were removed from flounders and stored at –70°C for comparison of pMCH mRNA expression.
Comparison of of-pMCH mRNA expression
To measure pMCH mRNA expression levels in the brain, we extracted total RNA from the whole brains of flounders (
Aliquots of 1 μg of total RNA were reverse-transcribed to cDNA using an iScript cDNA Synthesis Kit (Bio-Rad). We then performed real-time PCR using the IQ SYBR Green Supermix (Bio‑Rad).
To compare mRNA expression between groups, the qPCR gene-specific primers (GSP) of
These data were used to produce real-time amplification curves for pMCH by plotting the Δ normalized reporter against the cycle number. The cycle threshold (Ct) value, which is the PCR cycle at which a statistically significant increase in reported fluorescence above the baseline could be detected (set at Δ Rn = 0.2), was determined for pMCH. The Ct values were used in the comparative Ct method (Livak and Schmittgen, 2001) in accordance with the manufacturer’s protocol (Bio-Rad) for relative quantification. We evaluated the expression of 18S rRNA mRNA in each reaction as a control. The expression levels in the two tissues were normalized with respect to the 18S rRNA signal and expressed as the relative expression level.
The data were analyzed by Mann–Whitney U-test using SPSS (Korean ver. 7.50; SPSS Inc., Chicago, IL). In all analyses,
>
Identification of of-pMCH cDNA
A PCR-based cloning strategy (RT-PCR followed by 3′- and 5′-RACE) was used to clone a cDNA encoding a putative pMCH from the olive flounder brain (Table 1). The first PCR using stage-I sense and antisense primers amplified the middle region (nt 152–431; clone I). Based on this nucleotide sequence, a stage-II antisense primer was synthesized for 5'-RACE. PCR using the stage-II antisense primer and a 5'-RACE kit primer (abridged universal amplification primer) amplified the
>
Comparison of of-pMCH with vertebrate pMCHs, and phylogenetic analysis
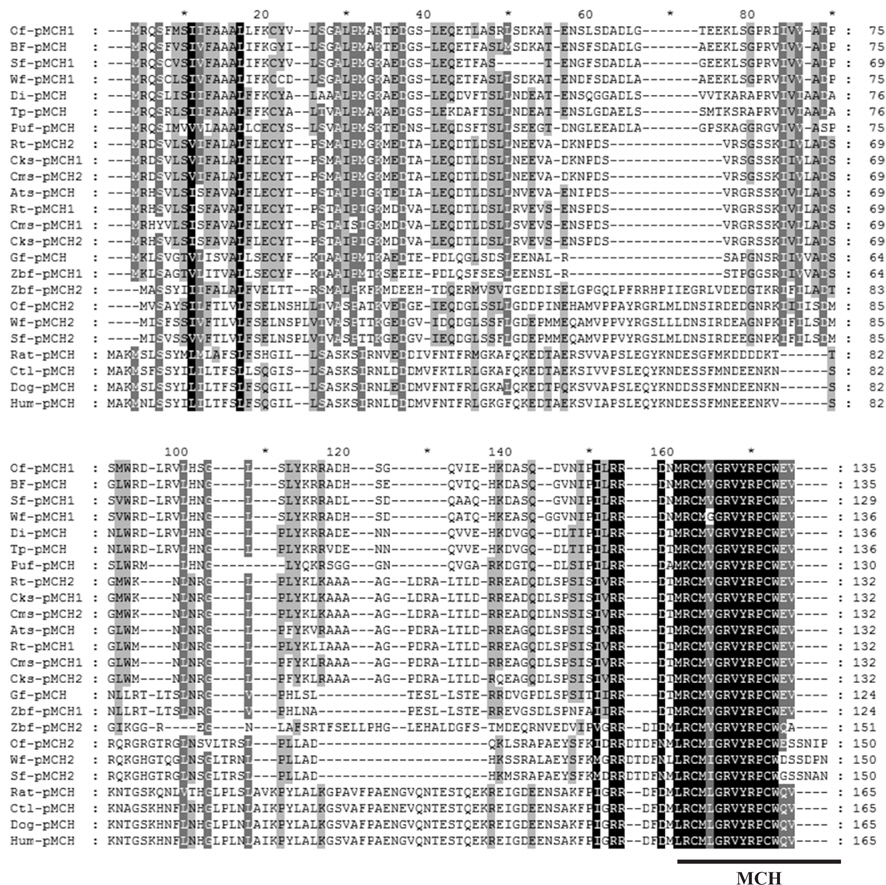
The amino acid sequence of
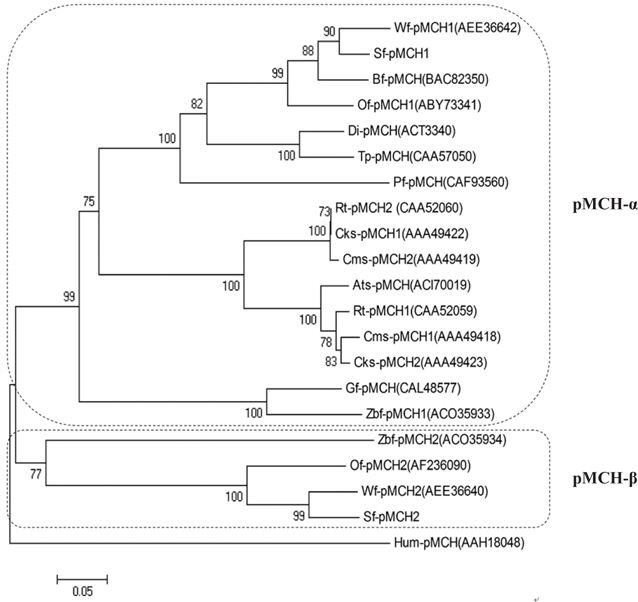
The relationships among a number of pMCHs are shown in a phylogenetic tree constructed by the NJ method (Fig. 4). We found that there are two principal teleost pMCH clades (pMCH-α and pMCH-β) in the phylogenetic tree.
>
pMCH mRNA expression according to tissue and environmental factors
Expression of the
The results of the present study indicated that
In phylogenetic trees (1,000 bootstrap replicates) of fish pMCHs, although a single pMCH was reported in many fish, duplicated pMCHs have also been described in several fish, such as salmon, zebrafish, and flounder species. Also, the phylogenetic analysis in the present study reveals that there are two main clades (pMCH-α and pMCH-β) and that, in some teleost species, the loss of pMCH-β gene was occurred under different selective pressures during their evolution. Here, we confirmed that olive flounder has two pMCHs, indicating that flounder species may have two types of pMCH. Based on aa comparisons and phylogenetic trees,
In this study, we examined the expression of pMCH mRNA in cranial and extracranial organs. Obvious expression of pMCH mRNA was detected in the brain and pituitary. In contrast, a week expression was observed in testis, kidney, and gill, and no expression was observed in the other tissues examined. These observations are consistent with previous reports in other teleost fishes (Naito et al., 1985; Minth et al., 1989; Amano et al., 2003; Pandolfi et al., 2003). In addition, although it is not clear whether MCH expression in extracranial organs is of physiological significance, the MCH mRNA expression in the testis, kidney, and gill suggests that MCHs play a peripheral role in spermatogenesis and osmoregulation. Therefore, further studies are needed to determine the peripheral physiological roles of MCH transcripts in extracranial organs.
In the wild, fish often use camouflage to hide from predators. One camouflage tactic is to change the body color to match that of the current background. MCH, a functional antagonist of α-MSH, plays a key role in this type of color change (Baker, 1993; Suzuki et al., 1995). Previous studies demonstrated that many fishes physiologically change their body color to match the background color with changes in MCH gene expression (Ramachandran et al., 1996; Nery and Castrucci, 1997; Nilsson Sköld et al., 2013). In pleuronectiforms, Amiya et al. (2005), Amano and Takahashi (2009), and Yamanome et al. (2005) demonstrated that a bright background color increases MCH gene expression, and then sequentially brightens body color, finally suppressing the blind-side malpigmentation of cultivated flounders. However, in the present study, we found that bright background did not whiten ocular skin, and MCHs do not play a role in the whitening of ocular skin in the olive flounder. The function of MCH in the whitening of ocular skin and bright background was found only at a fish density of 100% PCA, and not at the higher density of 200% PCA. These unexpected results indicated that overcrowding may suppress MCH action in the whitening of skin color, and that MCH is hindered by high density (200% PCA or higher).
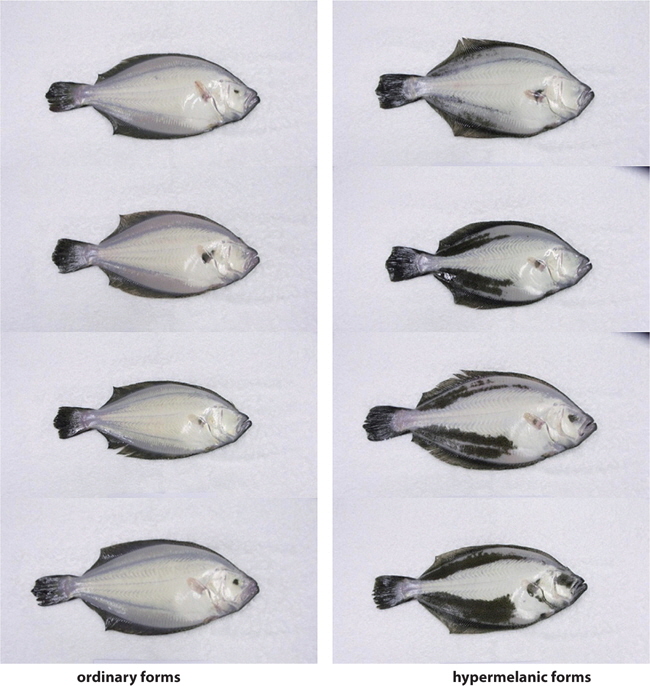
In the present study, we investigated whether MCH was related to blind-side hypermelanosis by comparing the expression of
Several studies (Groneveld et al., 1995; Suzuki et al., 1995; Amiya et al., 2005; Yamanome et al., 2005; Takahashi et al., 2007) have indicated that a bright background color increases appetite and growth in fishes through markedly increasing hypothalamic MCH neurons and triggering MCH production in the brain, suggesting that an MCH-related signaling system activated by white background stimulates food intake, which in turn accelerates growth in fishes. Previous studies (Takahashi et al., 2004; Yamanome et al., 2005; Matsuda et al., 2006; Matsuda et al., 2009) have reported that this hormone is also involved in improving appetite in teleosts. Recently, this was also supported by Berman et al. (2009) who found that fasted fishes had greater numbers of detectable MCH-immunoreactive cell bodies in the brain than fed fish, and by Takahashi et al. (2004), Tuziak and Volkoff (2012), and Kang and Kim (2013) who found that MCH gene expression in the brain of starved fish was two-fold greater than that in fed fish. The relevance of MCH to appetite in fish may follow a similar pattern as in mammals; i.e., mammalian-like MCH in combination with neuropeptide circuits (neuropeptide Y, hypocretin, and agouti-related protein) regulates food intake (Lin et al., 2000; Kawauchi, 2006; Matsuda and Maruyama, 2007). However, our data did not indicate that MCH is related to food intake. In the present feeding test, when flounders were reared at 50% PCA, pMCH gene activity was significantly higher with a bright background color than a dark background color, regardless of feeding or fasting. However, the effects of food intake on pMCH gene activity were dependent on background color. Although pMCH gene activity was significantly two-fold higher in the feeding group than the fasting group with a white background, the gene activity with a dark-green background was not significantly different between the two groups. Therefore, our results indicate that the MCH system is under the control of background color, but is not under the control of food intake. However, in previous studies using other flounder species (Takahashi et al., 2004; Tuziak and Volkoff, 2012; Kang and Kim, 2013), brain MCH mRNA levels were increased markedly under fasting conditions. In these studies, ordinary barfin flounder (Takahashi et al., 2004), winter flounder (Tuziak and Volkoff, 2012), and starry flounder (Kang and Kim, 2013) were reared in flat-bottomed black tanks, sandy-bottomed white tanks, and gravel-bottomed dark-green tanks, respectively. However, in the present study, we did not find any increase in MCH gene expression under fasting conditions regardless of background color or tank bottom type. Rather, in the white tank, MCH was significantly increased in the feeding group. These discrepancies in the results were likely caused by interference of background color; i.e., our contradictory results may have been due to the different background color and type of tank bottom employed to evaluate the role of MCH in food intake. Recently, Berman et al. (2009) and Tuziak and Volkoff (2012) reported the existence of two functionally distinct MCH peptides, and disagreed over the relationship of the fish-type MCH gene with food intake. Although Tuziak and Volkoff (2012) suggested that the fish-type MCH gene plays a role in regulation of appetite in flounder, Berman et al. (2009) suggested that the fish-type MCH gene is not principally involved in pigmentation and that the mammalian-type MCH gene is responsive to changes in appetite. Therefore, the relevance of fish-type MCH to the availability of food in fish must be examined carefully, and further experiments are necessary to determine whether the fish-type MCH is functionally related to feeding.
In conclusion, the primary structure of