The application of software engineering is not common in the development of astronomical observation system. While there were component-wise developments in the past, large-scale comprehensive system developments are more common in these days. In this study, current methodologies of development are reviewed to select a proper one for the development of astronomical observation system and the result of the application is presented. As the subject of this study, a project of operation software development for an astronomical observation system which runs on the ground is selected. And the output management technique based on Component Based Development which is one of the relatively recent methodologies has been applied. Since the nature of the system requires lots of arithmetic algorithms and it has great impact on the overall performance of the entire system, a prototype model is developed to verify major functions and performance. Consequently, it was possible to verify the compliance with the product requirements through the requirement tracing table and also it was possible to keep to the schedule. Besides, it was suggested that a few improvements could be possible based on the experience of the application of conventional output management technique. This study is the first application of the software development methodology in the domestic astronomical observation system area. The process and results of this study would contribute to the investigation for a more appropriate methodology in the area of similar system development.
Recently, the introduction of a software engineering has been attempted in the development of software in the areas of national defense, astronomy, and aviation. Advanced Defense Component Development Methodology (ADCDM) (Chung et al. 2006) and Magic and Robust Methodology Integrated-III 4.0 (Ham et al. 2004) can be used for these attempts. The ADCDM is Component Based Development (CBD) methodology developed by Agency for Defense Development (ADD) and the MRMI-III is developed by Electronics and Telecommunications Research Institute (ETRI). It is not common to apply the software engineering in the development of astronomical observation system field. While the aspect of development was small scale, it has been changed to the complex and large scale in recent years. Also, the cost of software development ranges from several tenths billion won to a few billion won and a package type software development is required in terms of the project period and the man-power demands. Due to series of similar system developments rather than a one-time development, the reusability of software are demanded to reduce the development period and the cost. These are the main reason why we consider the application of software engineering.
In this study, current methodologies of development are reviewed to determine the best one for the development of astronomical observation system through preliminary studies and the application results of this methodology is presented. Also, the current methodologies are reviewed to identify the improvements to be made to contribute to the application of a new methodology. For this study, the output management technique developed based on the CBD methodology which is one of the recent development methodologies was applied to the software development of the Satellite Laser Ranging (SLR) system (Jo et al. 2011, Park et al. 2012) which is an astronomical observation equipment of Korea Astronomy and Space Science Institute (KASI). At the stage of this task placement, the list of products are determined and according to this list, all the process of requirement analysis, design, implementation, test, and operation are interfaced. Since the nature of software to be developed requires lots of arithmetic algorithms and has great impact on the performance of the entire system, a prototype model (Youn 2009) is developed for the verification of major functions and performance. Also, the effect of this approach on the results of development is investigated through the requirement tracing table to verify the compliance of the requirements of the products according to the plan.
In consequence, the product requirements were satisfied and it was also possible to meet the schedule of software development. Most of all, the systematic development phase and the verification of the products according to the milestone enabled the reliable development. However, the difference in the progresses of interfaced sub-systems resulted in a delay in part of the software tests. This should be corrected in the subsequent application of current development methodology.
This study is the first application of the software development methodology in the domestic astronomical observation system area. The process and results of this study would contribute to the investigation for a more appropriate methodology in the area of similar system development. In Section 2 of this paper, preliminary studies on the comparison of current methodologies and the standards are described. In Section 3, the derivation of products and the prototype models are described focused on the implementation system. In Section 4, the applied techniques are evaluated and the issues are analyzed and in Section 5, the results are summarized and further study is proposed.
2. 1 Comparison of Current Studies and Review on the Standards
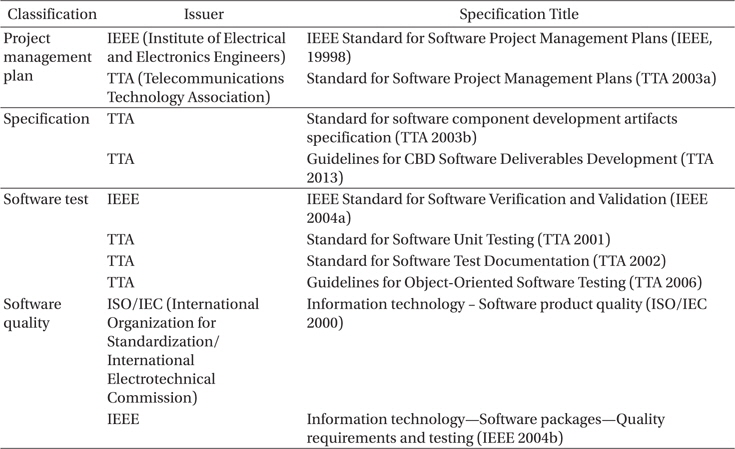
The software development methodologies or the processes are largely classified as frameworks of Objectoriented methodology, Component Based Development (CBD) methodology, and Product Line Engineering (Jo et al. 2007). Table 1 compares major features of fairly new methodologies of object-oriented methodology, CBD methodology, and Agile methodology (Rizwan Jameel Qureshi 2012) in order to determine the methodology for this study excluding conventional methodologies. The study results on the Agile methodology which has attracted attention of people recently, are summarized in Chung et al. (2014). The foreign or domestic standards have also been reviewed during the preparation stage for the successful development of the software. In Table 2, the texts are divided into the categories of software project management plan, CBD standard products, software test based on the standards of preliminary study. In order to determine the software development life-cycle (Chae & Yoon 2007), literatures were reviewed and derived the conclusions ahead of the main development.
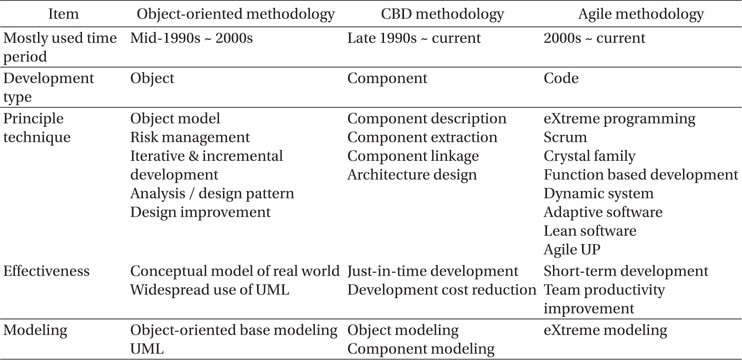
Comparative analysis of the features of representative software development methodology after 1990s.
[Table 2.] Referenced specifications.

Referenced specifications.
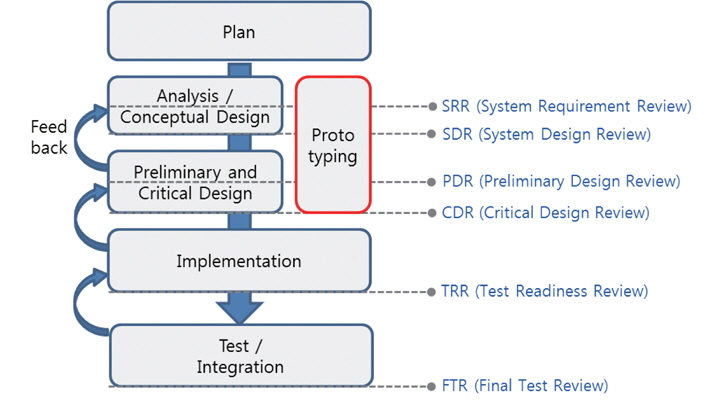
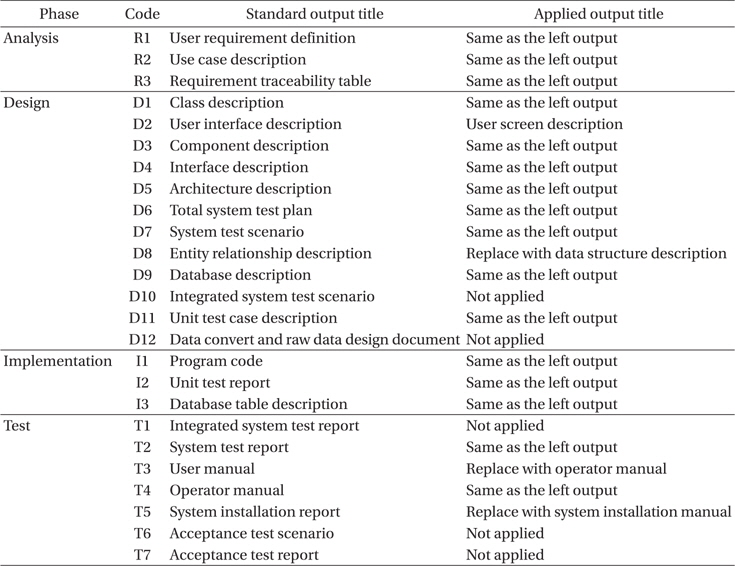
According to the reviews of Section 2.1, the CBD methodology is selected for this study based on the following reasons. First, the total period of software development is 15 months which is never short. Thus, a systematic task management is enabled through the products applying the CBD methodology because of the long development time span in view of project management. Second, the reusability of software are taken into account since subsequent developments of same or similar systems have been planned. In other words, the development of a reusable component module has been attempted. The life cycle is determined as combined type of a waterfall and a prototyping model as shown in Fig. 1. The repetitive and progressive processes which are the characteristics of an object-oriented development project are not adopted since the specific requirements considering these were prepared already and it is not easy to change the requirements due to complicated interfaces. Also, there are logics of arithmetic algorithm and which have an impact on the major functions and the performance elements, a prototype model is developed for the verification of these in order to reduce risks in advance. Development products based on the CBD methodology are decided according to the selected methodology. The development products are prepared from the standpoint of process and product. While the products are prepared to manage and control the processes during the development stage in order to ensure the quality of final products according to the process view, the products are prepared for the takeover and management of the products specifying the quality and component of the final products (TTA 2003b) according to the product view. The products are determined based on the product lists shown in “Standard Product Management Guides based on CBD SW Developments” (NIA 2011). This management guide is established as a standard, TTA (2013). Table 3 shows a comparison table between standard products suggested in the standard (TTA 2013) and applied products. Most of the products suggested in the guide are incorporated and part of products are renamed or excluded. The products are reviewed in milestone review meetings which is held for progress managements according to the level of each stage.
[Table 3.] Comparison with the standard (TTA 2013) for CBD Software outputs.

Comparison with the standard (TTA 2013) for CBD Software outputs.
The meaning of the application of a methodology in developing software is to set up consistent interfaces over the process of requirement analysis, design, implementation, test, operation, and maintenance (Jin et al. 2004). Thus, the methodology of this study is explained focusing on the activities for the derivation of products according to the life cycle flow of the implemented system. The application of prototype model is also explained in this flow.
3.1 Requirement Analysis and Design According to UML Implementation
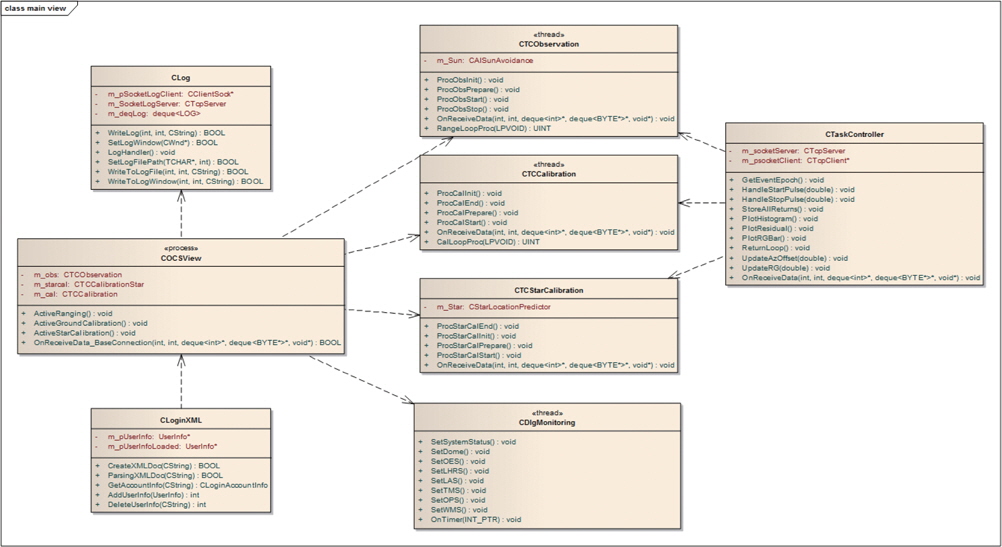
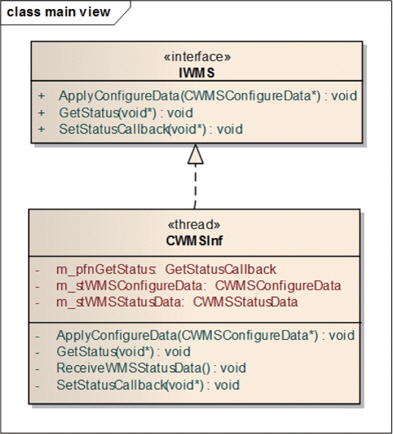
According to Kundu et al. (2013), the conventional UML tool in a model-driven software environment generates structural codes automatically from UML class diagrams. That is, the modeling language is used to confirm the requirements and to analyze and design them to generate the codes automatically. The modeling tool used in the requirement analysis and the design process is Enterprise Architect (2014) 7.5 or 8.0 which is a product of SPARX SYSTEMS of United States. This tool is based on UML (Unified Modeling Language) 2.0 (OMG 2006) of Object Management Group (OMG 2014). The layer policy related to the software structure is decided as 3+1 layer based on the Rational Software policy of IBM (IBM 2009). UI (User Interface), Control, Integration, and Common layer comprise the policy. In this policy, the references among the component elements are handled when a request is made through a terminal or external system interfaces. Especially, the Control layer is where the components are located and has business logic such as data processing, etc., as shown in Fig. 2(KASI 2012a). The key to a development of components is the derivation of components (Song et al. 2004), that is, “What is suitable for a component?” The derivation of components in this research corresponds to the encapsulation and modularization of internals based on the interfaces between the peripheral equipment. The interface should be maintained for subsequent systems and for the replacement of some equipment, thus, it is determined as a component considering reusability. The component has main functions of data transceiver among equipments and control, and it is derived as a class rather than a package since the processing logic is not so complicated. The stereotypes of “<
3.2 Definition of System Interface and Design
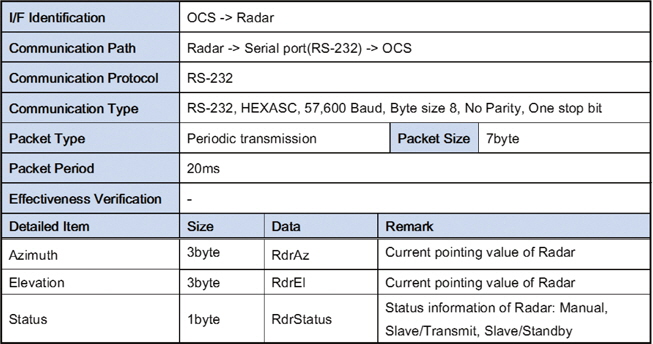
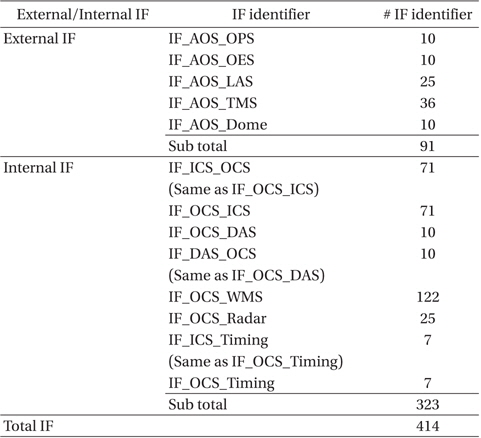
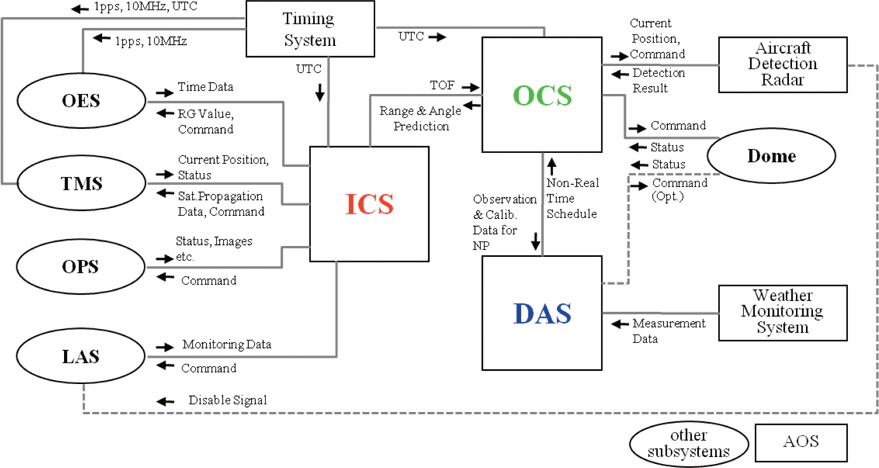
For the normal operation of entire system, various subsystems and operation equipment should be accompanied in addition to AOS (ARGO-M Operation System) (Seo et al. 2009, 2010) which includes operation software. AOS plays a main role for most of communications among these systems. Therefore, an interface design manual called ICD (Interface Control Document) is essential for the system design. In the course of design stage, discussions, design and implementation were performed for communication method, operation logic, in addition to the identification of communication interfaces between other sub-system and the operation equipment. Although the concept of basic communication adopts Ethernet communication, there are cases of using an exclusive controller for the communication due to the nature of hardware. Fig. 4 shows the data flow to analyze the interfaces between other sub-systems and the operation equipment (Seo et al. 2010). The oval shape indicates the other sub-systems except AOS and the rectangular shape represents operation computers and operation equipments comprising AOS. The ICD is prepared largely dividing external interfaces and internal interfaces based on the data flow of communication described above. The external interfaces represent interfaces between AOS and other sub-systems and the internal interfaces indicates the interfaces among low level components or configuration items in AOS. Fig. 5 (KASI 2011a) shows a sample of AOS internal interface described in the ICD which is a capture of the interfaces between OCS (Operation Control System) and one of the operation equipment of radar system. The communication information from OCS to radar is shown in this figure. The number of interfaces identified during the design process is shown in Table 4.

Quantity of the identified communication interface (IF). AOS: ARGO-M operation system, OPS: optics subsystem, OES: opto-electronics subsystem, LAS: laser subsystem, TMS: tracking mount subsystem, ICS: interface con¬trol system, OCS: observation control system, DAS: data analysis system, WMS: weather monitoring system, Timing: Timing system.
3.3 Analysis of Main Algorithm and Development of Prototype Model to Reduce the Risks in Performance
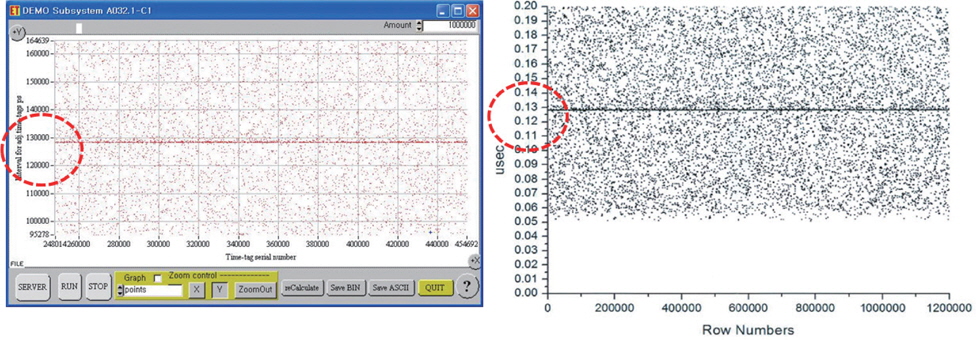
The greatest risk factor of performance elements and the core functions are implemented through a prototype model and verified. The prototype model is chosen to verify the on-line primary algorithms. The primary algorithms are divided into those which require the on-line operation of the system for observations and off-line system to analyze the raw data obtained through observations. The analyzed algorithms are shown in flowchart (Seo et al. 20011a) and the verification is performed in the review phase of the detailed design. First of all, as a target of prototype model considering functional verification, an on-line processing algorithm which processes the raw data obtained from the observation of ground targets. For the performance verification, the target of laser repetition rate, the processing capability within 2 kHz is chosen. Also, a user interface terminal is implemented to verify the performance of on-line data display during the implementation of the prototype model. Fig. 6 (Seo et al. 2011b) shows the system block diagram to develop the prototype. The results of Fig. 7 were obtained according to this diagram. The left graph of Fig. 7 shows the plot of a measurement program provided by the manufacturer of Event Timer A032-ET (Bespal’ko 2006) which is a measurement test equipment for the verification and validation. The right graph shows the plot of raw data obtained from the observation using the prototype model. According the results of analysis, both graph show 128 ns to show an agreement. Thus, it was possible to verify the weighted function and the performance through the development of the prototype model.
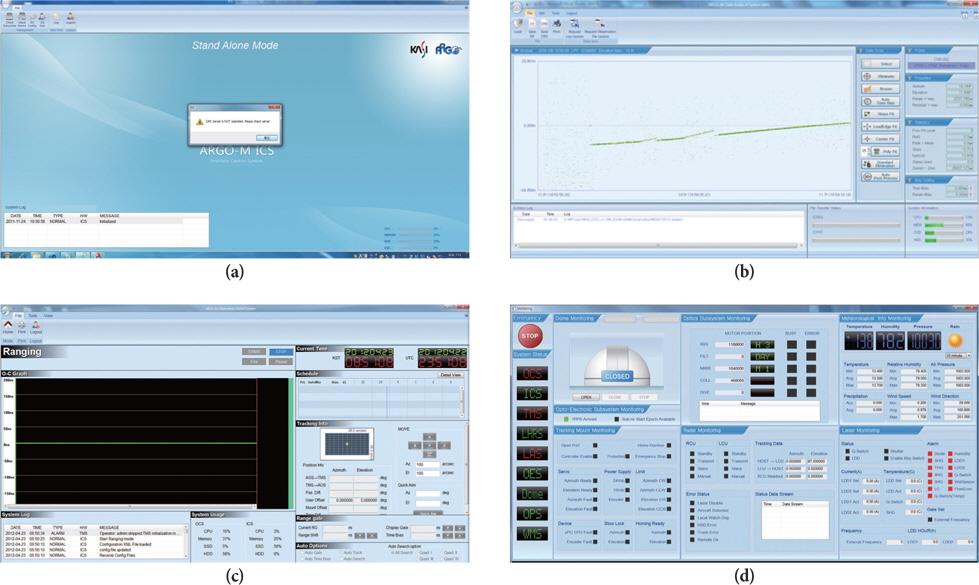
The process of implementation comprises coding and documentation for all the elements defined during the design process. Also, the required developer tests during coding process was performed internally. Microsoft Windows 7 64bit is selected as the operating system of the target developing system and the implementation tool is Visual C++ 2008. The system-wise user interface displays are shown in Fig. 8. These were implemented according to the user interface design documents prepared during design stage.
Official software tests consists of 3 phases as described in Table 5. However, the source level tests which are performed by the developer during the developing phase are excluded from this classification. Pre-installation tests were performed by the developer after the implementation. For this test, test stubs and drivers were constructed to enable self-tests since the interfaces with other sub-systems were not set up completely. Postinstallation tests were performed after the completion of whole system integration through site installation. The test stubs and the drivers used for pre-installation tests are replaced with the actual sub-systems and operation equipments. Also, most of the test cases of pre-installation tests were repeated for re-confirmation and some tests are added for the post-installation tests. In Table 6, the number of test cases performed (KASI 2012c, 2012d, 2012e, 2012f, 2012g, 2012h, 2013a, 2013b, 2013c, 2013d, 2013e, 2013f) are classified according to the test and the phase for each host computer. Test cases are classified as module tests and system tests in accordance with the nature of the test. The system integration test which is the third phase test in Table 5 should be performed by preparing the integration test scenario which is consistent with the actual system operation scenario. However, this integration test will be performed during the warranty maintenance phase rather than during software development phase considering the characteristics of entire system development.
[Table 5.] The content of the planned software test.
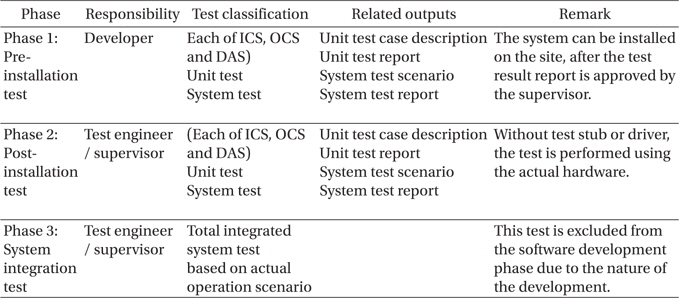
The content of the planned software test.
[Table 6.] The number of the identified test case.
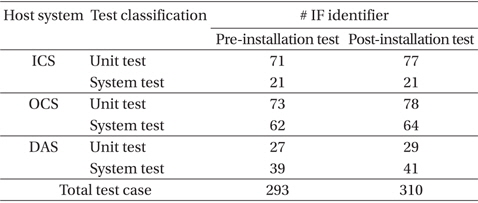
The number of the identified test case.
4.1 Analysis of the Results Through Requirement Tracing Table
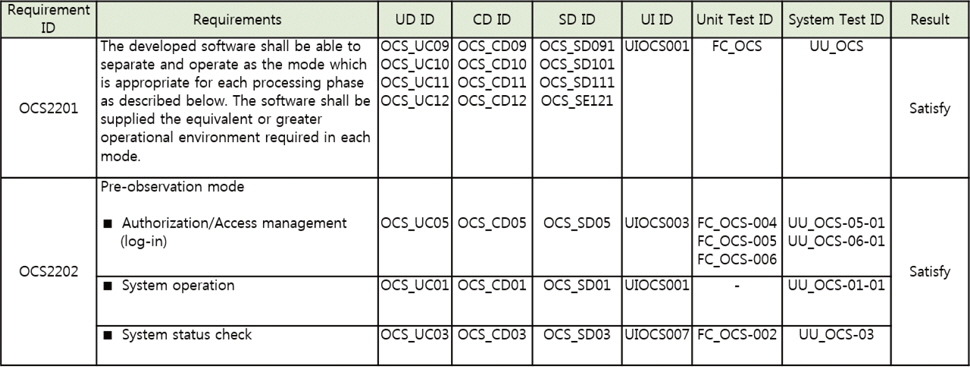
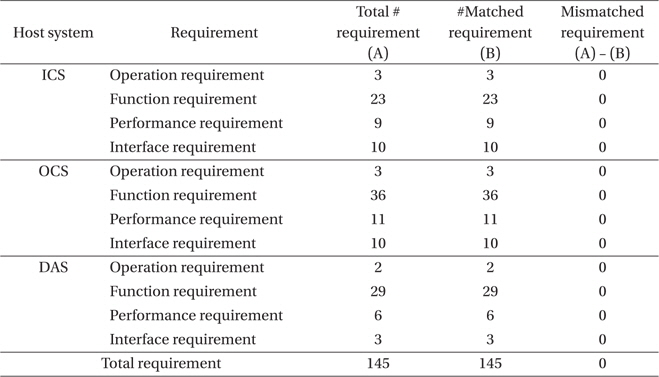
The requirement tracing table was prepared during the planning phase for the analysis of the results of this research to find out the effect on the software development results compared to the original development plan. In order to verify the consistency and the integrity among the products, the requirement tracing table traces the software requirements starting from the proposal of the project before the initialization of the project until the complete development of the requirements or the exclusion of the requirement out of the scope due to a change (Kim & Rhew 2007). Fig. 9 (KASI 2011c) shows the sample image of OCS requirement tracing table which is one of the development configuration items. The requirement tracing table consists of functional requirements and non-functional requirements with the same trace field. Forward tracing is performed for the requirements among products and the result of acceptance is filled out in the last field according to a qualitative decision. The numbers of satisfaction in the last field of the host-system dependent requirement tracing table (KASI 2011b, 2011c, 2011d) were compared with those of the corresponding requirement, in Table 7. In other words, the table shows the result of agreement or disagreement compared to the original requirements. Consequently, the original requirements are met completely and the results are satisfactory.
[Table 7.] The result of the requirement satisfaction.

The result of the requirement satisfaction.
4.2 Improvements for the Application of Output Management Technique Based on CBD Methodology
All the applied outputs suggested in Table 3 were derived according to the outputs of CBD methodology and are satisfactory in large. However, the outputs related to the post-installation are not satisfactory since the delay in the development of other hardware sub-systems resulted in the completion of post-installation tests behind schedule. While in the pre-installation tests, test stubs and drivers were constructed to enable self-tests without the interfaces with other sub-systems, it is essential to make interfaces with other sub-systems during post-installation tests, the tests are affected directly by the completion status of the entire system. Hence, the derivation of test cases, conduction of tests, and result report, all were not satisfactory. Therefore, it turned out to be necessary to find a new approach to take into account of the hardware development together with software development interfacing each other.
The purpose of this research is to review current methodologies of development to select the best one for the development of astronomical observation equipment and to present the results of application of the methodology. As a result of the application, the requirements were met and the outputs are satisfactory compared to the original planning. Above all, this research would be an example of systematic software development and it was possible to check the progress versus plan. However, there was a delay in the post-installation test due to the troubles in the interfaces with other sub-systems to cause the results of integration test to be dissatisfactory. Therefore, this issue is necessary to be corrected later even with the application of output management technique according to the conventional methodology. The components derived in this research comprise interfaces with surrounding equipments and those will be reused for the subsequent system development. This study would be the example of the first application of the software development methodology in the domestic astronomical observation system area. Thus, there have been difficulties due to the lack of understanding of the methodology. It is considered that these difficulties could be overcome gradually according to the application of other methodologies. For further research, a different methodology could be applied to the development of similar system and the effect and the characteristics could be compared and quantitative quality analysis would be possible according to ISO/IEC 9126. The process and results of this study would contribute to the investigation for a more appropriate methodology in the area of similar system development in the future.