This study simulated the egg vertical distribution of mackerel
고등어(
제주도와 대마도 주변해역은 고등어의 산란장이며, 산란기간은 3-6월, 주 산란기는 4-5월이다(Cha et al., 2002). 산란을 마친 고등어는 7-11월 동안 서해와 동해에서 섭이활동을 하다가 12월부터 다음해 2월까지 월동을 위해 제주도를 포함한 남해로 회유한다(Choi et al., 2003). 고등어는 부화 후 1년이면 성숙체장 28.6 cm (NFRDI, 2010)에 이를 정도로 초기성장률이 매우 빠르므로 환경변화에 취약한 초기생활사 시기의 생존율은 다음해 고등어 가입에 직접적으로 영향을 줄 수 있다. Kim et al. (1999)의 연구에 따르면, 먹이생물인 동물플랑크톤의 현존량은 1-2년 이후의 고등어 가입과 양의 상관관계가 있는 것으로 나타났다. 지금까지 국내 고등어 초기생활사 연구는 난발생과 자치어의 형태 발달(Kim et al., 2008; Park et al., 2008)과 난발생과 자어에 미치는 수온 및 염분의 영향(Hwang et al., 2008) 등이 있다. 따라서 고등어 생활사와 생태학적 특징을 바탕으로 한 가입량 예측을 통해 효과적으로 자원을 관리하기 위하여 초기생활사 연구가 절실히 요구된다.
알의 수직분포에 대한 정보는 알의 산란장에서의 분포, 보육장으로의 운송, 초기생존율 등과 같은 생태학적 특징을 이해하는데 중요하게 쓰인다. 이러한 수직분포를 결정짓는 생물학적 요인 중의 하나가 알 비중(Sundby, 1991)이며, 여러 연구에서 알 비중과 관련된 산란전략이 나타난다. 예를 들면, 벵겔라 북부 용승지역에 출현하는 케이프 민대구(
본 연구에서는 실험을 통해 얻은 고등어 알의 비중을 모델에 반영시켜 물리적 환경변화에 따른 알의 수직적 분포특성을 이해함으로써 고등어의 자원회복과 관련된 초기생활사, 가입기작, 자원량 추정 등을 밝히는 연구에 기여하고자 한다.
본 실험은 국립수산과학원 미래양식연구센터에서 2013년 5월(22일-26일)에 2회(S1, S2)와 6월(10일-14일)에 5회(S3-S7)에 걸쳐 수행되었다(Table 1). 자연 산란된 고등어 알을 얻기 위해 약 300개체의 고등어를 한 개의 실내수조로 옮겨 사육하였다. 실험기간 동안 사육조 수온은 17.5-20.1℃, 염분은 33.0-34.8 psu 범위로 변동하였다. 모든 개체는 성숙체장인 28.6 cm이상 이었다. 자정 무렵에 산란된 고등어 알은 새벽 6시경 수조의 배수관에 연결된 채집망을 통해 수거되었다. 알은 즉시 실험실로 옮겨져 실체현미경(Zeiss stemi DV4)을 이용하여 발생단계와 난질의 상태가 파악되었다. 알의 발생단계는 수정 이후 경과 시간(hours after fertilization, haf)으로 표시되었고, 난경은 만능투영기(Nikon profile projector V-10)를 이용하여 0.001mm까지 측정되었다.
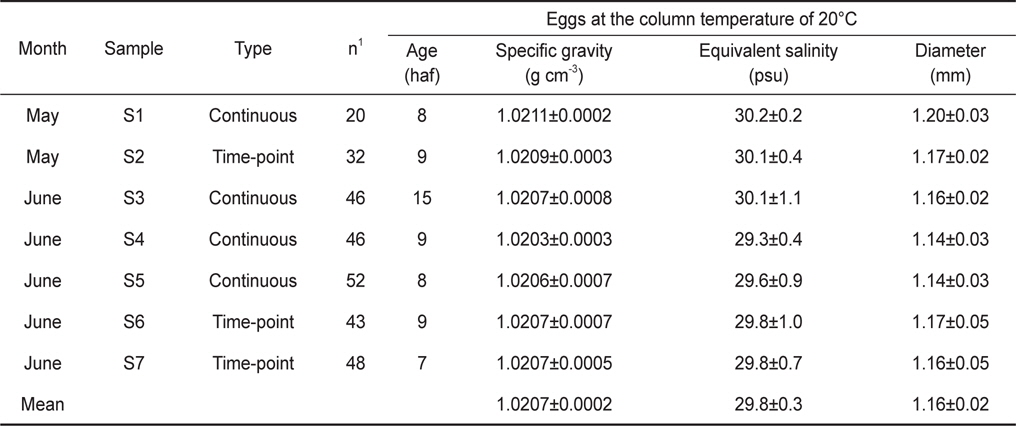
Egg characteristics at early developmental stages from continuous measurements and time-point measurements. The egg specific gravity was also expressed as equivalent salinity units of egg neutral buoyancy. Age means egg stages shown as hours after fertilization (haf). Values are mean±one standard deviation
고등어 알의 비중실험은 연속측정법(continuous measurements; S1, S3-S5)과 순간측정법(time-point measurements; S2, S6-S7)의 두 가지 방법으로 수행되었다. 연속측정법은 수정 후 약 8시간(포배기, 8 haf)부터 부화할 때까지 알의 비중변화를 2시간 간격으로 연속적으로 관찰하는 방법이며, 순간측정법은 특정 발생단계에서만 비중을 관찰하는 방법이다. 초기 발생단계는 7-9 haf로 일치시켰으나, S3의 경우는 15 haf로 하였다.
실험은 비중측정기(density-gradient column)를 이용하였고, 모든 실험기기의 설치, 사용, 보정은 Coombs (1981)의 논문을 참고하였다. 여과 해수(~34 psu)와 천일염을 이용하여 저염분(~20 psu)과 고염분(~48 psu)의 용액을 만든 후, 기기를 작동시켜 80 cm 높이의 유리관을 조밀한 염분층으로 만들었다. 유리관의 위쪽은 가장 염분이 낮은 약 20 psu였고 아래쪽으로 내려가면서 점차적으로 높아져 유리관 바닥은 약 43 psu였다. 유리관의 수온은 냉각기를 이용하여 20℃로 유지하였다. 비중을 알고 있는 유리구슬 5개를 유리관에 투입하여 1시간 이후에 유리구슬의 위치를 읽었다. 처음 유리구슬의 비중이 결정될 때의 수온은 23℃로 유리관 수온인 20℃와 차이가 있어 유리구슬의 비중은 열팽창이론에 근거하여 보정되었다. 즉 (유리구슬의 밀도)+(수온 차이)×(유리구슬의 밀도)×0.000028. 비중이 서로 다른 유리구슬은 유리관 안에서 고유의 비중 위치에서 정지하였고 유리관 높이(독립변수)와 유리구슬 비중(종속변수)간의 회귀분석을 통하여 관계식이 만들어졌다: 비중=a×높이+b. 피펫을 이용하여 약 20-50개의 알을 유리관에 투입한 후 1시간 이후에 알의 위치를 읽었다. 알의 비중은 위에서 구한 회귀분석식에 알의 정지한 높이를 대입하여 계산되었다.
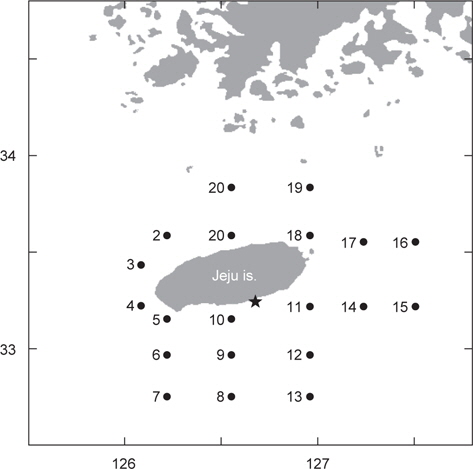
국립수산과학원 아열대수산연구센터는 2013년 봄에 제주도 인접해역 20개 정점에서 총 2회의 CTD 조사를 수행하였다. 1차 조사는 5월 1일부터 4일까지, 2차 조사는 약 한달 뒤인 5월 29일부터 6월 1일까지 동일한 정점에서 해수의 수온, 염분, 밀도를 관측하였다(Fig. 1). 바람의 세기는 기상청 해양기상월보에 기록된 2013년 4-6월 동안 지귀도(위도 33° 13´, 경도 126° 39´)의 일일 평균풍속을 이용하였다(KMA, 2013).
고등어 알의 수직분포는 대표정점 3곳(중국대륙연안수의 영향을 받는 정점 3, 대마난류수의 영향을 받는 정점 15, 제주연안수의 영향을 받는 정점 17)에서 Sundby (1983)의 안정상태분포 이론를 바탕으로 개발된 수치모델(Ådlandsvik, 2000)을 이용하여 예측하였다. 모델에 이용된 정보는 본 실험을 통해서 얻은 알의 비중과 크기, CTD 조사에서 관측된 수온과 염분, 기상청에서 기록한 지귀도의 일일평균바람의 세기였다.
연구결과의 통계적 유의성 검정은 R version 2.10.0 (2010)을 이용하여 Student’s t-test와 공분산분석[Analysis of covariance (ANCOVA)]을 실시하여 유의수준 5% 이내(
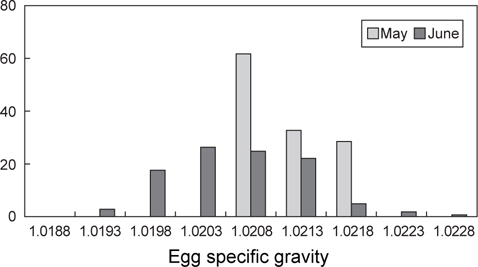
초기 발생단계에서 알의 특성을 채집시기별로 비교하였을 때 (Table 1), 월별 평균 비중은 5월에 1.0210, 6월에 1.0206이었으며, 5월의 평균 비중이 다소 높았다(t-test,
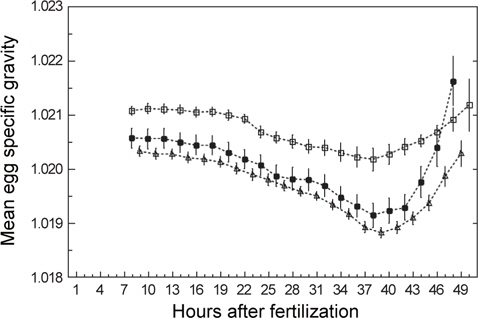
발생과정 동안 일어나는 알의 비중변화를 관찰하기 위하여 수정 후 약 8시간(포배기)부터 부화(수정 후 48-50시간)까지 2시간 간격으로 비중을 연속측정하였다. 모든 연속측정에서 비중은 일정한 패턴으로 변하였다(Fig. 3). 수정 후 8시간부터 비중은 꾸준히 감소하다가 약 38시간(배체의 기관이 대부분 형성됨)이 되면 최소로 낮아졌으며, 부화 직전에 비중은 갑작스럽게 증가하였다. 비중의 변화량을 비교하면, S1은 8시간부터 38시간까지 0.0009의 감소량을 보였고 S4는 9시간부터 39시간까지 0.0015, S5는 8시간부터 38시간까지 0.0014로 S1보다 약 1.6배 감소량이 많았다. 최소값에서 부화까지의 비중 증가량은 S1이 0.0010, S4는 0.0015, S5는 0.0025였으며, 부화단계에서는 모두 첫 포배기에서의 비중값을 회복하거나 높아지는 것을 관찰 할 수 있었다(Table 2).
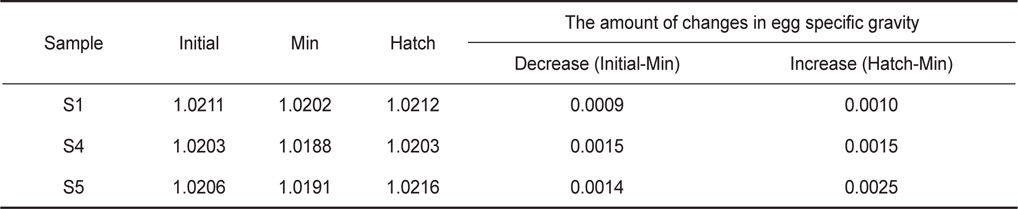
Changes in egg specific gravity during development of S1, S4 and S5 continuous measurements. Initial, Min and Hatch indicate the mean egg specific gravity at the time of initial stage of experiments, minimum specific gravity, hatching, respectively
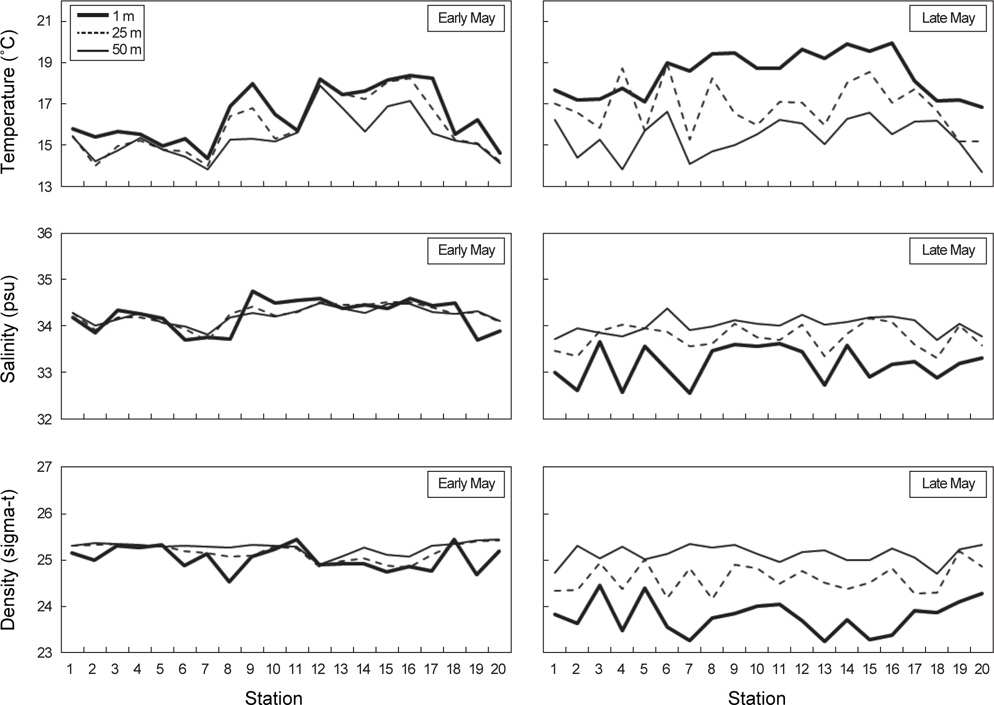
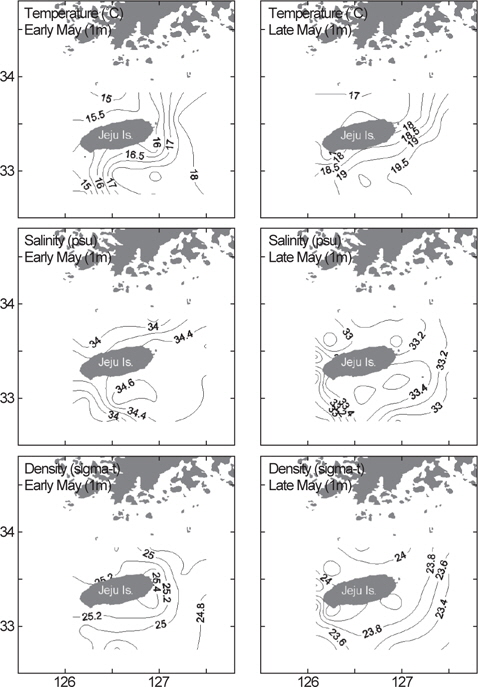
제주도 인근 물리환경의 수평분포를 살펴보면, 5월 초 1차 조사에서 표층수(1 m)의 수온은 14.4-18.4°C, 염분은 33.7-34.8 psu, 밀도(sigma-t)는 24.6-25.5의 범위로 분포하였다(Fig. 4). 5월 말에 실시한 2차 조사에서는 수온은 상승하여 16.9-20.0°C의 범위였고, 염분과 밀도는 모두 낮아져서 각각 32.6-33.7 psu, 23.3-24.4였다(Fig. 4). 1, 2차 조사에서 동일하게 남쪽과 동쪽해역은 대마난류수의 영향으로 북쪽과 서쪽해역에 비해 상대적으로 고온, 고염한 특성을 보였다.
각 정점에서 대표수심 1 m, 25 m, 50 m를 선택해서 수온, 염분, 밀도의 수직적 분포양상을 알아보았다(Fig. 5). 대체적으로 수온, 염분, 밀도의 수심별 차이는 5월 초보다 5월 말에 크게 나타났다. 특히 5월 말 남쪽과 동쪽해역에 위치한 정점에서 1 m에서 50 m 범위 내 수온과 밀도의 변동폭이 컸다.
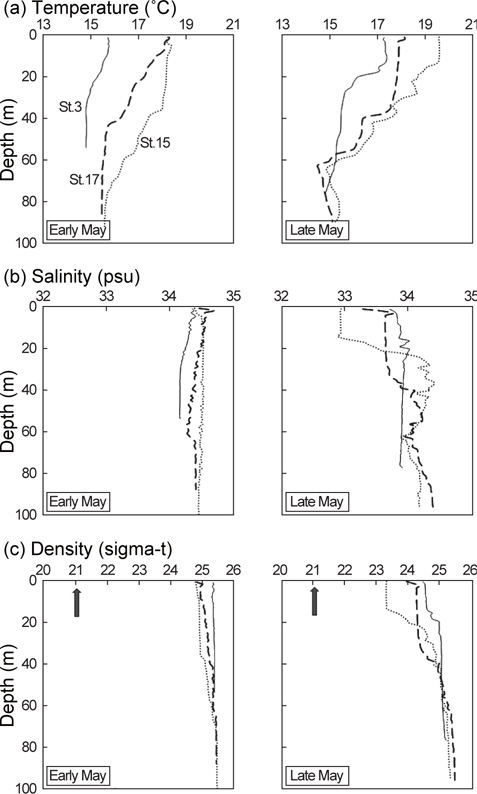
5월 초 해수의 수온, 염분, 밀도는 수층간 변동폭이 크지 않았지만 5월 말에는 표층의 수온이 상승하면서 약층이 형성되었다(Fig. 6). 5월 말 수온약층은 정점 3과 정점 15에서 수심 15 m 부근에서, 정점 17에서는 수심 35 m 부근에서 시작되었고 정점 15의 수온약층이 수심 60 m까지 가장 깊게 형성되었다. 염분약층과 밀도약층은 5월 말 정점 15에서 수심 15-30 m 사이에 두드러지게 나타난 반면, 나머지 정점에서는 미약하게 형성되었다.
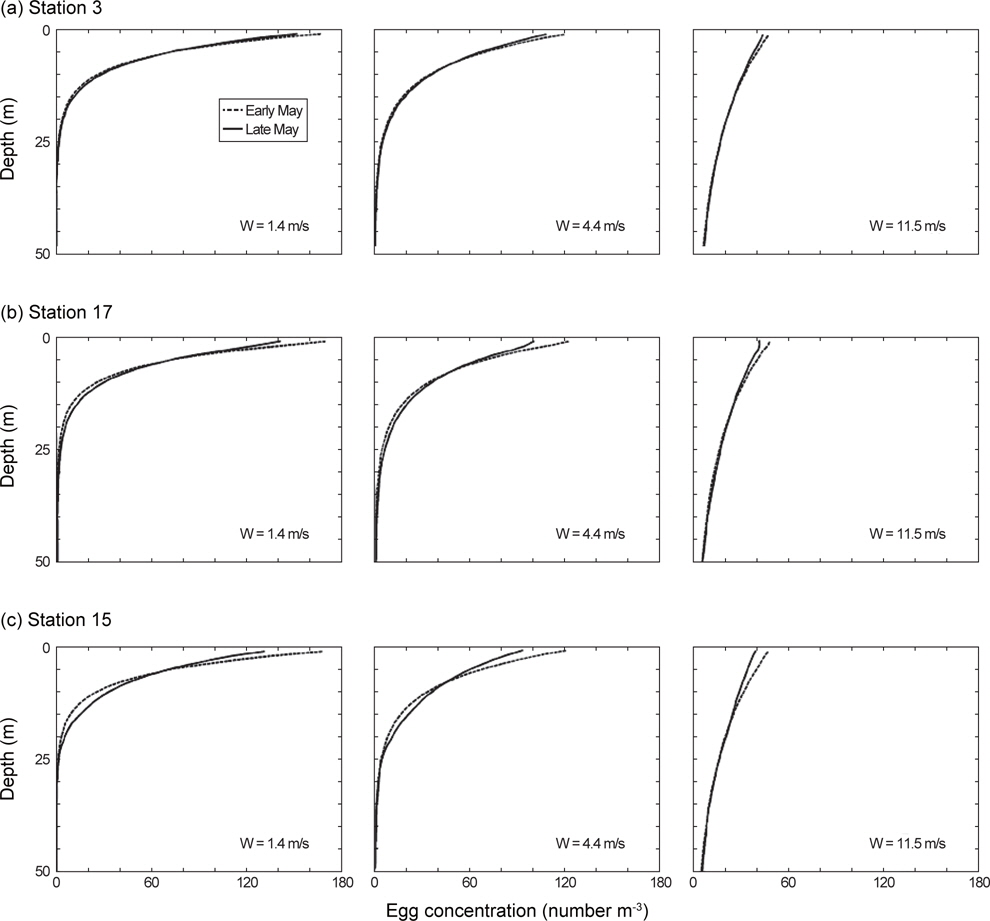
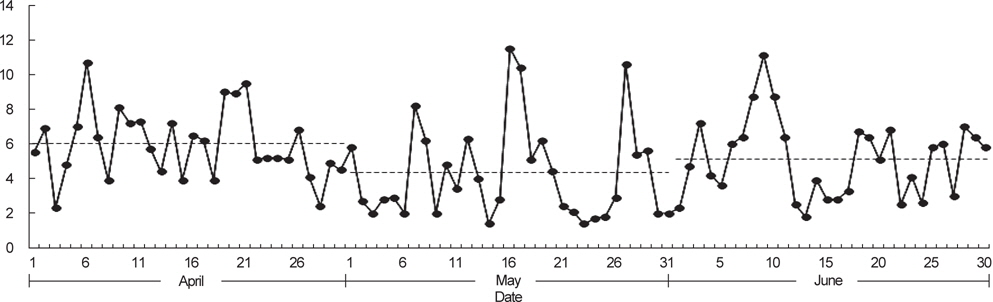
제주도 남부해역 연안에 위치하는 지귀도에서 2013년 4-6월 동안 관측된 바람의 세기는 평균적으로 4월에 6.0 m/s, 5월에 4.4 m/s, 6월에 5.2 m/s로 나타났으며, 5월은 다른 달에 비하여 3 m/s 이하의 온화한 바람이 많이 불었다(Fig. 7). CTD 조사시기와 일치하는 5월의 바람 세기의 조건(평균 4.4 m/s, 최소 1.4 m/s, 최고 11.5 m/s) 아래에서 고등어 알이 수직적으로 어떻게 분포할 수 있는지 살펴보았다(Fig. 8). 모든 가정에서 공통적으로 알의 개체수는 표층으로 갈수록 더욱 많았고, 바람의 세기가 같은 조건에서는 정점간의 수직분포 패턴이 매우 유사하였다(ANCOVA, F<0.01,
고등어 알은 분리 부성란으로 한 개의 유구를 가지고 있었으며 수정에서 부화까지 소요된 시간은 수온 20°C에서 약 48-50시간이었다. 난경은 1.14-1.20 mm로 지금까지 보고된 태평양산 고등어 알의 난경인 Kramer (1960)의 1.06-1.14 mm, Watanabe(1970)의 0.90-1.10 mm, Kim et al. (2008)의 0.98-1.02 mm, Park et al. (2008)의 0.94-1.02 mm보다 다소 컸으나 Yamada et al. (2007)의 0.90-1.30 mm의 범위에는 포함되었다.
부화기간 동안 알의 비중은 일정한 패턴으로 변하였다. 먼저 초기발생단계의 알은 시간이 지남에 따라 비중이 점차적으로 감소하였고 배체의 기관이 대부분 형성된 단계부터 부화까지는 갑작스럽게 증가하는 것을 관찰할 수 있었다. 이러한 패턴은 앞서 보고된 대서양 대구(
알의 부력(Δρ)은 환경수(ρwater)와 알(ρegg)의 비중 차이로 정의된다(즉, Δρ= ρwater-ρegg)(Sundby, 1991). 만약 알의 비중이 주변 환경수의 비중보다 크면 알은 자연히 하강할 것이고, 알의 비중이 환경수보다 낮으면 상승할 것이다. 알과 환경수의 비중이 동일한 지점에서는 정지하는 중성부력을 나타낸다. 고등어의 산란장으로 잘 알려져 있는 제주도 주변해역(Choi, 2003)은 4-6월에 표층수의 수온이 약 13-21°C, 밀도는 1.023-1.026이다(KODC, 2013). 본 조사에서 고등어 알의 평균 비중은 수온 20°C에서 1.021이었기 때문에 알의 비중이 서식지 해수의 비중보다 2-5×10⁻³의 범위에서 낮을 것으로 판단된다. 따라서 고등어 알은 강한 부력으로 표층 가까이 떠오를 수 있게 된다. 이와 유사하게 일본산 정어리(
실제 해양환경에서 알의 수직분포는 생물학적(알의 부력, 알의 크기), 물리학적(해수의 밀도, 해수의 점성도, 난류 등) 요인들의 상호관계에 의해 결정된다(Sundby, 1991). 본 연구의 모델 결과에서 알의 수직분포는 바람 세기의 영향을 가장 크게 받는 것으로 나타났다. 5월의 온화하고 평균적인 바람의 세기에서 고등어 알은 표층에 가장 많이 존재하였고 수심이 깊어질수록 지수함수적으로 감소하였다. 알의 최고 분포수심은 약 25 m였다. 같은 조건에서 바람이 3배 이상 강하게 불면 표층의 알 개체수 밀도는 상대적으로 감소하였고 최고 분포수심은 50 m 부근으로 깊어졌다. 이러한 알의 수직분포 모델결과는 현장에서 실시한 채집결과와 유사하게 나타났다. 미국 서부해역에서 고등어 알은 수심 176 m에서 발견되기도 하였으나 대부분의 알이 표층에서부터 수심 23 m 이내에 분포하였고(Kramer, 1960), 일본 혼슈 연안에서는 고등어 알이 표층에서부터 수심 50 m 이내에 분포하였지만 대부분의 알이 수심 25 m 이내에 분포하여 본 결과와 매우 유사하였다(Watanabe, 1970). 대서양산 고등어 알은 일단 수온약층이 형성된 곳에서는 혼합층에 밀집하게 되지만 그렇지 않은 조건에서는 깊은 수심까지 알이 분포하는 경향이 있다고 한다(Coombs et al., 2001). 표층에서의 강한 바람은 아래 방향으로의 수직혼합을 크게 하여 떠오르려는 알의 부력을 상쇄시킬 뿐만 아니라 알을 수층 아래로 밀어내게 된다(Sundby, 1991; Tanaka and Franks, 2008). 이러한 이유로 현장조사는 바람의 세기, 수온약층의 깊이, 알의 부력을 모두 고려하여야 고등어 알의 채집효율을 높일 수 있을 것으로 판단된다.
제주도 인근해역에서 실시한 5월 말 환경조사에서 등온선은 대마난류수의 영향으로 북동-남서방향으로 뚜렷하게 나타났다. 북쪽과 서쪽해역은 상대적으로 남쪽과 동쪽해역에 비해 표층수온이 낮은 것을 볼 수 있었다. Hunter and Kimbrell (1980)의 고등어 알의 부화기간과 수온의 관계식에 따르면, 알은 15°C에서 4일, 20°C에서 2일의 부화기간이 걸린다. 따라서 같은 시기라도 제주도 북쪽에서 산란된 알은 남쪽에서 산란된 알보다 부화기간이 하루 이상 길어 포식에 의한 사망률이 높아질 수 있음을 유추할 수 있다.
Hunter and Kimbrell (1980)의 실험에서는 수온 14°C 이하에서 고등어 알이 부화하지 않았다. 따라서 알이 수심 50 m까지 분포한다고 가정하면, 5월 초 14°C 부근의 저온이 나타났던 정점 2, 7, 20은 알이 발생하기에 적절하지 못한 환경일 수 있다. 하지만 어미가 서식지 환경에 적응을 했다면 유전적으로 수온에 대한 내성을 자손까지 물려줄 수 있기(Hirshfield et al., 1980) 때문에 우리나라 서식지에서 초기생활사 연구를 통해 이러한 상관관계를 밝힐 필요가 있을 것으로 생각된다. 최근 Hiyama et al. (2002)의 논문에서 동중국해 중부해역의 고등어 주산란장에서 2월부터 6월까지 기록된 표층수 수온과 고등어 산란성공이 반비례관계에 있었지만 다른 산란지역에서는 유의성이 나타나지 않았던 것도 지역개체군마다 고유한 산란특성을 지닐 수 있음을 시사한다.