Vessel Traffic Service (VTS) has been used in major ports and coastal areas across the world in order to ensure safety and reduce the risk of maritime transport on the basis of Article 36 of the Maritime Safety Act (20), Article 28 of the open ports rules and regulations and IMO RESOLUTION A.857 [1]. Recently, vessels that need to participate in the VTS system have changed. Ships are lager and faster, and the traffic conditions are diversified in ports and coastal areas. Therefore, VTS operations have been developed as a means of providing important information for navigation. The tasks of VTS Operator (VTSO) have been extended as maritime traffic situations have become increasingly complicated. Sometimes, a task requires ones to develop the abilities to predict traffic situations and then to support decision making in emergency cases. Such special abilities include accuracy, agility, judgment, and decision making [2-6].
In Korea, the VTS system was established in 1993 in Pohang and is in operation in 14 ports and 1 inland area. Advances have been made to the VTS system in order to provide better services to users under rapidly changing traffic environments. Irrespective of the introduction of the advanced system, a task to be conducted by the VTSO requires him to predict developing situations. It supports the right decision making of VTSO and helps to solve complex situations by providing better information from the considerable amount of available information [4, 7-9]. In this paper, a Cognitive Work Analysis (CWA) is carried out to understand the constraints of the current operating system and to find out factors to be improved. As a result, a prediction tool for traffic situations is proposed.
The CWA has been applied in various fields in which human errors have a significant impact on accidents. Nam et al [10]. applied Work Domain Analysis (WDA) and Ecological Interface Design (EID) to vehicle control display in order to develop information needs for drivers. Park and Myung [11] created an ecological interface design for a navy ship’s radar display that contains new information with information requirement (IR). Hong [12] presented a CWA method for safe ship navigation through a case study. Meanwhile, there are studies on the development of a control display for air traffic control [13] and railway stations [14] through WDA and EID. In this study, we intended to develop a method for reducing the VTSO’s work stress through CWA and traffic analysis. We also attempted to develop a supporting system taking into consideration the characteristics of the VTSO’s working environments.
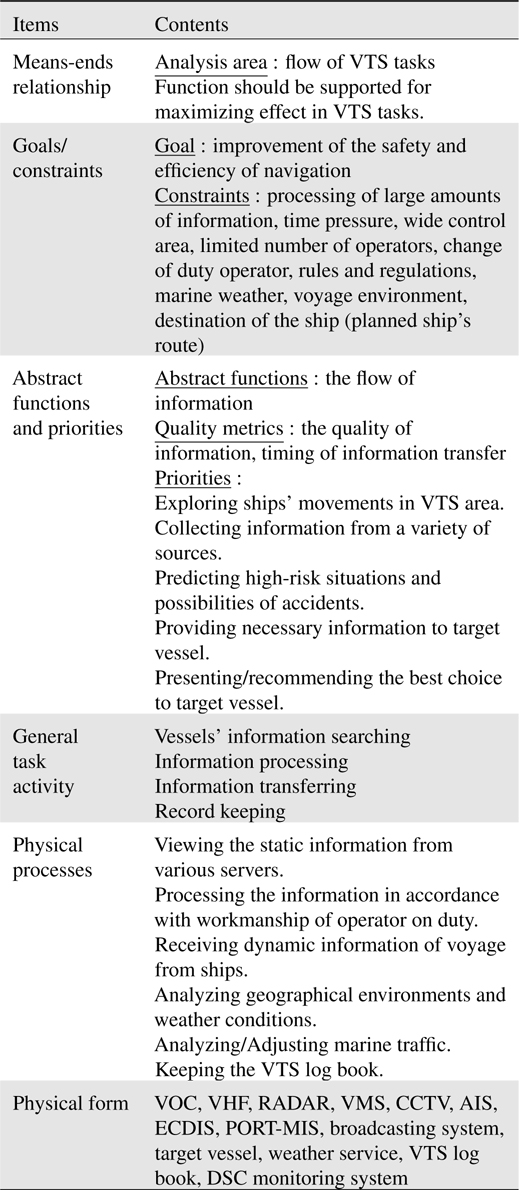
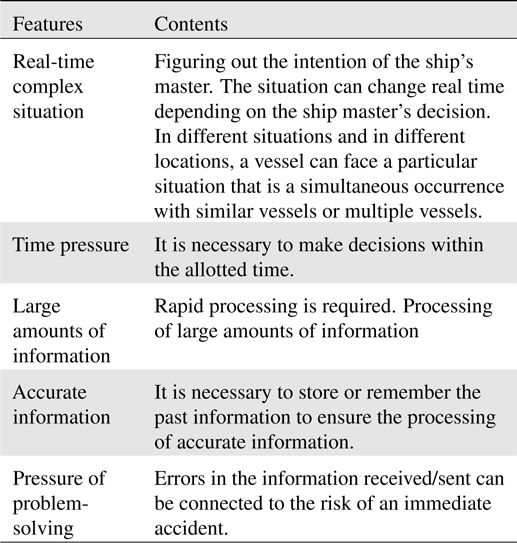
The VTS system has three major objectives: to improve the safety and efficiency of navigation, to improve the safety of life at sea, and to protect marine environments. Chapter 5 of The International Convention on the Safety of Life at Sea Convention (SOLAS) describes that a coastal state may install and operate VTS to ensure maritime safety and the protection of maritime environments in its regulation 12. In SOLAS 1972, the roles and responsibilities of a coastal state are clarified at territorial sea. The VTS has the following three different services [1]: The Information Service (INS) is provided by broadcasting information at fixed times and intervals or when deemed necessary by the VTS or at the request of a vessel, and may include for example reports on the position, identity, and intentions of other traffic; waterway conditions; weather; hazards; or any other factors that may influence the vessel’s transit. The Traffic Organization Service (TOS) concerns the operational management of traffic and the forward planning of vessel movements to prevent congestion and dangerous situations, and is particularly relevant in times of high traffic density or when the movement of special transports may affect the flow of other traffic. The service may also include establishing and operating a system of traffic clearances or VTS sailing plans or both with respect to the priority of movements, allocation of space, mandatory reporting of movements in the VTS area, routes to be followed, and speed limits to be observed or other appropriate necessary measures considered by the VTS authority. The Navigation Assistance Service (NAS) is particularly important in difficult navigational or meteorological circumstances or in the case of defects or deficiencies. This service is normally rendered at the request of a vessel or by the VTS when deemed necessary. Taking into account the VTS functions, the VTS has special work environments, as listed in Table 1.
[Table 1.] Characteristics of Vessel Traffic Service operations

Characteristics of Vessel Traffic Service operations
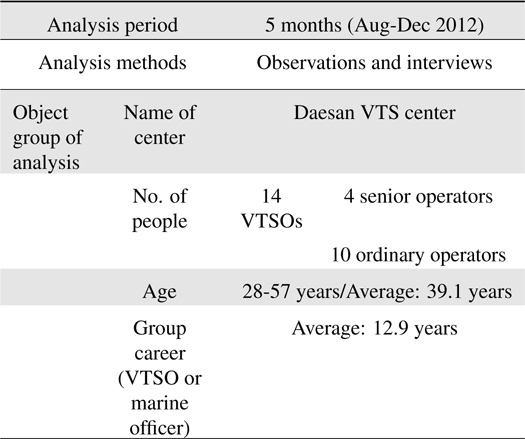
The CWA is carried out to investigate how essential information activities occur between a system and humans in an actual field [15, 16]. It was developed in the 1980s by the Risoe National Laboratory in Denmark. This framework has been applied to engineering fields in various task environments, such as nuclear power plants, hospitals, and factories. As shown in Table 2, CWA has been conducted for a VTSO as follows: Period of analysis: 5 months from Aug. 2012 to Dec. 2012 Methods of analysis: observations and interviews Object group of analysis: 14 VTSOs at VTS center/Daesan port office in Korea (4 seniors/10 ordinary operators aged between 28 and 57 years with an average group career of 12.9 years as VTSO or marine officer).
[Table 2.] Analysis Environments

Analysis Environments
The means-ends analysis is the analysis tool that is commonly used for estimating the dimensions of each target to analyze the constraints in each dimension. However, it is more effective for the analysis of activities and work domains [15-17].
1) Goals/constraints: what is the ultimate goal? What is the unit that can be changed but is effective with respect to the work domain, activities, and decision making? 2) Priorities: what is the best way to determine the action apt for achieving the desired goal with the given constraints? 3) Functions: what to do in general? 4) Processes: what are the activities to perform in an actual environment? 5) Resources: what resources are used for performing the desired activities?
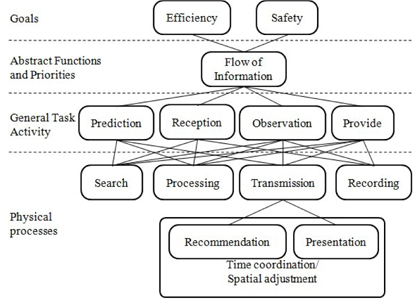
The primary function of the WDA is to determine the priorities and the value of a system; these must satisfy the purpose of the system and identify the constraints of the system [13, 18]. There is abstraction hierarchy (AH) in an effective way for the WDA. AH can be explained by the following five steps;
1) Functional purpose (why is the system designed?) 2) Abstract function (general principles of the system operation) 3) Generalized function (general features of the system) 4) Physical function (equipment and equipment systems to perform common functions) 5) Physical form (external location and character of physical function)
The components of each level are related to each other by the means-end relationship that is connected to a “why-what-how” relation [15, 17].
Figure 1 shows the result of the means-ends analysis and the WDA. It allows one to list the necessary tools (physical forms) that are used during a VTS operation; it is found that the tools (the paths of information extraction) are extremely tangled. Approximately 20 units are used for the input/output. The number of monitors used for a VTS operation at a work station is 14 units. The screens include 3 RADAR VOCs, 2 VMS, 4 CCTVs, 1 Port-MIS, 1 VHF DSC, and 2 VHFs. An adverse effect of reducing work efficiency and increasing the risk of an accident is observed. The problem in VTS operation is that various different methods of obtaining information are used. Therefore, it is necessary to integrate these sources into one frequently used source. The devices used for collecting information on each work process are divided as given in Table 3. We analyze the source and the frequency of equipment used in the VTS operation. Unification into a single device is required for efficient operation and reduction of operator stress. The various sources referred to above are listed in the following table. As can be seen from the table, the number of times duplication occurs is large; the information obtained from various sources needs to be integrated. Two PHYSICAL PROCESSES should be consolidated into one in the WDMs that are the items of SEARCH and PROCESSING. This will reduce the stress of the VTSO and enable him to recognize a situation intuitively.
[Table 3.] Results of means-end analysis

Results of means-end analysis
As it can be seen in Table 3, the extraction paths are also diverse. Therefore, the unification of frequently used paths is required. At the time of conducting each task, various activities are required with diverse physical forms, as shown in Table 4. Among these physical forms, some items such as ships, VHF, VMS, VTS log book, and adjacent VTS center are unable to integrate they are not required often. Therefore, it is necessary to maintain the current operational system. Meanwhile, the round-the-clock monitoring of items such as VOC (AIS, RADAR, and ECDIS) and CCTV is required, and these items are the necessary parts of cooperation with the prediction table. Therefore, other tools except for the above are considered in the prediction table. The main page of the prediction table can show the ease link to PORT-MIS, broadcast SYS, the meteorological agency website, and the pilot website without additional equipment in order to enable immediate access. The table contains some information of paper charts and relevant publications.
[Table 4.] Physical forms used in each physical process
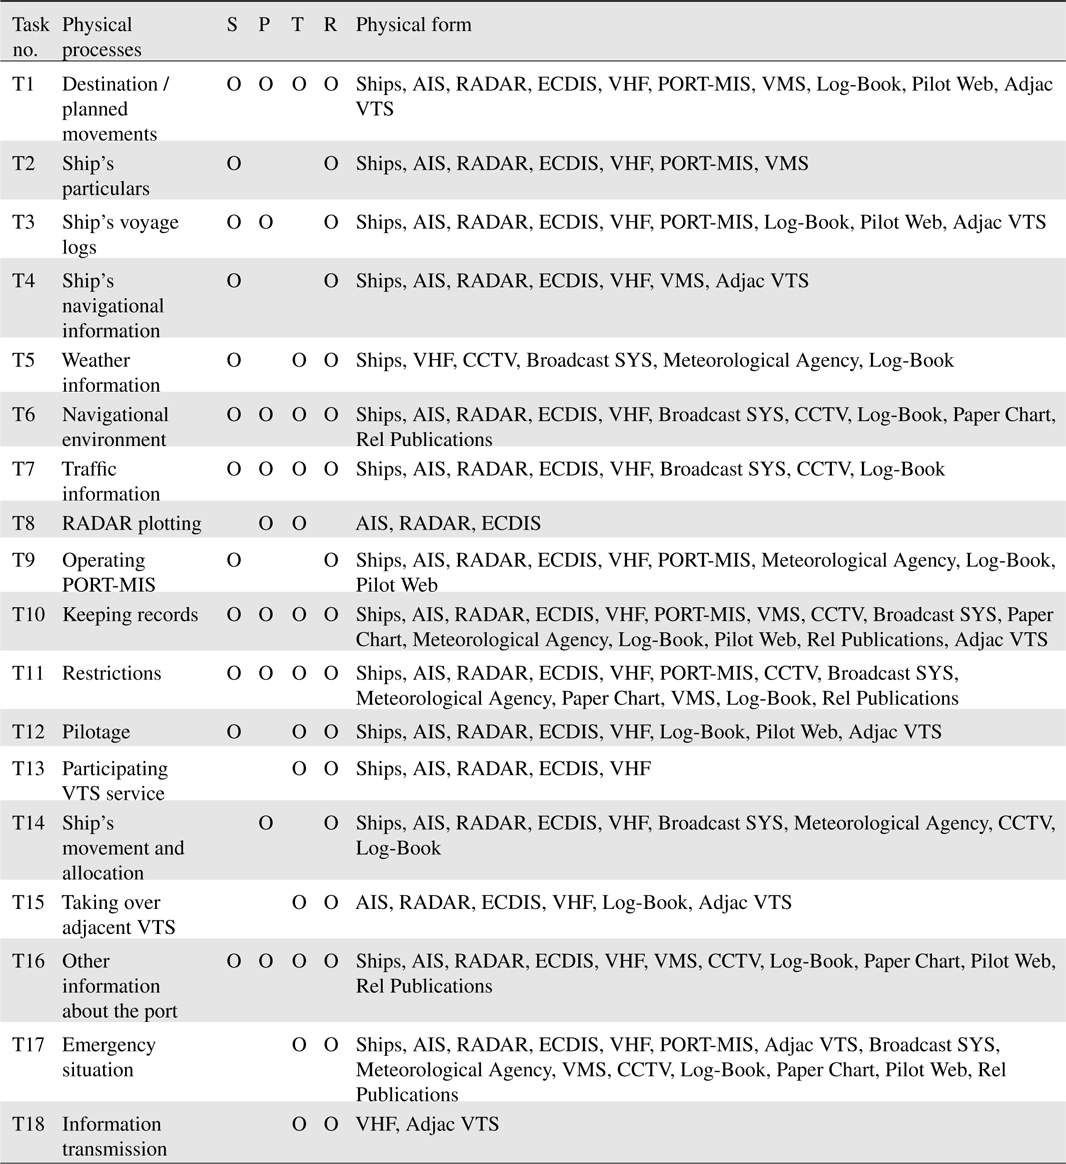
Physical forms used in each physical process
As a result of CWA, several constraints and improvements are determined. Information exchanges from the first reporting point to the final reporting point are conducted by operator in analog through the VHF, and the data cannot be browsed from the operator’s control console but from the other data servers. Therefore, the operator has to memorize a considerable amount of information, including the situation of the service area. This implies that almost all of the procedures for information exchanges depend on the operator’s abilities to remember and instantly provide the relevant information. As the operator focuses on searching data, he might come across an existing dangerous situation. Further, the operator has to make notes or have talks for a take-over because not every case can be identified automatically. It is necessary to improve the system for the extraction of necessary information, such as identification and automatic display of pilot services, port facilities, navigating hazards, and destination from the control console. It is also necessary to work with the system of pilots in order to expect a ship’s routes. This can be displayed for a planned passage of a certain ship from its entry to its berth.
Daesan port is a trade and open port. NW wind is the main wind direction. The port entrance is in the fairway between W of Taeanbando and SE of Jangantoe. The flood current mainly flows to ENE-NE, and the ebb current flows to SW-WSW. The maximum flood current occurs for 2.5-3.6 h before high water, and the average maximum tidal current is 1.3-3.5 knots. The maximum ebb current is observed for 2.4-3.7 h before low water. The VTS service area is approximately 25 miles from the west to the east, and the sandbar that plays the role of a natural breakwater exists in the transverse direction. Along the route of the sandbar, there are berthing facilities and anchorages as well as connecting passages to the main route.
4.2 Analysis of Maritime Traffic
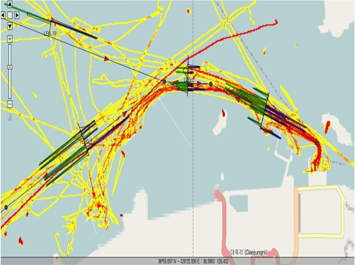
The survey of hazardous areas can be used as the main reference in the prediction table. The ships’ AIS data are input to the IWRAP program for classifying the ships according to their latitude, longitude, speed, and course in order to show the transit distribution. The survey period is 0000LT to 0800LT on 12th October 2012. The data are collected in the time zone with the least amount of transit in order to simplify the data. In Figure 2, the solid yellow line represents the wake of a single ship, and the solid red line denotes the duplicate wakes of ships. The green bar indicates the transit distribution of departure, and the blue bar denotes the transit distribution of the inbound vessels. It shows the distribution of the vessels’ transit from the baseline in the middle of the blue and the green bar. The arrow shows a transit-way or a two-way transit. The solid black line denotes a pre-set route in IWRAP, and the circle between the black solid lines represents the intersection.
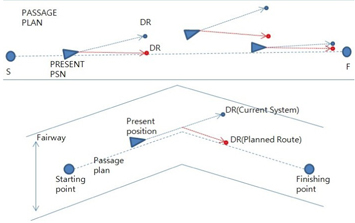
4.3 Application of Ship’s Route Plan
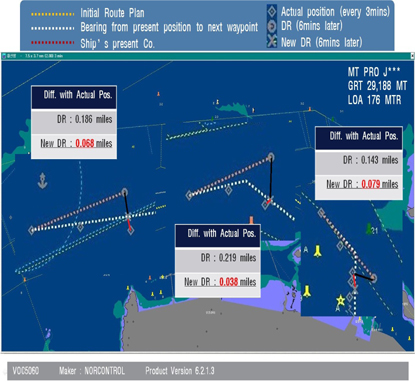
When anticipating a ship’s position in the current system, we assume the position of the ship at a certain time on basis of the received data of the fixed course and speed from AIS. However, this location is not reliable for sailing within the harbor limits because of the frequent changes in the ship’s course and speed. Meanwhile, the ship’s route can be estimated because vessels usually sail in specified passages within the harbor limit. This information can be obtained from the VTSO who knows the starting and the finishing points of a ship with the harbor limits. The VTSO abstractly predicts a ship’s route on the basis of the reported departure and arrival time of voyage in the harbor and can adjust the naval traffic to avoid any accidents. This implies that the prediction of marine traffic conditions depends on the VTSO’s personal ability in the current system. This has certain risks such as information missing for the duration of change in the duty or loss because of a change duty. Further, the VTSO is constantly assigned to assess and predict the conditions of traffic and provide this information. The purpose of application of a passage plan for a ship’s DR is to remove the element of risk and support the decision-making process of the VTSO. In the improved system, the expected location is based on the fixed ship speed and is pre-arranged according to the ship’s passage plan. Further, the ship’s passage plan will be displayed for preview to prevent confusion and support decision making. The information will be available through the VOC instead of a manual process and will contain he options of the approximately 42 points for the starting and the finishing points in the Daesan harbor. Therefore, the number of possible passage plans is 1722; i.e., 42 × 41. As shown in Figure 3, a ship’s predicted position seems to be deviated off the designated passage in the current system. However, the ship will be in the course line during the actual sailing along the route. The ship’s planned route is considered in the improved system. This prevents confusion, particularly in the case of complex harbor traffic by exhibiting the ship’s pre-passage plans. The improved system is a decision support system that takes into account the characteristics of the ship while sailing along the planned route.
The new calculation method of the ship’s DR was applied for the ship’s navigation within the Daesan harbor limit with M/T PRO J***, which was sailing from Anchorage A10 to Pier No. HD16. The position data were collected from the ship’s AIS every 3 min and plotted on the ECDIS of the VOC5060 program manufactured by NORCONTROL. As a result of the simulation, we observed that the DR based on the ship’s route plan is six times more reliable than that in the case of the existing system. Figure 4 compares the actual position of M/V PRO J*** with its DR.
4.4 Example of Prediction Table in Maritime Traffic
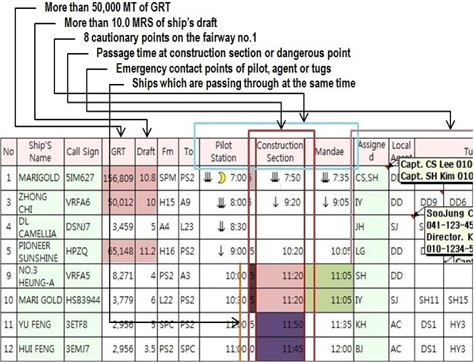
As a result of the analysis, we concluded that the route can be divided by specifying eight locations where the action of crossing, entering, and leaving the passage were frequently detected. As shown in Figure 5, the prediction table contains all of the required information within one screen in order to simplify the extraction paths. The table is based on the daily schedule of the harbor pilot and basically predicts the time of passing designated points for ships in order to identify the time of their encounter at these points, thereby predicting traffic situations and ships that are in the same area at the same time. This helps the VTSO’s decision making in advance. The prediction table can be used not only for the prediction of transit situations but also for the simplification of the information extraction paths. The main features of this table are as follows: 1) prediction of passage time and traffic situation at certain points; 2) provision of ship-specific information such as name, call sign, GRT, draft, and planned route; 3) ships’ GRT: more than 50,000 MT; 4) ships’ draft: more than 10.0 MRS; 5) cautionary points on the fairway 6) emergency contact points of pilot, agent, or tugs; 7) weather information such as time of sunrise, sunset, twilight, and tidal stream; and 8) links for relevant web pages such as PORT-MIS, broadcasting system, meteorological agency, and local pilot.
A systematic analysis of VTS operations is the first step for providing high-quality VTS services. In this study, CWA was carried out to understand the constraints of the current operating system and to find out factors that could be improved. A prediction table was introduced to simplify the path of information extraction and provide appropriate information on time. The function of the prediction table is not only to integrate various paths of information but also to predict the traffic situation in advance as the on-duty VTSO has to provide information to a target vessel within a limited time. Further, it is necessary to reduce the possibilities of accidents in advance by predicting future situations. Hence, the proposed prediction table will be useful to the on-duty VTSO. In the future, the transit patterns for each route need to be analyzed, and traffic routes need to be divided into detailed sub-sections in order to provide appropriate information to the VTSO on time. Furthermore, the proposed method can be used for developing a preview function on the VOC to display the future situation.
No potential conflict of interest relevant to this article was reported.

![Work domain model [13].](http://oak.go.kr/repository/journal/13860/E1FLA5_2013_v13n4_315_f001.jpg)