Morphological and genetic variation of two populations of
전 세계적으로 수산자원 관리의 방향은 감소된 수산자원의 회복에 초점을 맞추고 있으며, 이를 위해 다양한 수산자원조성 프로그램이 실시되고 있다(Bell et al., 2008). 국내의 경우 1980년대 후반 넙치(
강도다리(
집단간 유전적 다양성에 관한 연구에는 미토콘드리아DNA(mtDNA) 내 치환속도가 가장 빠른 control region이 주로 사용되며, 양쪽 성의 유전특성을 반영하는 동시에 돌연변이율이 높고 민감도가 우수하여 개체수준에서 식별 가능한 마이크로세틀라이트 DNA (msDNA) 마커가 활발히 사용된다(Sekino et al., 2002; Gonzalez et al., 2008, 2010).
따라서 본 연구는 강도다리 종묘를 지속적으로 방류해 온 울진과 그렇지 않은 포항의 2개 지역을 선정하여 이들 지역에서 채집된 강도다리의 형태적 차이를 분석하고, 서로 다른 유전자 마커를 이용하여 지역 집단 간의 유전적 다양성을 비교하고자 한다.
2009년부터 2010년까지 경상북도 울진연안에서 저인망으로 강도다리 30개체 및 경상북도 포항 형산강 하구에서 자망으로 강도다리 36개체를 각각 채집하였다. 채집 후 즉시 99% ethanol에 고정하여 사용하였다.
강도다리는 집단별로 27개체를 대상으로 형태 분석을 실시하였으며, 넙치나 가자미 종류의 인공 종묘에서 흔히 관찰되는 무안측의 검은 반점이나 손상된 지느러미 등 외부형태 특징을 중점적으로 조사하였다. 계수 및 계측은 Hubbs and Lager (2004)의 방법을 따라 버니어 캘리퍼스로 몸의 각 부위를 0.1 mm 단위까지 측정하였다. 계수형질로는 등지느러미 줄기수(Dorsal fin rays) 등 총 12개의 형질을 조사하였고, 계측 형질로는 체장 (Standard length) 등 총 19개의 형질을 조사하였다. 척추골수 및 골격 이상 현상은 soft X-ray (SOFT HA-100, Japan)를 이용하여 확인하였다.
분자분석은 강도다리 울진 집단 23개체와 포항 집단 36개체를 대상으로 mtDNA control region 염기서열 분석을 실시하였으며, msDNA분석은 집단별 30개체를 이용하여 실시하였다. Genomic DNA는 Chelex 100 resin (Bio-rad, USA) 150 μL가 들어있는 PCR튜브에 소량의 근육을 넣은 후, Thermal cycler (Bio-rad MJ mini PTC-1148, USA)에 넣은 후 60℃와 99℃에 각각 20분, 25분간 두었다. 추출된 Genomic DNA는 4℃에서 냉장 보관하였다.
MtDNA 분석은 Tinti et al. (1999)의 방법에 따라 foward primer: 5’-TTC CAC CTC TAA CTC CCA AAG CTA G- 3’ 및 Reverse primer: 5’-CCT GAA GTA GGA ACC AGA TGC CAG-3’ 를 이용하여 증폭시켰다. PCR은 10X PCR buffer 2.5 μL, 2 mM dNTP 2 μL, forward primer 1 μL, reversal primer 1 μL, FR taq polymerase 0.25 μL (Biomedic, Korea)를 섞은 혼합물에 genomic DNA 2 μL를 첨가한 후, 총 25 μL가 될 때까지 3차 증류수를 넣고 Thermal cycler (Bio-rad MJ mini PTC-1148, USA)를 이용하여 다음과 같은 조건으로 수행하였다. [Initial denaturation 95℃에서 4분; PCR reaction 34 cycle (denaturation 95℃에서 30초, annealing 60℃에서 30초, extension 72℃에서 1분); final extension 72℃에서 10분]. 염기서열은 ABI 3730XL sequencer (Applied Biosystems, USA)에서 ABI BigDye Terminator Cycle Sequencing Ready Reaction Kit v3.1 (Applied Biosystem, USA)를 이용하여 다음과 같은 조건으로 Cycle sequencing하여 얻었다: PCR reaction 30cycles (Denaturation 96℃에서 10초, Annealing 50℃ 10초, Extention 60℃ 3분).
MsDNA분석은 Miao et al. (2009)이 고안한 12개 좌위 중에서 6개의 정보를 사용하여 primer (Plst3, Plst8, Plst9, Plst13, Plst19, Plst37)를 제작하였다. PCR은 10X PCR buffer 2.5 μL, 2 mM dNTP 2 μL, forward primer 10 pmol, reverse primer 10 pmol, FR taq polymerase 0.15 μL (Biomedic, Korea)를 섞은 혼합물에 genomic DNA 2 μL를 첨가한 후, 총 25 μL가 될 때까지 3차 증류수를 넣고 Thermal cycler (Bio-rad MJ mini PTC-1148, USA)를 이용하여 다음과 같은 조건으로 수행하였다. [초기 denaturation 94℃에서 4분; PCR reaction 29 cycle (denaturation 94℃에서 30초, annealing 57℃에서 40초, extension 72℃에서 40초); final extension 72℃에서 7분]. PCR 완료 후 1% Agarose gel에 PCR product 와 10X loading buffer (Takara, Japan)를 섞은 혼합물을 넣은 후, 전기영동기(Mupid-One Mupid-exU, Japan)를 100 voltage에서 30분 동안 작동 시켜 밴드의 유무를 판독하였다. 각 개체의 유전적 다형도는 PCR 산물에서 형광 염색된 대립유전자 절편의 크기를 ABI PRISM 3130XL automated sequencer (Applied Biosystems, USA)의 GeneMapper version 3.7을 이용하여 분석하였다.
집단 간 계측형질을 이용하여 각 개체가 속하는 집단을 예측하고, 집단 간 차이 유무를 파악하기 위하여 SPSS 10.1 프로그램을 이용하여 정준판별분석을 실시하였다. 또한, 계수형질의 집단 간 차이 유무를 파악하기 위하여 SPSS 10.1 프로그램을 이용하여 Mann-Whitney U test를 실시하였다.
MtDNA control region 염기서열은 BioEdit version 7.0.0 (Hall, 1999)의 ClustalW (Thompson et al., 1994)를 이용하여 Full multiple alignment 하였다. 염기 서열 간 유전거리는 Mega 4 (Tamura et al., 2007)의 Pairwise distance를 Kimura-2-parameter모델(Kimura, 1980)로 계산하였다. 집단 유전학적 분석은 Arlequin 3.1 (Excoffier et al., 2005) 프로그램을 이용하여, Haplotype diversity (H)와 Nucleotide diversity (π)를 구하였고, 두 집단간 유전적 분화정도를 추정하기 위해 Pairwise
6개의 msDNA 마커를 이용하여 집단별 유전적 다양성을 파악하기 위하여 FSTAT version 2.9.3 (Goudet, 2001)과 GENEPOP 3.4 (Rousset and Raymond, 1995), Alequin 3.11 프로그램을 사용하여 대립유전자수(the number of allele per loci; A), 대립유전자 크기(product size range; S), 관찰치 이형접할률 (
경북 울진 연안에서 채집된 강도다리 27개체(전장 156.9-296.3 mm) 및 경북 포항에서 채집된 강도다리 27개체(전장 195.4-332.9 mm)의 형태 변이를 분석한 결과, 무안측의 흑화현상이 울진 집단의 전 개체에서 관찰되었으며, 특히 뒷지느러미 및 꼬리지느러미 기형 현상이 뚜렷하게 관찰되었다. 지느러미 기조의 기형 현상이 나타난 울진 집단의 척추골을 X-ray 조사 결과, 2개체에서 미추골 중앙부의 척추골 융합현상이 관찰되었다.
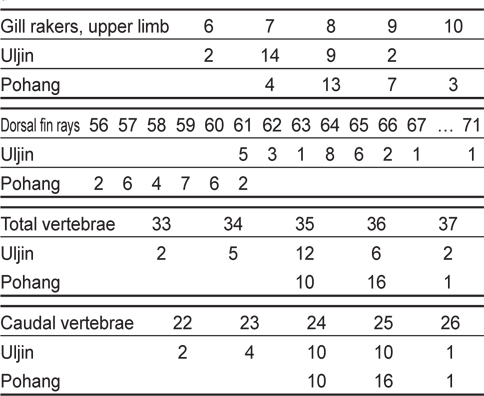
총 11개의 계수형질을 Mann-Whitney U test 결과, 7개의 계수형질(등지느러미 줄기수, 유안측 가슴지느러미 줄기수, 무안측 가슴지느러미 줄기수, 미추골, 척추골수, 첫번째 새파의 상엽과 하엽의 개수)에서 두 집단간 유의한 차이를 보였다(
[Table 1.] Comparison of counts between Uljin and Pohang populations of Platichthys stellatus

Comparison of counts between Uljin and Pohang populations of Platichthys stellatus
총 20개의 계측형질을 이용한 판별분석 결과, 두 집단은 통계적으로 유의한 평균 차이를 나타내었다(
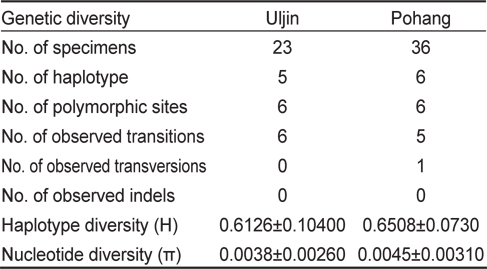
미토콘드리아 DNA (mtDNA) control region 375 base pair를 이용한 분자 분석 결과, 염기의 치환(substitution)은 12개였고, 결실(indel)은 없었다. 유전자형은 총 7개로, 이중 Hap 1이 두 집단에서 가장 많이 관찰되었고(포항 집단: 56% vs 울진 집단: 61%), 포항 집단에서는 총 6개의 유전자형(Hap1-6), 울진 집단에서는 총 5개의 유전자형(Hap1, Hap3-5, Hap7)이 관찰되었다. 총 7개의 유전자형 중 4개의 유전자형은 두 집단에서 모두 관찰되었으며, 2개의 유전자형(Hap2, Hap6)은 포항 집단에서만 관찰된 반면 1개의 유전자형(Hap7)은 울진 집단에서만 관찰되었다(Table 2). 이들 유전자형의 집단 내 유전거리는 울진 집단이 0-1.4%, 포항 집단이 0-1.1%였고, 두 집단 간에는 0-1.4%로 집단 내, 집단 간 유전적 차이는 없었다. 유전적 다양도(haplotype diversity, H)는 울진 집단과 포항 집단이 각각 0.61와 0.65로 유사하게 낮았으며, 염기 다양도(nucleotide diversity, π)는 울진 집단이 0.0038, 포항 집단이 0.0045로 역시 낮았다(Table 3). 두 집단간 유전적 차이 유무를 알 수 있는 F-통계량은 -0.00849로 매우 낮아 두 집단간 유의미한 차이는 없는것으로 확인되었다.
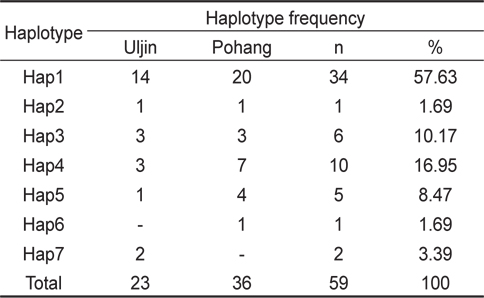
The haplotype frequencies for Uljin and Pohang populations of Platichthys stellatus based on mtDNA control region

Genetic diversity for Uljin and Pohang populations of Platichthys stellatus based on mtDNA control region
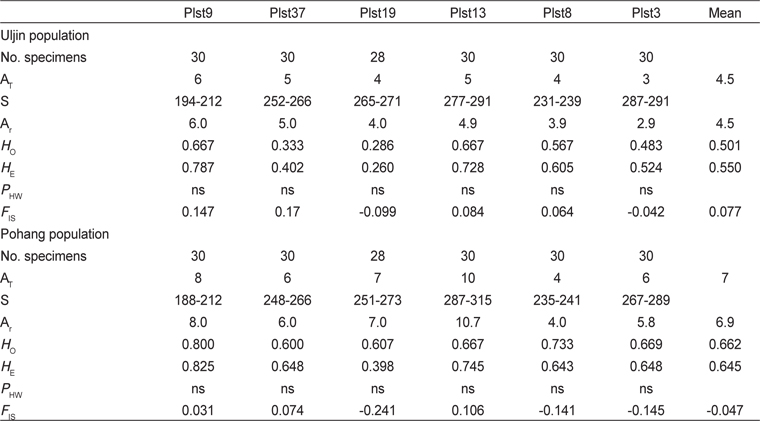
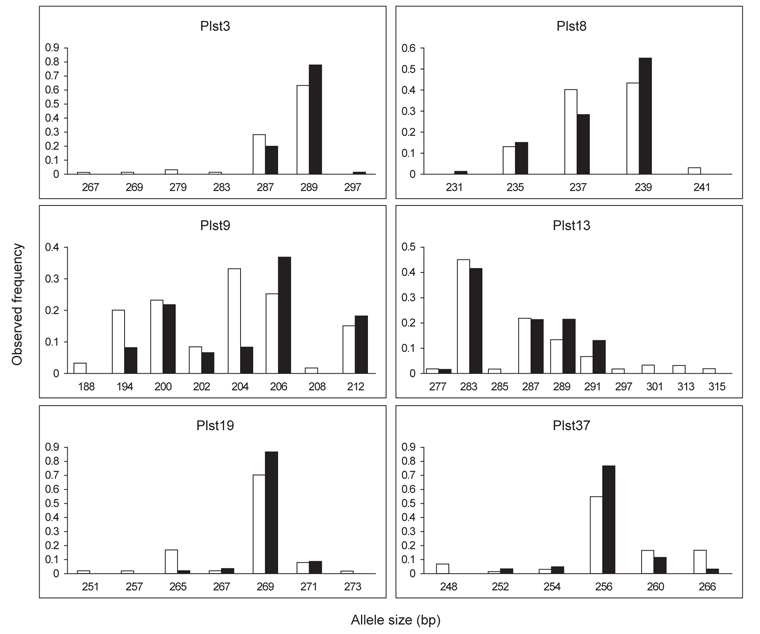
마이크로세틀라이트 DNA (msDNA) 마커 6개를 이용하여 유전자형을 분석한 결과, 대립유전자 크기는 188-315 base pair 범위에 있었다. 울진 집단과 포항 집단에서 총 37개의 다른 대립유전자가 관찰되었으며, 유전자좌당 평균 대립유전자수(AT)는 울진 집단이 4.5개이며, 포항 집단이 7개로 포항 집단이 높게 나타났다(Table 4). 주요 마커별 대립유전자의 특징을 살펴보면, Plst13은 사용된 6개의 마커 중 대립유전자 수가 10개로 가장 많았으며, 울진 집단에서 관찰되지 않은 대립유전자 수는 5개(285, 297, 301, 313, 315) 로 가장 많았다. Plst8은 대립유전자 수가 5개로 가장 적었으며, 포항 집단과 울진 집단에서 새롭게 관찰된 대립유전자 수는 각각 1개(포항 집단은 241, 울진 집단은 231)로 나타났다(Fig. 1).

Total number of alleles (AT), size in base pair of alleles (S), allelic richness (Ar), observed (Ho) and expected (HE) heterozygosities, probability of deviation from Hardy-Weinberg proportions (PHW) and inbreeding coefficient (FIS) for Uljin and Pohang populations of Platichthys stellatus based on 6 msDNA loci
유전자좌당 집단의 크기를 보정한 대립유전자수(AR)는 2.9개에서 10.7개 사이로, 울진 집단의 평균 AR (4.5개)은 포항 집단 의 평균 AR (6.9개)에 비해 낮았다. 울진 집단의 평균 관찰치 이형접합률(
경북 울진 연안에서 채집된 강도다리 27개체(전장 156.9-296.3 mm) 및 경북 포항에서 채집된 27개(전장 195.4-332.9 mm)의 형태 변이를 분석한 결과, 무안측의 흑화 현상이 울진 집단에서만 관찰되었다. 무안측의 흑화현상은 넙치의 인공종묘 생산시 흔히 나타나는 특징이다(Jeon and Jeong, 2008). 또한 돌연변이의 유무를 통해 방류집단과 야생집단이 구분되기도 하는데, Hamasaki et al. (2010)의 연구 결과에 의하면 일본산 참돔의 방류집단에서만 inter-nostril epidermis의 돌연변이(DIE)가 두드러지게 나타난다고 보고한 바 있다(Sobajima et al., 1986). 본 연구에서는 울진 집단의 전 개체에서 무안측의 흑화현상이 관찰되었고 꼬리지느러미 및 뒷지느러미에도 기형현상이 관찰된 점에서 울진 집단은 2006년부터 종묘 방류한 개체들이 성장하여 이번 조사에서 어획된 것으로 판단된다. 이러한 방류집단에서 관찰되는 특이한 형태 변이는 어린 시기에 물리, 화학적 환경, 먹이 등과 같은 인위적인 요인 때문으로 간주되고 있다(Parrish and Saville, 1965; Lindsey, 1988). 강도다리의 경우 울진 집단에서 그러한 형태적 변이가 잘 나타나는데, 특히 등지느러미 줄기수에서 두 집단간 명확히 구분되었다(Table 1). 또한, 계측형질에서는 2개의 형질(최대 뒷지느러미 줄기 길이, 유안측 가슴지느러미 줄기 길이)이 두 집단을 잘 구분해 주는 기여 형질로 확인되었다. 이와 유사하게 일본산 참돔 인공종묘 개체와 야생 집단을 판별 분석한 결과 3개의 기여 형질(체고, 안경, 위턱의 길이)이 두 집단을 잘 구분한다고 하였으며, 이렇게 얻어진 결과는 향후 종묘방류가 이루어진 후 재 포획시 집단을 식별하는데 유용한 형태 형질로 간주된다(Matsumiya and Kanamaru, 1987).
미토콘드리아DNA (mtDNA) control region 375 base pair를 분석한 결과 울진 집단과 포항 집단 간의
6개의 마이크로세틀라이트 DNA (msDNA) 마커를 이용한 강도다리 포항 집단과 울진 집단의 유전적 다양성 분석 결과, 울진 집단이 포항 집단보다 낮은 대립유전자 빈도를 나타내었다. 평균 대립유전자 수는 포항 집단이 7개, 울진 집단이 4.5개로 울진 집단이 포항 집단보다 대립유전자 수가 적었다. 이 결과는 우리나라 넙치 방류 집단의 대립유전자 감소율이 55.4% (Jeong et al., 2009), 일본산 넙치 방류 집단의 66.3% (Sekono et al., 2002)와 유사하다. 넙치의 경우 실내에서 사육된 소수의 친어가 지속적으로 방류개체를 생산함으로써 이러한 유전적 다양성의 감소가 빠르게 진행된 것이 아닌가 사료된다(Sekino et al., 2002; Hamasaki et al., 2010; Jeong et al., 2008). MtDNA 결과와 달리 MsDNA에서는 강도다리 두 집단 간
본 연구에서 강도다리 울진 집단과 포항 집단 간 형태적 차이가 확인되었으며, 이러한 형태적 차이는 mtDNA에서는 확인되지 않았지만 msDNA에서는 잘 나타났다. 강도다리 종묘방류가 경북 울진에서 4년이라는 짧은 기간에 걸쳐 이루어졌음에도 불구하고 이 지역에서 어획된 강도다리의 형태 및 msDNA 가 포항에서 어획된 강도다리 야생형과 차이를 보이는 점에서 시사하는 바가 크다. 즉, 방류 집단의 체형 개선, 유전적 다양성 유지를 위해 유전 다양성이 높은 친어 확보, 건강한 종묘생산 및 관리프로그램의 운영이 필요할 것이다.