The technological innovation is considered as an important factor and there is a positive externality in developing technology in the form of technology spillover. In this context, it is argued that government should play an active role in advancing technology development and several means have been introduced. This study attempts to analyze manufacturing firms’ evaluation for the performance of government assistance programs to their R&D activities. Considering that the performance evaluation takes the form of a count outcome, we apply several kinds of count data models. Some interesting findings emerge from the analysis. For example, we found that a firm’s sales amount, dummy for the firm’s having an R&D department, dummy for the firm’s being a venture one, and the number of the firm’s innovative activities have positive relationships with the degree that the firm evaluates government assistance as being useful.
Over the last two hundred years, neo-classical economics has recognized only two factors of production: labor and capital. The concept of technology was first introduced by Solow (1956). Since then, technological change and innovation has become one of the important topics in the study of economics, business, and entrepreneurship. At a lower level, innovation can be seen as a change in the thought process for doing something or the useful application of new inventions (McKeown, 2008). Following Schumpeter (1934), the literature typically distinguishes between inventions, which are ideas made manifest, and innovations, which are ideas applied successfully in practice. Innovation seems to play a central role in the knowledge-based economy, which is directly based on the production, distribution, and use of knowledge and information (Cowan and Paal, 2000).
We focus on technological innovation among several forms of innovation. Technological innovation is the generation of new or improved products or production processes (OECD, 1996). Its importance is emphasized in several aspects. It is considered as a key contributor to economic growth (Nelson and Winter, 1982; Freeman, 1994; Verspangen, 2005). As stated in Freeman and Soete (1997), it is an essential condition of economic progress and a critical element in the competitive struggle of enterprises and nations.
Technological innovation is also believed to be the key to fight the current economic downturn by helping businesses to grow and create jobs to counterbalance layoffs. For these reasons, enterprises and nations invest in technological innovation. However, it is often argued that technology is a public product similar to physical infrastructure and a clean environment. Many economists insist that there should be a positive externality in developing technology in the form of technology spillover. The private benefit of developing a technology is less than its public benefit, and the ‘market failure’ argument is applied in this case. A market economy invests insufficiently in the production of knowledge and innovation (Moon and Bretschneider, 1997). Consequently, it is argued that government should play an active role in advancing basic science and technology development and supporting the diffusion of innovation in various ways (Intarakumnerd and Virasa, 2004). Several means have been introduced such as the direct funding of research, technology transfer, and commercialization.
Although several studies have sought to deal with the econometric estimation of the government’s level of R&D spending, there are few studies about assessing the performance of government assistance programs. Therefore, by using the dataset of the 2008 Korean Innovation Survey (KIS 2008) in the manufacturing sector, we attempt to evaluate how well the programs of government assistance have worked. To this end, we model the evaluative data by applying the count-data model to reflect the characteristics of data appropriately. The results of this study are expected to be useful in enhancing the efficiency of assistance programs.
The remainder of the paper is organized as follows. Section 2 provides a literature review of studies that used data from the innovation survey (IS). Section 3 explains the data. Section 4 describes the estimation model employed in this study. Section 5 presents and discusses the results. Some concluding remarks are made in the final section.
Many studies, e.g., Archibugi and Piata (1996), Evangelista et al. (1997), Evangelista et al. (2001), Koschatzky et al. (2001), Quadros et al. (2001), Therrien and Mohnen (2003), Amara and Landry (2005), and Yoo and Moon (2008), focused on analyzing the technical innovation of a firm and used IS data to acquire information on the innovation of each firm and derive some implications thereof. In many countries, the IS is organized by government agencies, statistical offices, or academic institutions. It has been developed to acquire information on the innovative activities that are carried out in firms. It represents a direct measure of innovation and includes only those innovations that are considered to be technologically or economically significant.
Archibugi and Piata (1996) discussed the conceptual and methodological problems in measuring technology and noted that indicators derived from the IS are usable as measures of innovative activities. Evangelista et al. (1997) used data on manufacturing firms from the Italian IS and addressed the spread of innovation in the manufacturing industry, the nature of firms’ technological activities, and the outcome of innovation. Their study showed that the measurement of innovation through firm-based surveys provides relevant information for both researchers and policy-makers. Quadros et al. (2001) examined the innovative performance of São Paulo industrial firms by using the IS of Brazil and presented the major features about technological innovation in manufacturing industrial firms located in the state of São Paulo. There were some findings about foreign-controlled companies. Those firms exhibited higher rates of innovative performance and technological intensity than their national counterparts. Evangelista et al. (2001) used the Community Innovation Survey (CIS) to represent the innovation phenomenon at a regional level. The study showed that CIS data were effective in grasping the varied nature of innovative activities and their region-specific nature. Using empirical data from an industrial innovation survey carried out in the Republic of Slovenia, Koschatzky et al. (2001) analyzed the structural characteristics of the Slovenian manufacturing industry and its innovative behavior. A high share of Slovene manufacturing firms innovated, and the Slovenian industry showed a lack of co-operation, which is a typical pattern for all Central and Eastern European transition countries. Therrien and Mohnen (2003) investigated the comparability of the 1999 Canadian IS with the European CIS. They pointed out a number of differences and tried to assess their possible effect on the interpretation of the data. The studies undertaken so far are mostly about the descriptive statistics of ISs; other studies have used IS data and attempted econometric estimation.
Amara and Landry (2005) used the data of the 1999 Canadian IS to address the novelty of innovation in the manufacturing sector. The dependent variable was novelty of innovation, and a multinomial logit model was applied. By comparison with firms that introduce innovations that are novel only to them, firms that introduce innovations that are either world firsts or firsts in Canada are more likely to carry out R&D activities, use a larger variety of government support programs, and be involved in cooperative and collaborative arrangements with other firms. Alcaide-Marzal and Tortajada-Esparza (2007) investigated traditional innovation assessment process using IS and aimed to improve the general innovation assessment process, especially in those industries where technological innovation is not the most important contributor to competitiveness. They discussed the most common innovation indicators and proposed indicators. Similarly, Van Der Panne (2007) dealt with issues in measuring innovation and compared CIS and Literature-based Innovation Output (LBIO) data. Yoo and Moon (2008) used KIS 2002 and approximated the distribution function for the number of innovation activities by applying the mixture model. Aerts and Czarnitzki (2004) focused on the impact of R&D policies in Flanders by conducting treatment-effect analysis at the firm level to investigate the possible crowding-out effect of subsidy policies. Busom (2000), Wallstern (2000), and Lach (2002) also studied the effect of R&D subsidies.
Although many studies have used IS datasets and focused on government policies, they are somewhat different from this study. In contrast with previous studies, we concentrate on the dataset of KIS and model the performance evaluation of government assistance to manufacturing firms.
Owing to international demand, the OECD has tried to develop new science and technology (S&T) indicators. In collaboration with the OECD and Eurostat Secretariats, the OECD group of National Experts on Science and Technology Indicators (NESTI) prepared the Oslo manual in 1992 and revised it in 1996 (OECD, 1996). The manual is designed to serve as a guide for data collection on technological innovation. Many countries undertake a survey under the guidelines of the manual, and Korea is no exception. The Korean survey has been undertaken since 1995 by the Science and Technology Policy Institute (STEPI). The dataset is called KIS, which is to collect data about innovation activity at the firm level.
In this study, we have used the KIS 2008 database. It is the latest and gathers information about the levels and characteristics of innovation activities between 2005 and 2007. The survey covered 3,081 manufacturing firms; after excluding missing data, we used the data for 2,890 firms. The survey questionnaire includes eleven categories of survey parameters, such as: a) general information about the firm, b) innovative performance of the firm, c) information about product innovation, d) information about process innovation, e) information about organizational innovation, f) information about marketing innovation, g) innovation cost, h) obstacles to innovation, i) assessment of institutional/governmental support for innovative activities, j) information about patents, and k) foreign policy.
In this paper, we investigate the determinants of the degree of usefulness of government support programs. KIS 2008 asked each firm a question as to whether the firm was using government support programs. There were eight kinds of government support program, and each firm answered for each government program. The firm answered zero if it did not use the government program; otherwise, it ranked the importance and usefulness with an integer from one to five if it used the government program. As there were eight government programs, the sum of the responses ranged from zero to forty. The frequency distribution of the degree of usefulness associated with government support programs is presented in Table 1. About 75.5% of the firms in the sample did not use any government support program. This information shows the existence of excessive null responses.
[Table 1] The distribution of the degree of utilization of government assistance programs
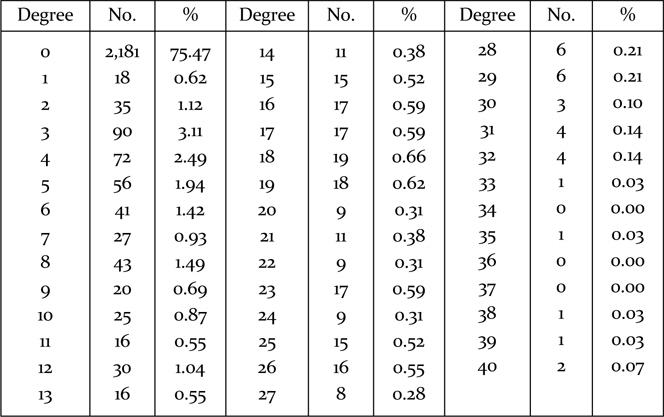
The distribution of the degree of utilization of government assistance programs
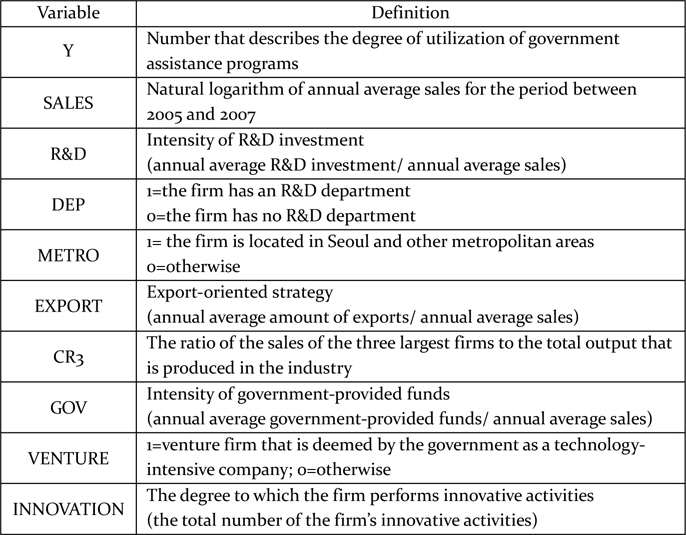
Table 2 summarizes the definitions of the variables that are used as covariates in this study. As only a few studies have analyzed the determinants of the government support system, we explored a wide range of studies that dealt with technological innovation. The grounds for selecting each covariate were as follows.
[Table 2] Definitions of the variables

Definitions of the variables
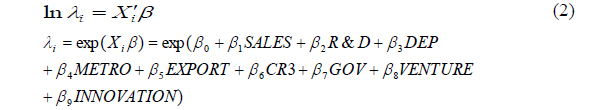
SALES: The size of the firm is the most widely examined variable in the relevant literature. Supporting arguments exist for both large and small sizes. Generally, large firms have the advantage of exploiting new technology in terms of production, marketing, financing, and R&D activity (Schumpeter, 1942). On the other hand, some studies have not been able to show the positive influence of size (Horowitz, 1962; Scherer and Ross, 1990; Gravs and Langowitz, 1993). In order to investigate the effect of firm size on the degree of efficient utilization of government supporting programs, we used the average annual sales as a proxy of firm size, instead of possible alternatives, such as the number of employees or volume of assets. We employed only one variable, the average annual sales, to avoid multicollinearity.
R&D: This means the intensity of R&D investment. This variable has been investigated for models associated with innovative activity to reflect the ability and willingness of firms to innovate new technology. Sun and Du (2010) used the intensity of R&D investment to examine the determinants of industrial innovation in China. In this study, we used the average annual R&D expenditure, which is normalized by the firm’s average annual sales.
DEP.: This is a dummy variable, which is 1 if the firm has a department of R&D. It is another firm-level characteristic that traditionally has been investigated regarding models of technology. The main reason to include this variable was that it provides a measure to reflect the firm’s ability to assimilate and process new technological information at minimum cost (Cohen and Levinthal, 1989).
METRO: This variable indicates the location of the firm. The idea of paying attention to the specific locations of firms with respect to innovation emanated from the findings of previous studies in which firms’ innovation was seen to be location-specific (Shefer and Frenkel, 2005). Several studies considered the location variable in the course of estimation (Davelaar and Nijkamp, 1989; Davelaar, 1991; Ciccone and Hall, 1996; Audretsch, 1998; Shefer and Frenkel, 1998). In our study, the location variable is included as a dummy variable, which is 1 if the firm is located in Seoul, Incheon, and other metropolitan areas (and 0 otherwise).
EXPORT: This variable implies the firm’s export-oriented strategy. The link between innovation activities and exports has received a great deal of attention from scholars. Roper and Love (2002) were interested in the relationship between innovation and export performance, and Pla-Barber and Alegre (2007) also tried to understand the link between innovation and export-intensity.
CR3: CR means the Concentration Ratio. This is a covariate that is related to the industry sector to which the firm belongs. It provides an indication of the oligopolistic nature of the industry and reflects the degree of competition. We used Concentration Ratio 3 (CR3), which measures the ratio of the sales of the three largest firms to the total output that is produced by the industry.
GOV.: This variable implies the intensity of government-provided funds. We used the average annual amount of government-provided funds, which is normalized by the firm’s average annual sales.
VENTURE: The variable is 1 if the firm is a venture firm that is deemed by the government as a technology-intensive company.
INNOVATION: This variable represents the degree to which the firm undertakes innovative activities. There are five types of innovative activity, and each firm is asked if it undertakes each type of innovative activity. INNOVATION is the total number of the firm’s innovative activities and ranges from zero to five.
The following subsections present several count data models. One can refer to Cameron and Trivedi (1998) for a variety of count data models and the method of estimating them.
The usual way to deal with the discrete nature of the data is to consider a Poisson regression model, where the degree of usefulness
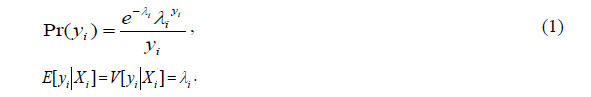
In the above,
An important property of the Poisson distribution is the equality between its first two conditional moments. However, in many empirical cases, it is common to find over-dispersion (or under-dispersion) where the variance exceeds (is less than) the mean. This in turn implies the violation of this property of the Poisson distribution. The reasons for the violation of this Poisson assumption are unobserved heterogeneity and a high frequency of zeros in the data (Cameron and Trivedi, 1998). At first, in order to take into account unobserved heterogeneity, we considered the negative binomial model.
The negative binomial model obtains the unobserved heterogeneity by incorporating an unobserved specific effect
Suppose the distribution of a random count

Suppose the parameter

where
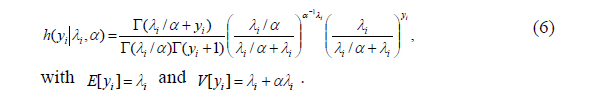
The marginal distribution of
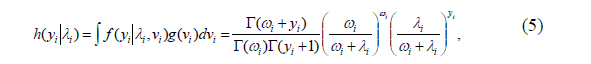
where the parameter
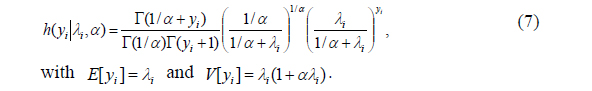
The marginal distribution is the negative binomial (NB) with the first two moments:

The NB2 model is obtained by setting

Since
A preliminary analysis of the raw data used in this study revealed a high proportion of zeros. This information suggests that our sample is characterized by excessive zeros. Zero-inflated models provide an alternative way of handling data with such excessive zeros. Since their formal introduction by Lambert (1992), who expanded the work of Johnson and Kotz (1969), these models have been widely applied as in the fields of motor vehicle crashes (Lee et al., 2002; Lord et al., 2005), insurance (Yip and Yau, 2005), and technology adoption (Romeo, 1975; Faria et al., 2003) and manufacturing (Lambert, 1992).
Zero-inflated models are characterized by a dual-state process (or regime split mechanism), where the observed count can be located in either a perfect state or an imperfect state (Lord et al., 2005). These two states are explained thus: one is a normal count process state and the other is a zero count state. An observed zero could arise from two different sources. One is a group of firms that did not use the government assistance programs only during the above periods, while the other relates to firms that have not yet availed these programs. The observed zeros under this imperfect state in the dual-state process result in excess zeros, which cannot be explained by either a Poisson or a negative binomial process.
The zero-inflated regression model assumes that with probability
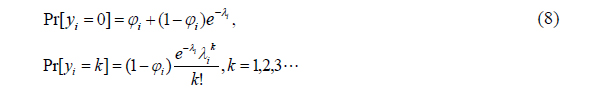
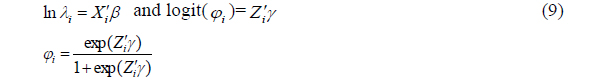
where ln
Zero-inflated models can be extended to accommodate covariates in a regression setting. The estimation of the proportion of zeros and parameters can be divided into two parts.
Lambert (1992) introduced the ZIP1 model in which

This specification works best if the correlation between the
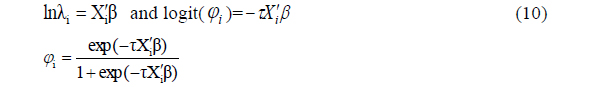
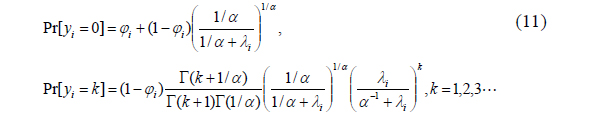
For an unknown, real-valued shape parameter
Similarly, zero inflated negative binomial (ZINB) model can be specified. That is,
When the models are nested, the LR test under
The dependent variable of this study takes the form of the count variable. Although the linear regression model often has been applied to count outcomes, this can result in inefficient, inconsistent, and biased estimates (Long and Freese, 2006). To reflect the characteristics of the dependent variable, we used models specifically designed for count outcomes.
There are several count models according to the distribution and assumptions. The results from various count-data models are presented in Tables 3-8. The estimations were made by the use of TSP 5.1, a package for statistical analysis
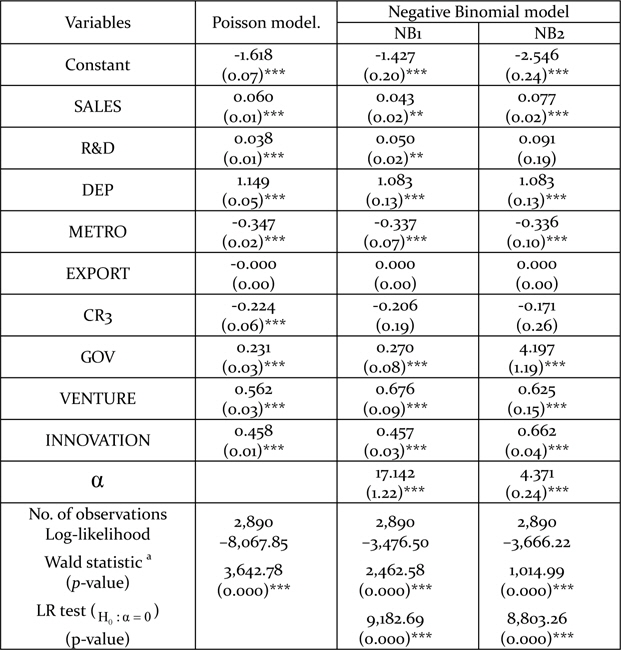
The results from the Poisson regression are summarized in Table 3. All covariates except EXPORT are statistically significant at the 1% level in the Poisson model. SALES, R&D, DEP, GOV, VENTURE, and INNOVATION show significantly positive relations with the degree of utilizing government assistance programs, while METRO and CR3 show significantly negative relations. However, these estimates fail to consider over-dispersion as the Poisson model assumes equality between the mean and the variance. The variance-mean ratio of our estimation is 14.58. In order to dispense with the assumption, the NB model is adopted.

Estimation results
There are two kinds of NB model according to the type of variance function. The results from the NB regressions are described in Table 4. SALES, R&D, DEP, METRO, GOV, VENTURE, and INNOVATION are statistically significant variables at either the 1% or the 5% level. As the Poisson model is nested in the NB models, the NB models reduce to the Poisson model if the over-dispersion parameter
Estimated results
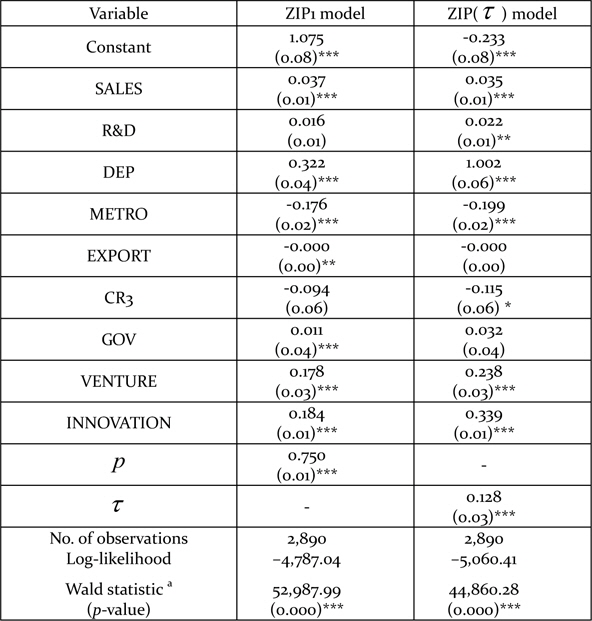
Although the null hypothesis is rejected against a specified alternative, this does not mean that the alternative is correct. The mis-specification problem of the Poisson model often is considered to exist because of unobserved heterogeneity and the occurrence of more zero observations than expected (Gschlößl and Czado, 2008). Therefore, we also considered the model with excess zeros. Tables 5, 6, and 7 summarize the results of three different types of ZIP regression model. The statistical significance (or lack thereof) of the covariates is slightly different across the models. However, covariates such as SALES, DEP, METRO, VENTURE, and INNOVATION are consistently significant at the 1% level.
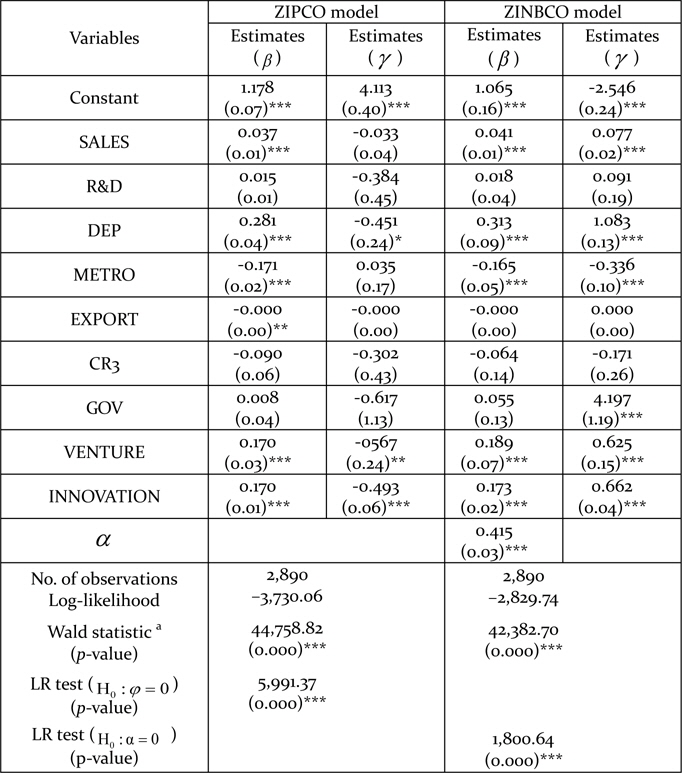
Estimation results
The coefficient of SALES has a positive sign in all the three different kinds of ZIP model. This indicates that larger manufacturing firms tend to make better use of government assistance programs. According to the Schumpeterian assumption, larger firms tend to be more active in R&D expenditure and have an advantage in developing innovations. The propensity to use government assistance programs is linked to those trends. The coefficient of DEP also is positive in the ZIP models. This means that firms with an R&D department are more enthusiastic in using government assistance programs than firms without such a department. The result can be understood intuitively. The fact that a firm has its own department of R&D indicates that it is interested in innovation and attempts to develop technology. It is natural that such firms make good use of assistance programs.
METRO is significant with a negative sign. This implies that firms located in Seoul and other metropolitan areas tend to use government assistance programs less than others. As other innovation-related facilities such as research institutes, capital, and labor forces are clustered in Seoul or areas near Seoul, those firms located in Seoul and metropolitan areas have many other programs to use besides those offered by the government. This may decrease the degree of use of government assistance programs.
VENTURE and INNOVATION show positive signs that are statistically significant. A firm that is classified as a technology-intensive company by government or performs many kinds of innovative activity shows a high level of use of government assistance programs. These results are not different from what we anticipated.
Since the Poisson model is nested in the zero-inflated models, the zeroinflated models reduce to the Poisson model if the parameter
In a knowledge-based economy, technological innovation has become one of the important issues and plays a central role in industry. Most forms of innovation are market-driven with firms and users as their main drivers. However, some economists point out the possibility of market failure because of technology spillover. Firms may under-invest in innovation activities as they are unable to find the right knowledge or skilled people or cannot realize the full benefit of these investments. In these circumstances, public intervention is justified in order to improve the efficiency of markets and overcome practical barriers for innovation. As the types of government assistance programs have evolved, the performance of those programs has been our current focus.
In this paper, we tried to analyze government assistance programs on the basis that firms with specific characteristics make better use of them. We used the KIS 2008 database, which is associated with manufacturing firms in Korea. Considering that the dependent variable takes the form of a count outcome, we applied count-data models. This paper presented seven kinds of count-data model, Poisson, NB1, NB2, ZIP1, ZIP (
Some of the important findings and contributions of this empirical estimation are as follows. The covariates such as SALES, DEP, METRO, VENTURE, and INNOVATION are consistently significant at the 1% level of statistical significance across all kinds of model. The estimated coefficients of SALES, DEP, VENTURE and INNOVATION have positive signs. This implies that large firms tend to make better use of assistance programs than others in the Korean manufacturing industry. Manufacturing firms with an R&D department tend to evaluate government assistance programs as being useful. Firms that are classified as venture firms or perform innovative activities exhibit the same trend. The firms located in Seoul or metropolitan areas use less of assistance programs. These findings can be important evidence that provides guidelines to manufacturing firms and government officials. From the results derived from this study, we are able to find some significant factors that enhance the performance of assistance programs. S&T policy-makers can refer to those factors and increase the effectiveness and efficiency of policies. For example, they can design a policy that is specialized for firms with high sales, an R&D department, and innovative actions and maximize the effect of the policy.
Regarding methodological issues, this study dealt with the problem of over-dispersion and excess zeros. There is no instance where the performance of government assistance programs in relation to Korean manufacturing firms is estimated through the use of count-data models. In addition, the application of advanced count-data models such as ZIP and ZINB models to the dataset of Korea manufacturing firms is the first trial.