In most economies, the free market is regarded as the best system for allocating innovation resources. Any government action would distort natural market operations (Bremmer, 2010), and private enterprises are the main actors in an innovation system. The government works only in areas where the market has failed. The most developed country, the US, either does not trust the government or understates the role of the government in industry.
But several economists hold that the visible hand, that is, the nation or state can play a very important role in the country's competitiveness (List, 1928). This principle has been adapted in developing or catch-up countries, where champion companies are picked as the main actor to finish the national responsibility. The rise of Japan, Korea, Singapore and Taiwan, more or less, were all closely related to the interference of government in industry (Freeman, 1987; Okimoto, 1989).
In recent years, there has been a trend to see the science and technology (S&T) and innovation policy from the demand side, and public procurement policy thus has been revitalised. The trend can be seen from the European Barcelona Target for R&D/GDP to reach 3% (European Commission, 2003) and the Aho Report (European Commission, 2006). Ahrens (2010) proposed that government procurement can contribute to innovation by focusing on market signaling, de-risking R&D, bridging the finance gap, and stimulating demand.
China is a unique country with a legacy of planned economy. The global financial crisis gave the Chinese government a reason to take a more aggressive role in supporting innovation. The national strategy of indigenous innovation was developed in 2006 as a result of the “National Programming 2006–2020 for the Development of Science and Technology in the Medium and Long Term” in 2006. The goal of the new national program is to make China an innovative country by implementing an indigenous innovation strategy. Following this strategy, China has been continuously increasing R&D expenditure even in periods of financial crisis. In 2010, R&D/GDP reached the highest level in China by 1.76%, while it was only 0.6% in 1996. During the same period, some developed countries stagnated or cut their R&D and education investment following the financial crises. China is regarded as the next science and technology or innovation superpower in many papers and reports (for example, Chesbrough, 2010; Sigurdson et al., 2005).
China is a mixed economy with the market as a basic force and the government as a supporting agency to lead innovation. The reasons for such strong government support are two: Chinese companies are weak in innovation capability in an open economy and the government has the power to mobilize nation-wide resources to develop key technology. Some even argue that it is necessary to use a nation-planned system (juguotizhi) to develop next generation technology in China (Mei, 2009), that is to let the state have overwhelming power to implement innovation. So, there is a tendency to go back to using a planned economic system as the basic institution for innovation in China after the national strategy of indigenous innovation.
The direct action of innovation policy in China is to use national S&T programs to push government research institutes, universities and state-owned enterprises (SOE) or private companies to innovate, the latest area being mega projects. The indirect actions are tax subsidies and policies to induce companies to innovate. But the inputs and outputs of innovation at the business level are the result of multiple factors. So, it is not easy to evaluate the real effects of government policy from other factors. Since this ambitious program has been going on for five years, it would be interesting to monitor its progress from an academic perspective.
There are several papers on national innovation systems (Nelson 1993) and reports on China’s innovation system and innovation policy (Liu and White 2000; Lundvall et al. 2006; Motohashi et al. 2007; OECD 2008). For example, OECD has just published a review of Chinese innovation policy; it suggests that China needs more bottom-up decision making, giving private sectors a more important role and ensuring greater co-ordination among agencies to promote innovation (OECD 2008).
This paper will try to answer the following questions: Can the national strategy of indigenous innovation work in an effective way to enhance enterprises’ capability of innovation? In particular, do SOEs or private enterprises benefit more from the new national strategy? Is a national innovation system with a strong government more efficient than one with a market-driven innovation system?
The paper has five sections. After this introduction, section two gives the background on indigenous innovation. In the third section, we will evaluate the implementation of the policy since 2006 in China. The fourth section presents the discussion and conclusion.
II. Background of Indigenous Innovation
Since the mid1990s, China began its rapid open process, after Dong Xiaoping’s southern tour. The purpose of the opening is twofold: economic growth and technology transfer, as Chins lagged behind developed country.
But the policy for indigenous innovation is result of economic challenge for China to become a competitive country.
First, driven by their cost advantage, Chinese companies made products for the world, but got a limited profit margin. At the same time, they are poor in innovation performance and have to pay high royalties as IPR to multinationals. Chinese companies have been granted a limited number of patents in the US. In 2010, only 3,303 patents were granted to China, whereas Korea had 12,508 patents (Table 1). Hence, innovations from domestic knowledge bases and intellectual property rights are badly needed in China.
[Table 1] Patents granted in the US
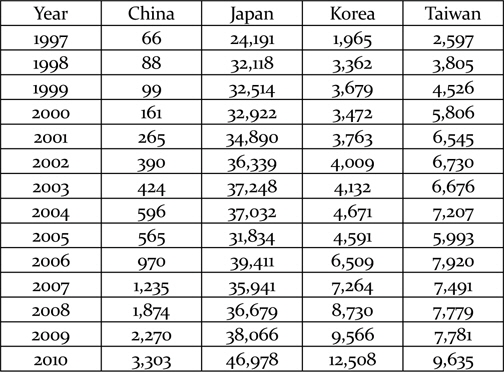
Patents granted in the US
Second, the high growth rate of the Chinese economy during the past 30 years will not be sustainable without a change in the development strategy. China needs, for example, more energy-efficient and environment-friendly technologies, new management skills and new organizational practices to ensure sustainable growth in the near future.
Third, FDI into China has grown rapidly since then and has become more capital intensive and technically sophisticated. Also the sources of FDI have also diversified to include the US, EU countries, Japan, and South Korea, as well as Taiwan and Hong Kong. And now, multinational’s affiliates in China have become the key elements in the Chinese innovation system. They contributed about one third of Chinese economy in terms of employment (Table 2).
[Table 2] FDI firms in the manufacturing sector (%)
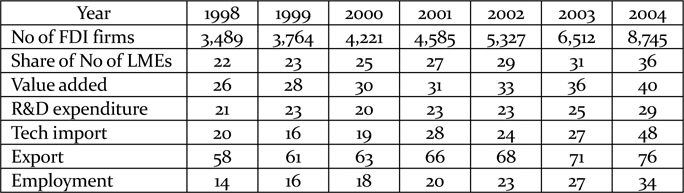
FDI firms in the manufacturing sector (%)
China’s promotion of FDI has pulled China from near total isolation to become the largest global exporter by 2009 that is firmly coupled itself with global production networks. By 2013, China becomes the number one exporter on top of USA.
For FDI, China’s explicit policy is “market for technology.” The basic idea of the policy is to get more technology in the opening process when multinationals got more and more market share. For example, we have some specific policy that attracts multinational corporations to establish R&D centers in China. The idea was to entice high tech foreign enterprises to transfer advanced technology to China by allowing them to sell a portion of their products to the Chinese market. The reason is that Chinese companies are too weak to compete with multinationals in an earlier time, therefore FDI was only allowed for exports and the preferred arrangement was to establish joint ventures between large SOEs and foreign enterprises in order to produce in China and thereby replace direct imports.
It was reasoned that from joint ventures, Chinese partners could learn technology from foreign partners. To make the deal more attractive, the joint ventures were given preferential tax rates and privileged market access. For example, the joint venture between Shanghai Auto and Volkswagen, for example, was allowed to monopolize the Chinese passenger car market between 1985 and 2000.
Fully-owned foreign enterprises were only allowed until mid1990s, and proportions of domestic sales were also limited. The Chinese government also made preferential industrial policies to attract investment into specific technology from large multinational corporations (MNCs) on large-scale energy, transportation, raw material and infrastructure projects. Particular favorable conditions were granted to high-tech foreign firms (Xia and Zhao, 2012).
As a result, the market share of foreign companies in China grew rapidly in the 1990s, even becoming dominant in some industries. Yet the technological transfers under “market for technology” were mixed: some industries are good and others are disappointing. In the IT sector, many emerging multinationals from China became leading companies in the world, such as Huawei in telecommunication and Lenovo in computers but the failures were especially evident in the auto industry. The automobile joint ventures based their technology entirely on that of the foreign partners, and the Chinese partners were responsible solely for securing market access. The huge profits limited the motivation and competence of the China partners to learn technology. The market monopoly meant that foreign companies were not compelled to continue upgrading technology. Given the assured market monopoly and internal technical incompetence, the Chinese side ended up as perpetually passive players. In contrast, a number of new auto companies such as Chery, Geely and BYD – started with far fewer resources, no protected market, and no designated foreign partners, but managed to make faster technological progress than the state-owned joint ventures because they had the autonomy and drive to learn and acquire technology tailored to their own commercial needs (Lu and Feng, 2004).
The above concerns pushed the Chinese government to strengthen indigenous innovation. The strategy sends a strong message that the government should bounce back to lead the innovation process in China and not trust that FDI can automatically give the Chinese industry technological progress as expected.
The specific goals are to increase R&D expenditure per GDP to a level of 2% in 2010 and 2.5 % by 2020; to make S&T and innovation the most important enabling factor for GDP growth, contributing about 60% of GDP growth; to decrease the dependence on foreign technology to less than 30% (the ratio of expenditure from technology import to R&D expenditure was estimated at 56% in 2004); and, finally, to be among the top five worldwide in terms of the number of domestic invention patents granted, and in the number of international citations of scientific papers (State Council of China, 2006).
There are generally five types of policy instruments for innovation: government R&D inputs, public procurement, intellectual property rights and standard setting, megaprojects, tax incentives for R&D.
R&D expenditure is a general policy for innovation after the indigenous innovation policy. It means that government will give more funding support to the university and government institutes for R&D.
Standard setting as policy: Standard setting and IPR as new policy tools promote innovation. In fact, it was the indigenous innovation strategy that saved TD-SCDMA, the 3G standard for telecommunication, from the uncertain conditions.
Megaproject: The Chinese government selected 16 mega S&T projects for promoting the goal of national innovation. These projects are expected to help China master the core technology of strategic industries. It includes the general CPU, large airplanes, new broad wireless mobile telecommunications, nuclear stations, new drugs and moon landing. Here, leading SOEs have been given the main responsibility for the mega projects (Lu et al., 2012).
New tax policy: Tax policy makes R&D expenditure 150% tax deductible, thus effectively constituting a net subsidy, as well as accelerating the depreciation for R&D equipment worth up to US$ 40,000.
Public procurement: the new policy has given public procurement of technology an important way to promote indigenous innovation in China. This policy is the result of learning from the best practices in the US and Korea. Public procurement in China today is significant, but the policy tool itself is relatively new to China. The original purpose of the practice of public procurement was to cut costs rather than promote indigenous innovation. Under the new policy, government agencies have to prioritize innovative Chinese companies by procuring their goods or services even if these are not as good or cheap as those of other companies (both Chinese and abroad). In this new policy, the government sets priority for indigenous innovative products in public procurement (State Council of China, 2006).
Looking back on the system of indigenous innovation policy reflects a turning point for policy making in China or for innovation systems in China. First, the policy packages have more ideas that are demand-driven. Second, it intends to push innovation in a more systematic way, from R&D to product manufacturing, formation of supply chains and early market incubation. Third, the innovation policy has been upgraded to an economic policy that is higher than the traditional S&T policy. Fourth, the government uses indigenous innovation to balance domestic demand and export orientation, domestic innovation capability and the acquisition of external technology. Finally, the government once again picked up SOEs to be the champions of innovation.
III. Evaluation of Indigenous Innovation Policy
1. National R&D Expenditure against Imports
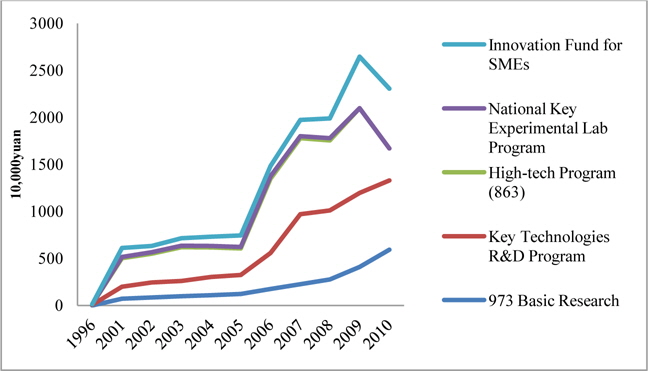
In actuality, the Chinese state had already started to increase funding for government research institutes (GRIs) and universities as early as the mid-1990s, reversing the marketization trend of the 1980s. This shift partly reflected China’s high rate of growth in the 1990s – which increased the government’s budget – but was also influenced by the dot.com boom and the growing prominence of the knowledge economy in the West. The thinking went if the Western countries moved to a model of knowledge economy, China ought to prepare to do so by investing in knowledge-intensive institutions. However, the increased state commitment did not become obvious until after 2000. Figure 1 shows the two-stage funding increase into the main S&T programs controlled by the Ministry of Science and Technology (MOST). The first increase happened in 2001; the second and more substantial jump occurred after 2006, the year China formulated its “indigenous innovation” policy as the new national platform. The decline of the share of the 863 Hi-tech Programs after 2009China’s previous prestige S&T program and small and medium size enterprises program (SME) only indicates the proliferation of new R&D programs, as discussed below.
The indigenous innovation policy signals a return of the Chinese state to the center of the nation’s S&T endeavor to address the perceived gap in financing long-term and risky R&D projects by commercial enterprises. This is most evident in how highly significant national projects are organized. China identifies 16 mega-projects in microchip, broadband, alternative and nuclear energy, aerospace, disease control and health, and fuel vehicle development.
There are striking similarities between the organizational form of these mega projects and Mao era strategic weapon programs. First, all of the recent projects were administrated through a top-down system. The Chinese State Council, headed by then Premier Wen Jiabao, coordinates and guides them. MOST, National Development and Reform Committee (NDRC), and Ministry of Finance form the core leadership group, and relevant industrial ministries are in charge of the projects relevant to them; for example, the Ministry of Health in a pharmaceutical mega-project (Lu et al,2012).
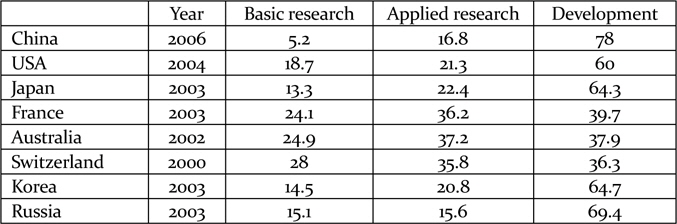
But the actual results show that China is more worried about industrial development in a short period, rather than a long version of development. The indicators are weak in basic research compared to other catching up or developed countries (Table 3 and 4).
[Table 3] Breakdown of R&D by Country (%)

Breakdown of R&D by Country (%)
[Table 4] Breakdown of R&D expenditure (%)
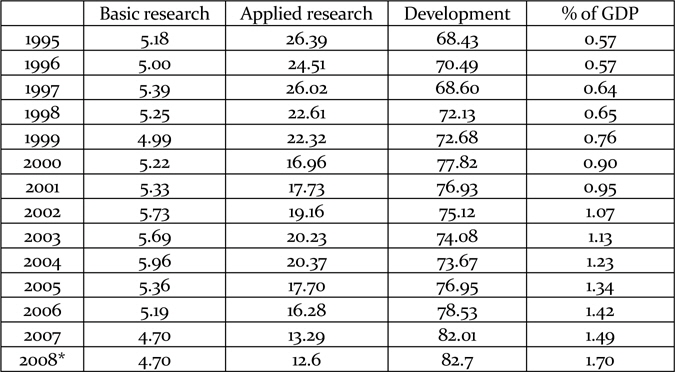
Breakdown of R&D expenditure (%)
Another long-term problem of state-led development is that the Chinese state has yet to find effective ways to diffuse and transfer technology to the wider society. In the 1980s and 1990s, there had been significant technological diffusion from GRIs to the commercial sectors; the typical case is Lenovo, a company spinning off from Chinese Academy of Sciences. Yet, this had happened during a time of great distresses for GRIs. Once GRIs become well-funded by the state, the incentives of technological diffusion to the commercial sectors weakened. In addition, many commercial corporations established their own in-house R&D centers and research institute spin-offs were no longer institutionally encouraged for their musky blends of public and private financial mechanisms.
2. Indigenous Innovation in Industry: R&D or Import
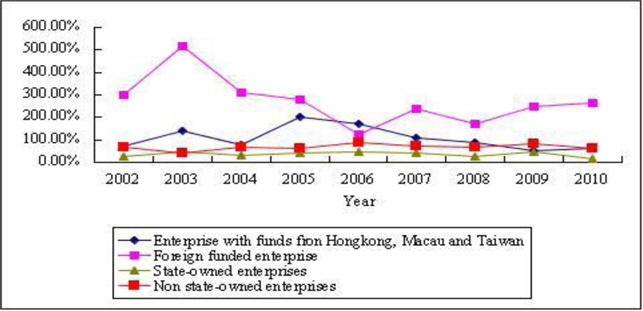
At the same time, the business sector has also changed their motivation for innovation. They usually spend more money on technology import rather than their own R&D. Even on assimilation, up until now, Chinese companies have focused mostly on importing existing technology and products, with far less effort devoted to assimilation and improvement of technology processes. Figure 2 shows the ratio of spending on assimilation vs. importation based on Chinese government statistics. In 2002, barely 0.1 Yuan was spent assimilating technology for every Yuan spent in purchasing from abroad. The ratio has gone up since then, but expenditure on assimilation still remains below 0.5 Yuan of every Yuan spent on importation.
From Figure 2, we can see that different kinds of enterprises have different ratios of expenditure on technological assimilation. The ratio of foreign-funded enterprises (2.64:1) is higher than that of domestic enterprises; non-state-owned enterprises (0.62:1) is higher than state-owned enterprises (0.15:1) which is the lowest. This average ratio of state-owned enterprises has been stable in recent years, suggesting considerable inertia to increase assimilation spending.
SOEs include state-ownership holding enterprises, state joint ownership enterprises, and solely state funded corporations. The reason for such inertia has to do with the preferential state funding allocation for them to purchase advanced technology from abroad and limited market competition, which makes less motivation to assimilate technology. The remaining domestic enterprises include joint-stock companies, private enterprises, etc. The lack of investment in assimilation is another sign of the relatively weak internal R&D capacity of Chinese firms, especially the SOEs.
3. Standard Setting and Consortia
As a part of the promotion of indigenous innovation, China also started to develop an IPR promotion strategy for Chinese enterprises. China’s patent system was established in 1985, but it did not receive much attention until after MLP was issued in 2006. Here we will briefly discuss China’s involvement in establishing a wireless communication standard as an example of the strategic considerations of the state. China used to be an eager adopter of prevailing international technical standards.
But in the early 2000s Chinese policymakers realized the interlocked nature of industrial standards and IPR; this led the government to push for China’s own technical standards as a way to enable innovation in the Chinese communications technology industry while increasing Chinese bargaining power over the determination of royalties that must be paid to foreign IPR holders. The best and most documented case is China’s 3G wireless standard TD-SCDMA (Suttmeier et al, 2006, Zhou 2006, Breznitz and Murphree 2011, Ernst 2011).
In May of 2000, the International Telecommunication Union (ITU) certified TD-SCDMA –proposed by an SOE called DaTang Telecom Technology – as one of the 3G mobile communications standards. This was seen as a milestone for China. At that time, TD-SCDMA was an infant technology compared to WCDMA in Europe and CDMA2000 in the U.S. The fact that DaTang has created TD-SCDMA suggests that in fact Chinese GRIs have never completely stopped to develop indigenous technology. But the most significant step in this case is that the government decided to support this standard to be a national one based on the reasoning that since China has already become the largest cell phone market, this indigenous standard could boost the indigenous innovation in the entire industrial chain. Several key governmental agents – MOST, MII and NRDC – were on board. Before 2006, the Chinese government also created a research consortium, or TD-SCDMA alliance, to develop the industrial chain based on the standard.
The young TD-SCDMA faced many technical uncertainties and setbacks, and even Chinese domestic equipment makers and operators were reluctant to commit to this technology. Worried that TD would prove to be uncompetitive against two existing, mature standards, the Chinese government delayed 3G licenses for many years to allow TD-SCDMA more time to mature. Even though commercial 3G networks appeared in advanced countries as early as 2001, China did not issue 3G licenses until the end of 2008, after the landmark Beijing Olympics. The government also designated China Mobile, the largest mobile phone carrier in the world, to be the 3G carrier for TD, in order to ensure the standard would have a favorable market position (Liu, 2008). This visible, aggressive support from the Chinese government eventually secured commitment to the standard from a host of foreign and domestic equipment makers (such as DaTang and Siemens), chip designers (DaTang, T3G Technology, Spreadtrum, and Mediatek), testing and instrument companies (Zhongyou, ZCTT), mobile phone handset makers (DaTang, Soutec, and Do pod) and operators (China Mobile).
The lessons on innovation in this case study are mixed. On the one hand, the forced promotion of TD delayed China’s 3G development. As a result, China Mobile experienced a slower transition to 3G. Even as of 2012, share of 3G users amongst China Mobile customers is significantly lower than the shares of much smaller Chinese competitors who adopted international standards (Trefis, 2013). As it turns out, the wireless industry’s value chain is long and complex and the governmental supported standard would not be successful without the support of all players in the whole process of technology development. Given that transnational corporations (TNCs) control the core cell phone technology, their willingness to participate was necessary. The length of the TD’s maturation process meant that there had been considerable uncertainty, which discouraged domestic and foreign companies from investing in the equipment and further slowed the growth of the TD network (Breznitz and Murphree, 2011, p 74). On the other hand, China finally was able to implement an indigenously developed and internationally recognized technology standard in the industry. Since TD involves different technology architecture from CDMA and WCDMA, the experience and expertise gained, by various Chinese firms, from initiating and managing the complex industrial eco-system surrounding TD cannot be underestimated. Several Chinese chip designers – such as Spreadtrum, among the top five cell phone chipmakers in the world in 2012 – would not have survived had there not been an indigenous platform upon which they had advantages over existing international rivals.
While TDS-CDMA is only established as a national standard, China Mobile and other major telecommunication equipment and chip-makers are now well positioned to implement the 4G LTE standard, which is poised to become one of the two major international standards by 2013. The dominant market position of China Mobile in China’s cell phone market (70% with 700 million users) means that companies such as Apple would seek out the agreement to be compatible with the technological standard, (Chen and Pfanner, 2013).
This is quite a contrast with the experience of Japan. While Japan implemented 3G earlier than other countries, its telecommunication sector was decoupled from the global market, trapping the companies in the domestic market. The Japanese 3G standard was not adopted elsewhere, nor was there significant participation of international IT players in the standards, creating a phenomenon called by Kushida (2011) as leading without followers. The size and rapid growth of the Chinese cellphone market and its relative openness to foreign players suggests that a similar outcome with isolated development is unlikely to happen in China.
This case compounds two lessons. Lesson one is similar to the one learned from governmental procurement policy: in a globalized era, the frontier of industrial technology will have to involve international collaboration, whether through joint ventures, strategic alliances, technological partnership or subcontract relationships. Even leading Chinese innovative companies such as Huawei have professed a preference for an environment of open innovation in which they can cooperate with international firms rather than develop all new technology from scratch (21st Economic Report Daily, 2009). China will have to remain open internationally and engage in foreign collaboration if it intends to be a valued member of international technological alliances.
Lesson two is that the capacity of China’s own firms, unless buoyed by strong internal R&D aptitude, is currently insufficient to compete with top firms in the international arena. This capacity refers not only to R&D but also the holistic ability to have strategic control over R&D, production, marketing, and collaboration of the entire commodity chain. Such capacity will take time to develop, and setbacks are necessarily part of the process. A number of Chinese companies such as Huawei are successful in pushing for innovation.
4. SOE and Non-State Firms in Innovation Performance
The role of non-state firms in China’s innovation system is an important and controversial one. There has been compelling evidence that the Chinese state has long favored SOEs in finance and industrial policy at the expense of non-state firms, and that such state involvement intensified considerably after the 2008 financial crisis (Naughton, 2011). Some scholars called it “Guojinmintui”, translated as “expansion of the state and retreat of the non-state (Breslin 2011).” The reality, however, is rather more mixed, varies across industries and regions in consideration, and depends on the measurements that one uses. We examine the Chinese S&T statistical yearbook to discern some patterns.
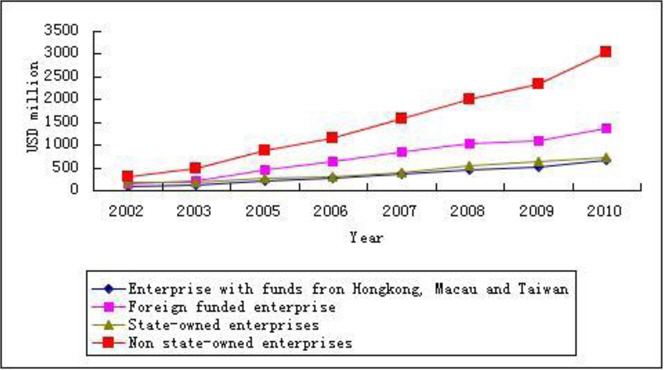
Based on data collected between 2002 and 2010, we can summarize the following phenomena regarding the situation of non-state enterprises. While non-state enterprises had faster growth rates than foreign firms and SOEs as a whole, they remained smaller and less capitalized than SOEs in terms of individual size, in part, reflecting the sector distribution of such enterprises (Figure 3). While the GDP share of SOEs is decreasing, the power of state-owned enterprise in controlling the crucial segments of the economy has not diminished, and even expanded in several key sectors. SOEs enjoy dominant positions in resource intensive industries, such as in the petrochemical, power, national defense, finance, communication, transportation, mining, metallurgy, and machinery sectors. They control 55% of China’s electricity supply, 48% of automobile output, and 70% of hydroelectric generation equipment (Xinhua.Net, 2008). They also have effective control over the core industrial and infrastructural sectors. The non-state-owned enterprises, while gaining status, are still weak compared to SOEs. They are concentrated downstream, in sectors with relatively low fixed costs that are more consumer-oriented with lower profit margins.
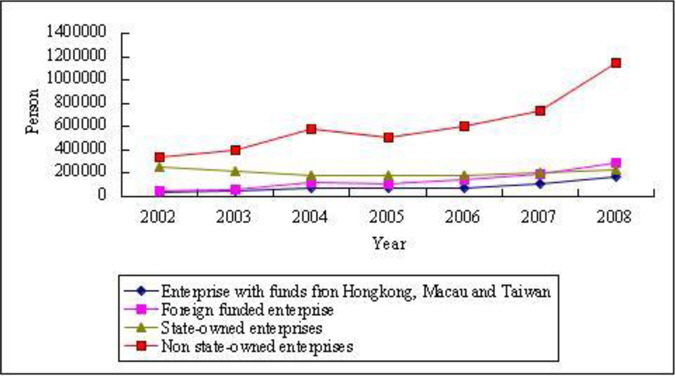
While effective innovation may be difficult to measure, we use a few proxy measurements to examine the R&D capacity of non-state enterprises. One is the number of scientists and engineers employed (Figure 4). Traditionally, only large SOEs can afford to hire a high number of scientists and engineers. But from Figure 4, we can see that the absolute number of scientists and engineers in SOEs declined slightly in 2008, while the share of scientists and engineers in non-SOEs increased sharply from 49.5% in 2002 to 62.7% in 2008. The absolute number of scientists and engineers hired by non-SOEs with funds from Hong Kong, Macau, & Taiwan and by foreign-funded enterprises has increased as well, although not as dramatically.
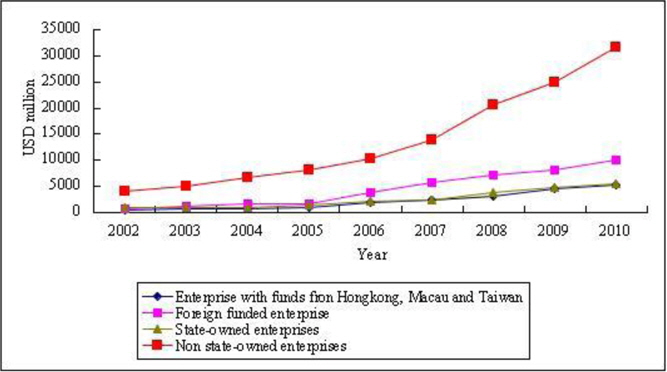
This trend parallels the spending on R&D (Figure 5). After 2003, all forms of enterprises have been accelerating their R&D expenditures. By 2010, SOEs accounted for 10.7%, while non-SOEs accounted for 64.7% in 2002 and 60.1% in 2010.
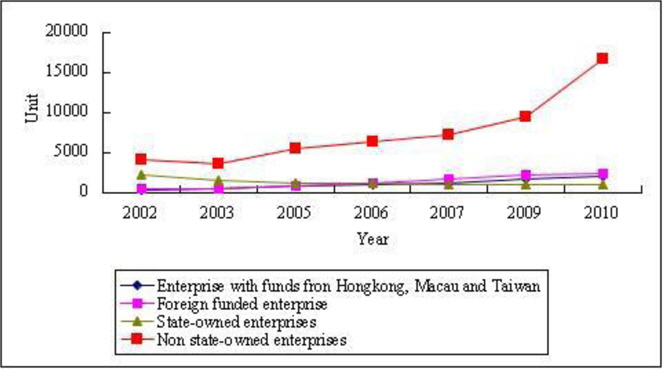
The number of R&D institutes in enterprises is another important indicator of innovation capability. From Figure 6, we can see that an increasing number of non-SOEs have set up their own R&D labs. The ratio of firms which have R&D labs in non-SOEs in 2010 reached 74.9%, while the number of research institutes owned by SOEs continues to decrease, accounting for only 5.0%. SOEs are the only type of firms with declining number of R&D labs as shown in Figure 6.
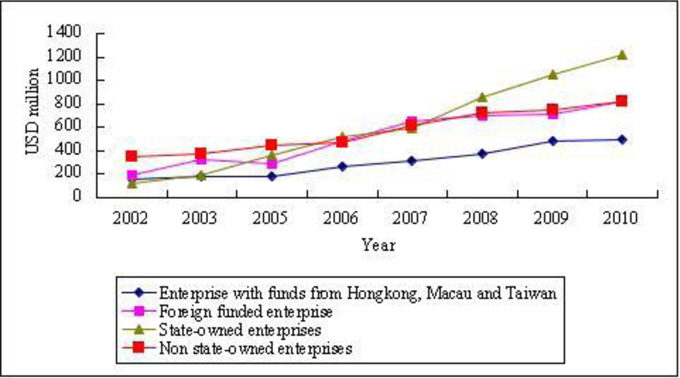
Interestingly, although the number of state-owned enterprises’ labs is in decline, as shown in Figure 7, a comparison of the average expenditure of R&D labs for different types of ownership shows that SOEs rank first, especially after 2006, followed by non-SOEs and foreign-invested enterprises with similar amounts. Hong Kong, Macao and Taiwan-invested enterprises were at the lowest level through 2010. This suggests that either R&D labs in SOEs have become more capital intensive and sophisticated, or that such labs have an easier time receiving state funding than other types of labs. It is likely that after China issued indigenous innovation policy, the heightened state R&D investment went disproportionately to SOEs. Firms from Hong Kong, Macau and Taiwan tend to concentrate on labor intensive assembly in their operation in the mainland so it is not surprising that they have the lowest position. Non-state firms have a similar trajectory with foreign companies. It shows that despite the reform since the 1980s, non-state sectors continue to face barriers on R&D funding allocations from the state. Additionally, at the end of 2007, MNCs had set up more than 1,160 R&D labs across China (Xinhua Net, 2008).
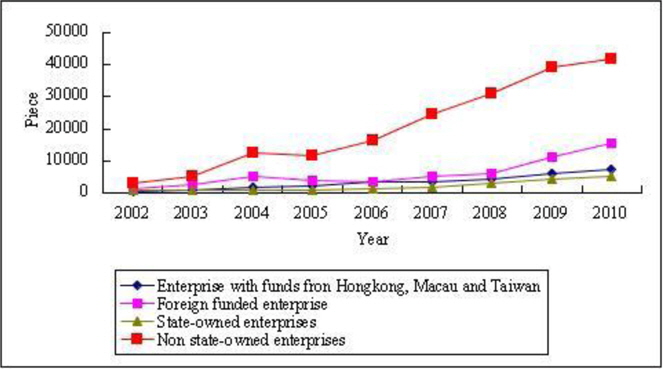
If we examine the number of application for patent (Figure 8), it seems that non-state firms have had the highest growth, and next are foreign firms and SOE has the lowest patent application. Patent statistics are tricky measures because they do not give the level of innovation. Also the number with foreign firms can also be patent reapplication for R&D results in other countries. But what is undeniable is the growth of patent from non-state firms.
The above indicators show that Chinese non-state sectors have increased their R&D capacity tremendously in the last decade or so. So, China’s indigenous innovation policies do have the effect of increasing R&D spending amongst all types of firms. Although the state R&D funding allocation seemed to favor SOEs, non-state companies have also benefited from the indigenous innovation policy, although not proportionally to their shares of GDP, R&D budget and patents. For China to have a more effective innovation system, the state not only needs to be willing to spend, which it currently does, but also to become smarter and more fair in how R&D resources are allocated. The state controlled system, with its enormous resources is able to make strategic advances in key sectors, but this system is not equally effective in propagating technological assimilation and in technology diffusion to the broader society.
The R&D spending in non-state sectors is highly responsive to the needs of the market and society, but is not well supported by the state and faces a battle against monopolies held by SOEs and well capitalized foreign enterprises. It is certain that, as China’s economy moves ahead, more innovation will come from the interactions of Chinese and global firms, and from non-state companies that have to generate higher-quality, lower-cost products (i.e. to innovate).
5. Bottom-Up Innovation Model: Case of Photovoltaic Industry
In China, there is a model of bottom-up innovation in which the entrepreneur plays the key role. Local government and local university are also very important. Besides, this model is embedded into global innovation system.
In the photovoltaic university, the first company is set up by a returnee called Shi Zhengrong in 2000, with technology developed at University of New South Wells, Australia. And he brought a business plan to look for commercialization opportunities.
By 2001, the city of Wuxi, Jiangsu, agreed to invest $6 million in Shi’s new venture, Wuxi Suntech, in exchange for 75 percent ownership (Batson 2006; Ahrens 2013).
By August 2002, Suntech launched its 15 MW solar cell production line in part using equipment acquired from the bankrupt U.S.-based Astrosolar (Flannery 2006).
In December 2005, Suntech completed an IPO on the NYSE for $396 million, and achieved a market capitalization of about $4 billion (to later peak at $16 billion). The largesse lavished on Suntech by investors has been present for few solar firms in the last decade. This set an example for flooding in the investment in this industry.
But the industry owned a lot of market formation policy in European countries which induced the born of fast growing industry
Technology transfer helps the industry with capacity from zero to world leader and constant learning innovation in processing and material by Chinese company.
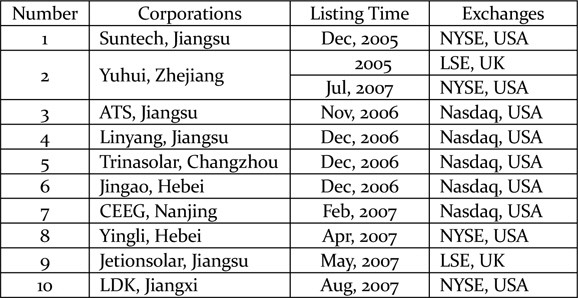
At the same time, foreign capital helps the industry to go global. Earlier, local bank and securities did not trust them; it is the New York stock exchange market that supported the industry (Table 5).
[Table 5] Private companies listed overseas by 2007

Private companies listed overseas by 2007
Although strategic emerging industries are a hot topic in China, we find that it is the regional governments that push their industries ahead of the central government. For example, before the National Plan for Emerging Industries of Strategic Importance came out, eighteen provinces had already put forward the idea to build new energy bases. Almost one hundred cities have started solar and wind power industries. The government of Wuxi helped Suntech to start up its photovoltaic business in the 1990s, during a time that no other regional government or ministries of the central government recognized its potential as a green and strategic industry.
However, regional governments echoed the central government quickly when the central government made the decision to develop “emerging industries of strategic importance” in 2009.The governments of some cities even proposed that they would carry out one hundred major projects related to emerging industries of strategic importance each year during the Twelfth Five-Year Plan according to Wu Xiaoqing, vice chairman of the Central Committee of the China Democratic National Construction Association and deputy minister of the Ministry of Environmental Protection. To seize opportunities in developing emerging industries of strategic importance, most local governments had executed and enacted corresponding policies one after another.
Regional clusters and networking are the characteristics of new industry in China. The development of the solar photovoltaic industry in Jiangsu Province started with the establishment of Suntech Power Holding Co. Ltd. in Wuxi in 2001. With almost ten years of development behind it, a relatively complete industrial chain has been formed. In this industry, upstream enterprises have gained some development, mid-stream enterprises have become strong quickly, and downstream enterprises emerge one after another.
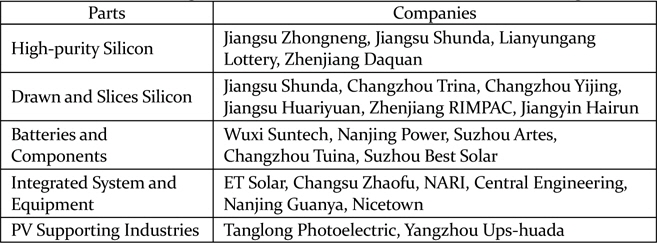
Many regions in Jiangsu have joined this industry. Of those companies, Suntech specializes in batteries and had in the past imported poly-silicon material from abroad. Now, companies in the cities of Zhengjiang and Lianyungang have become the poly-silicon material suppliers for Suntech, reducing its costs. And companies in Changzhou have become the main suppliers of slicing (the technology for cutting the silicon into wafers). There are also some downstream companies that play a role as integrators for solar generators (Table 6).
[Table 6] Clustering and value chain of photovoltaic industry in Jiangsu

Clustering and value chain of photovoltaic industry in Jiangsu
It is true that after the implementation of indigenous innovation since 2006, leading SOEs are becoming more powerful in critical industries, but contrary to our expectations we find that, in China, private companies have accumulated more innovation capability than the SOEs in the past five years. Even though the Chinese government is very powerful, the real pushing power for innovation is the invisible hand.
We can say that in China, there are two kinds of innovation systems. One is top-down or state led system, the system has government, research institutes and universities and large SOEs as the major actors. This system failed in some ways, as the SOEs did not have any incentive for innovation, such as in the auto industry and the chip industry. But it succeeds in some sectors with more clear targets such as high speed rail, etc. However, the system works for catching up, rather than innovation.
The market led innovation system has private enterprises as the new main actors and this is more important in a competition driven industry. Huawei, Alibaba, Lenovo are the leaders in their industry. They have been faster to spend R&D and hire R&D people than SOEs.
In the same time, based on our findings, Chinese efforts for indigenous innovation face the challenge of how to build a global innovation network. The challenge is: Can a large domestic market alone ensure that indigenous innovation works in China? We found this to be true in some industries, such as high-speed train sector. Here, the demand is obvious. The money for the project is huge and the government-led consortia worked. The fastest bullet train has now been developed in China (Chen 2010). But in most competitive industries, this kind of strategy is very limited in its potential. The large airplane project is an example of this. The C919 aircraft is the product that Chinese companies are using to compete with Boeing and Airbus, but the orders are all from domestic SOEs. Though the domestic aircraft market is the largest in the world, can just the domestic market guarantee the critical mass necessary for final success? A government-led research consortia regime will reach its limit and open innovation is required to progress beyond those limits. Government protection that is too strong may trap companies in the domestic market.
In conclusion, the package of indigenous innovation policy is constructive and efficient for a catch-up economy with clear industry targets but not for radical innovation. For China to be an innovative country, it needs to give the market space to incubate and eventually yield radical innovation. China should make its policies more open than before. A completely inward-facing domestic market cannot give domestic companies the space they need to be globally innovative companies. Chinese enterprises cannot close themselves off to the global technology system. Only open innovation can give Chinese companies the possibility to win the next wave of innovation in the world and make China an innovative country.