A method for the measurement of the concentration of methane is experimentally demonstrated. The wavelength filter and gas cell are combined by using one Fabry-Perot etalon, which is filmed with the reflectivity of 96%. The optical broadband source is not only filtered to match the absorption wavelength of methane, but also absorbed by the methane in the same Fabry-Perot etalon. The concentration of the methane can be detected directly by measuring the transmission intensity. Compared with the conventional method, the proposed method possesses low costand high stability.
Methane gas, which is inflammable and explosive, is the primary dangerous in many industrial areas. Detecting the concentration of methane safely and reliably plays an important rolein the safety of these industrial areas [1]. The most conventional approach for the detection of methane is based on the catalyst combustion. In the method, methane gas ignited with a palladium catalyst and the temperature of the palladium catalyst rises simultaneously. However, the catalyst requires scheduled replacement because it is susceptible to surface poisoning. Besides, the current of the power is relatively high in order to drive the sensor for long distance. Moreover, the accuracy of the method is low because the palladium is sensitive to any gas other than methane [2].
Optical gas sensors attracted a great deal of attention over the past decade because of their particular characteristics, such as light weight, small size, high sensitivity, and immunity to electromagnetic fields [3]. Optical gas sensors show great promise in applications of chemical and gas detection with many advantages, such as excellent remote monitoring at long distance, resistance to electromagnetic interference, and safety in flammable and explosive situations. The most important method for the remote monitoring of methane is based on the spectroscopic absorption [4, 5]. The proposed method can be realized in many ways, such as a compact hollow waveguides [6], wavelength-division multiplexing [7], and laser diodes [8, 9]. The absorption lines lie within the mid infrared region. The guide light is absorbed with the increase of the concentration of the methane. The spectroscopic absorption technique is beneficial due to its ability to eliminate the influences of dispersion, perturbation of gas, and the transmission loss caused by dust, water vapor, and connectors, etc [10]. However, some of methods suffered from low system sensitivity and poor mechanical stability, some other methods are too expensive because they use some special devices such as laser diodes with a typical spectral width less than 1 MHz.
In previous work, some gas sensors based on the Fabry-Perot cavity have already been investigated. In Ref. [11], a methane sensor based on a short confocal Fabry-Perot cavity was realized. Although the sensor possesses high sensitivity and wide dynamic range, the Fabry-Perot cavity only increases the reaction length between the light and gas. In Ref. [12] and Ref. [13], a new type of remotesensing radiometer based on the Fabry-Perot interferometric technique and an imaging sensor for remote detection of natural gas leaks have been developed,. The Fabry-Perot cavity in these methods only functions as a band pass filter. Thus these methods are realized by using the direct absorption spectroscopy, which limits the minimum detectable absorbance. Besides, the gas cells in these methods are separated with the Fabry-Perot cavity, thus the size of the sensor is unsuitable for measurement in real applications. Compared with the conventional method, the Fabry-Perot cavity in the proposed method not only matches the absorption lines as a band pass filter, but is also absorbed by the methane in the same Fabry-Perot etalon. Therefore, the proposed method also possesses low cost. sensor is unsuitable for measurement in real applications. Compared with the conventional method, the Fabry-Perot cavity in the proposed method not only matches the absorption lines as a band pass filter, but is also absorbed by the methane in the same Fabry-Perot etalon. Therefore, the proposed method also possesses low cost.
In this paper, we present an optical fiber gas sensor for the measurement of methane based on the multi-beam interferometry and spectroscopic absorption. The wavelength filter and gas cell is combined by using the Fabry-Perot etalon, which is coated with a film with the reflectivity of 96%. The optical broadband source is not only filtered to match the absorption line of methane, but also functions as a gas cell. The concentration of the methane can be detected directly by using the differential absorption technique. The experiment results show that a high methane resolution of up to 670 ppm is achieved. Compared with the conventional method, the proposed method possesses low cost and high stability.
According to the spectroscopic absorption, the gas concentration can be estimated by measuring the ratio between the original optical power and the transmission optical power. Conventional methods always choose a broadband light source to cover the whole absorption spectrum [14]. However, with the same wavelength range of the broadband light source, other gas absorption lines also exist, thus such methane gas sensors are sensitive tocross gases. Besides, the absorption line of methane gas is much less than the wavelength ranges of the broadband light source, which results in a very small optical power variation even for relative high gas concentrations. Although some techniques utilize a light source with a predefined selectivity within the operation spectrum to match the methane absorption lines, it increases the cost of the sensor significantly. On the other hand, in order to enhance the minimal detectable gas concentration, the most straight forward way is to use a gas cell with a long interactive cavity length. However, there is a tradeoff between the real implementation and the measurement accuracy for the gas sensor system [10].
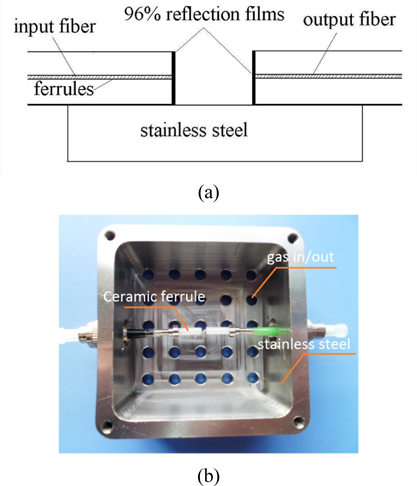
The proposed methane sensor is shown in Fig. 1. Firstly, single-mode optical fibers (SMF) with cleaved ends are inserted into two ceramic ferrules [15]. Secondly, ceramic ferrules are polished, and multilayer dielectric mirrors are deposited on the polished endfaces of the fibers by using electron-beam evaporation [16]. Thirdly, two filmed ceramic ferrules are aligned and fixed in the stainless steel by using the epoxy. An air-gap cavity is formed between the two multilayer dielectric mirrors, which ensure the monitored methane can freely enter into the cavity. Therefore, a film-covered Fabry-Perot etalon is formed [17].
The multilayer dielectric mirror is used because it has not only a very good antioxygenic property at room temperature, but also very stable reflectance in the near-infrared (NIR) region [16]. Here, materials of multilayer dielectric mirror are ZrO2 and SiO2. Both the multilayer dielectric mirrorsare designed as a twenty-layer coating and thicknesses of ZrO2 and SiO2are 157 and 225 nm, respectively. The multilayer dielectric mirror has a peak reflectance of 0.963 at a wavelength of 1655 nm, but down to 0.953 at wavelengths of 1645 and 1667 nm.
The relationship between the length of the cavity and the transmission peaks is predicted by the multi-beams interferometry [18, 19]
Where
Most absorption lines of gases are located within the low-loss transmission window of silica fiber [9, 20]. Fiber-optic gas sensors for the air pollution and noxious and explosive gases are mostly based on monitoring the optical power attenuation induced by the gas molecule’s absorption. The Beer-Lambert Law can be expressed as [10]
Where
According to the Beer-Lambert Law and the multibeams interferometry, when the guide light propagates through the Fabry-Perot etalon, the first transmission light can be expressed as
Where
The optical power of the second transmission light can be expressed
The optical power of the third transmission light can be expressed
The optical power of the
Where
Therefore, when the guide light is absorbed by the methane, the sum of the multi-transmission light can be expressed
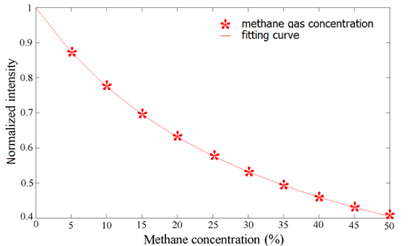
Assuming the absorption coefficient of the methane wavelength of 1655 nm is 15 m-1 [10], the simulation of the normalized transition light is shown in Fig. 2.
With the increase of the concentration of the methane, the transmission light is decreased simultaneously. Therefore, the concentration of the methane can be detected by measuring the transmission light.
III. EXPERIMENTAL RESULTS AND DISCUSSION
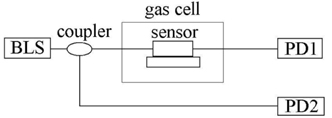
The schematic diagram of the experimental setup is shown in Fig. 3. The broadband light source (BLS) is an LED source with wavelength covering 1200-1700 nm (83437A, AGILENT), and the output power is 20 mW. The light is divided into two beams by a 90:10 coupler. One light beam with 90% power is injected into the Fabry-Perot etalon. The insertion loss ofthe Fabry-Perot etalon is ~6 dB. The transmission light of the Fabry-Perot etalon is detected by a photo-diode, PD1. Since the optical spectra of the peaks have matched absorption lines of methane gas by using a Fabry-Perot etalon, the optical light was effectively absorbed by the gas under test. Another light beam with 10% power is detected by a photo-diode, PD2, directly. Then two electric signals from PD were converted into digital signals after two analog-to-digital converter modules, and are processed by a digital signal processing module to calculate and display the concentration of the methane gas by using a differential detection technique, which could remove the power fluctuation of the BLS.
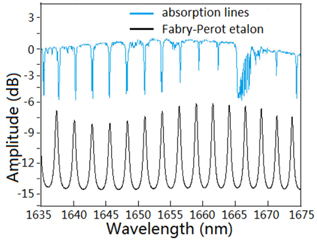
Figure 4 shows that the calculated transmission spectrum of the Fabry-Perot etalon. The wavelength peaks (black line) matches very well with most of the absorption lines (blue line) within the wavelength range of 1635-1675 nm. Due to the removal of background light, the more matched the absorption lines are, the greater the sensitivity of the sensor will be. However, due to the uniform wavelength spacing of the methane absorption lines at the near-IR band, seven wavelength peaks in the optical spectrum have matched the absorption lines of methane gas.
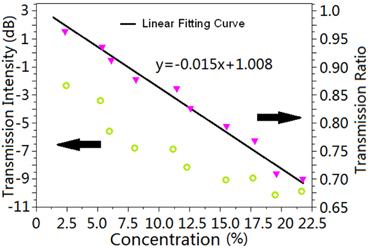
The Fabry-Perot etalon is fixed in agas cell, and experimental measurements are carried out with a series of standard gas of methane from 2.5% to 22.5%. The corresponding response of the transmission intensity to methane was detected, as shown in Fig. 5. With the increase of the methane, the transmission intensity decreased simultaneously. The measured transmission intensities were -2.3, -8.0, and -10.1 dB with the concentrations of 2.5, 12.5, 19.5%, respectively. We also calculated the transmission ratio between PD1 and PD2. As shown in Fig. 5, the transmission ratio reached 0.91 with the concentration of 6%. The relationship between the transmission ratio and the methane is approximately linear. The linear fitting curve can be expressed as
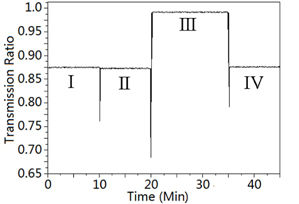
The influence of cross gas for the measurement is also investigated. Acetylene gas was pumped into the gas cell. Since there are also some absorption lines of acetylene gas within the same spectrum, the acetylene gas is treated as apotential interfering gas for methane gas detection. Figure 6 shows the corresponding transmission ratio for different cross gases, which can be divided into 4 segments. The segment I shows the starting point of the measurement, which the concentration of the methane is 7.5%. The segment II of the curve shows the introduction of the acetylene gas with the concentration of 100% in the gas cell. Wecan observe that no obvious power variation occurs. Then nitrogen gas is used as the emptying gas to pump the gas out of the gas cell, asit is nontoxic and has no evident absorption lines within such SLED’s spectrum. Around 0.1125 power variations can be observed due to emptying of the gas cell. Finally, the methane, of which the concentration of 7.5% is pumped into the gas cell again, and the transmission ratio returnsto that in segment I, as shown in segment IV. We can conclude that the cross gas sensitivity is well resolved. The experimental results show the proposed gas sensor’s effectiveness in the mitigation of the cross gas sensitivity during methane gas concentration measurement.
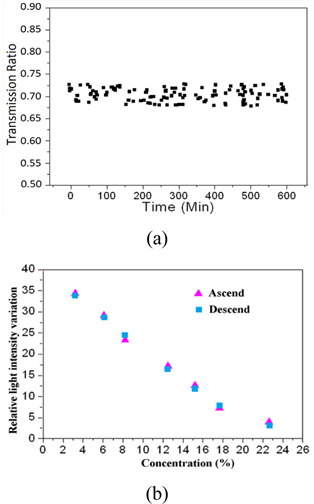
The sensor was evaluated for its stability and repeatability. To test the stability ofthe sensor, a Fabry-Perot etalon was fixed in an environmental chamber, in which the concentration of the methane is 20%. The transmission ratio was measured 60 times over duration of 3 hours. As shown in Fig. 7 (a), the standard variation of the transmission ratio is only 0.22%, which indicates the good stability of the sensor. Besides, the repeatability of the sensor was also experimentally tested. The concentration of the methane in the environmental chamber was adjusted in an ascending and descending order, respectively, and the corresponding transmission ratio is shown in Fig. 7 (b). Results in ascending and descending order are in good agreement with each other; the maximum variation is only 0.3% with the concentration of 40%.
Although the proposed method utilizes a BLS, the methane absorption lines are filtered by using the film-coated Fabry-Perotetalon, and the absorption lines of other cross gases areremoved, which increase the effective mitigation of cross gas sensitivity. Besides, the wavelength of the transmission light is matched to the methane absorption line, which removes the background light, and the guided light travels multiple times within the gas cell cavity due to the multilayer dielectric mirror. Therefore, the high sensitivity of the methane measurement is achieved. Note that the Fabry-Perot etalon for the measurement of methane gas can also be applied to monitor other gases after varying the length of the Fabry- Perot etalon according to the wavelength spacing of a specific gas’s absorption lines.
In conclusion, a compact methane gas sensor based on the Fabry-Perot etalon is proposed and experimentally demonstrated. The wavelength filter and gas cell are combined by using only one Fabry-Perot etalon, which is film-coated with the reflectivity of 96%. The optical broadband source is not only filtered to match the absorption wavelength of methane, but also absorbed by the methane in the same Fabry-Perot etalon. The concentration of the methane can be detected directly by measuring the transmission intensity. Experimental measurements for the methane with different concentrations have been carried out, and a resolution of up to 670 ppm is achieved. Compared with the conventional method, the proposed method possesses low cost and high stability.