Integral imaging (II) has been actively researched as one of the next-generation 3D display techniques [1-9]. This is due to full parallax, continuous viewing points and full-color 3D images. II has simple structure of both pickup and display schemes compared to other glass-free 3D displays. It uses a lenslet array to capture and display 3D information. That is, a 3D object is recorded through a lenslet array. Here the recorded images are called elemental images. And, the 3D images are formed by integrating the rays from 2D elemental images by use of a lenslet array.
Recently, several 3D imaging methods have been studied to extract high-resolution 3D information in a 3D scene. Among them, an axially distributed image sensing (ADS) method [10-14] has been proposed. In this method, a single camera is translated along its optical axis and then longitudinal perspective information is obtained for a 3D scene. Compared with the other 3D imaging techniques, it can provide simple structure such as single movement and high resolution elemental images. Therefore, it can be used to extract a high-resolution depth map in the practical environment.
In this paper, we propose a 3D display method combining the pickup process using axially recorded multiple images and the integral imaging display process. First, we extract the color and depth information of 3D objects for displaying 3D images from axially recorded multiple 2D images. Next, using the extracted depth map and color images, elemental images are computationally synthesized based on a ray mapping model between 3D space and the elemental image plane. Finally, we display 3D images optically by an integral imaging system with a lenslet array. We perform the preliminary experiment and present the experimental results.
II. 3D INTEGRAL IMAGING DISPLAY USING AXIALLY RECORDED MULTIPLE 2D IMAGES
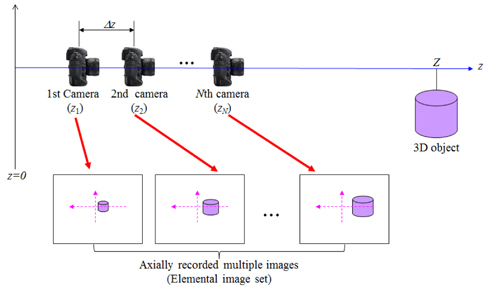
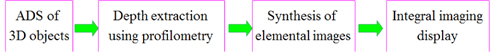
In this section, we present a 3D integral imaging display system using axially recorded multiple 2D images as shown in Fig. 1. It is consisted of four processes: the ADS pickup process, depth extraction process, computationally elemental image synthesis process, and integral imaging display process.
Figure 2 illustrates the ADS pickup stage. Multiple 2D images with slightly different perspectives are recorded by translating the single camera along its optical axis [10]. The focal length of the imaging lens is
2.2. Depth Extraction using Profilometry
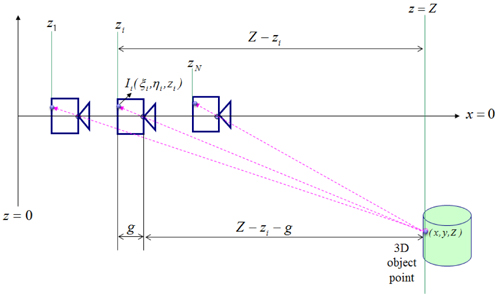
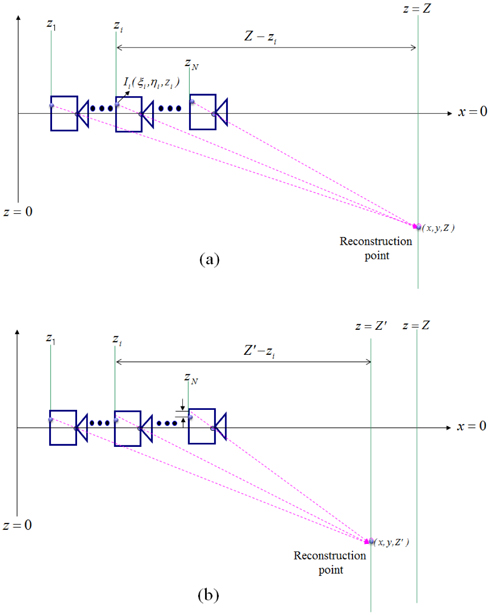
In this section, we explain the point-based depth extraction method using the profilometry for axially recorded multiple images. The basic principle of our depth extraction method is to find the depth information of 3D objects using statistical variance of intensity of integrated rays generated from all the recorded multiple images. That is, rays from a 3D object point are recorded into the different images according to the camera position as shown in Fig. 3. The corresponding pixel of the 3D object point in each camera is recorded with the same intensity level. When we reconstruct the integrated rays at the original position of the 3D object point as shown in Fig. 4(a), all intensities of rays become the same. On the other hand, rays have different intensities when the estimation position is not equal to the original position of the 3D object point as shown in Fig. 4(b). Based on this principle, we can estimate the depth information using the statistical variance of intensity distribution of integrated rays. However, it does not consider spatial variation of pixel intensity in the local area around the 3D object point. Thus, it may increase the noise which is caused by point-wise depth fluctuation in the extracted depth map.
Let us estimate the reconstruction point with (
Then, we define the variance metric D as
From Eq. (2), it is seen that the variance metric
Finally, when the local minimum variance metric is found, the intensity value of the 3D object point can be obtained using the mean value as described in the following equation:
To obtain the final depth map and the color image of the 3D object, the depth estimation process is repeated for all
2.3. Generation Process of Elemental Images
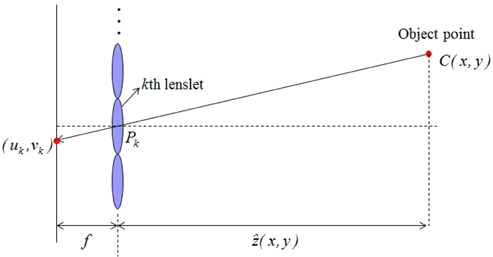
Now, we present the generation process of elemental images for the 3D display from the calculated depth map and color image. The generation process of elemental images based on the geometry of pixel mapping between 3D object points and the elemental images plane through the lenslet array (in fact, virtual pinhole array) is shown in Fig. 5. The rays from the 3D object point pass through the center of each lenslet (virtual pinhole) and then they are recorded into the corresponding pixels in the elemental image plane. The pixel coordinates for the recorded pixels in each elemental image are given by
where
2.4. Display of 3D Images in DPII System
In a typical II system, depth-priority integral imaging (DPII) and resolution-priority integral imaging (RPII) can be classified by the gap between the lenslet array and the display panel,
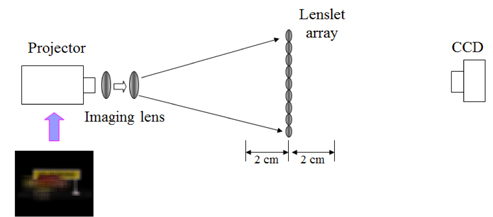
Figure 6 illustrates the DPII system setup to display 3D images using computationally synthesized elemental images from axially recorded multiple images. The elemental images are focused at the focal plane of the lenslet array by passing through the projector to implement the DPII system. Then, 3D images are displayed in free space by displaying the elemental images through the lenslet array. We capture 3D images at different viewpoints to prove that the DPII system can provide the full parallax of 3D objects.
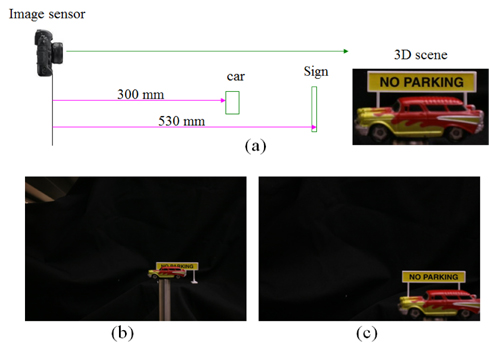
To demonstrate the proposed scheme, we performed preliminary experiments. Figure 7 shows the entire experimental system setup including the ADS process and the DPII display process. First, the 3D object is composed of two toys: ‘car’ and ‘sign board’ as shown in Fig. 7. They have different shapes and colors. They are located at 300 mm and 530 mm from the image sensor, respectively. In the ADS pickup process, the objects should be located out of the optical axis due to the low perspective collection of 3D objects near the optical axis. Therefore, two toys are located at approximately 80 mm from the optical axis. Their size is approximately 40 mm×30 mm. We record multiple 2D images by moving the single image sensor along its optical axis. We use a Nikon camera (D70) whose pixels are 2184(H)×1426(V). The imaging lens with focal length
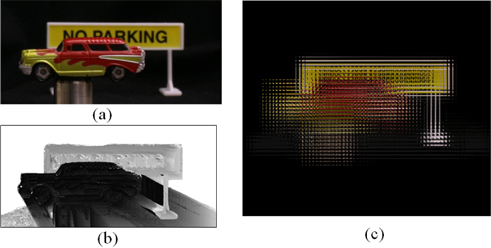
For the synthesis of elemental images, we extract the depth map and color image using the depth extraction process (i.e. profilometry) as described in Chapter 2.2. The depth search range of
Then, the extracted depth map and color image are used to synthesize the elemental images for the DPII display as explained in Fig. 5. 3D object points are located within 20 mm(H) to 20 mm(V). To fit the depth range between real 3D objects and displayed 3D images, we used the rescale process [4]. That is, we relocated the ‘car’ object at 30mm and the ‘sign’ object at -20mm in the display space. In addition, the depth inversion was applied to avoid the pseudoscopic image problem in the integral imaging display. The computationally modeled lenslet array has 45(H)×45(V) lenslets and each elemental image is mapped with 20(H)×20(V) pixels through a single lenslet. Thus, we synthesize an elemental image array of 900(H)×900(V) pixels as shown in Fig. 8(c).
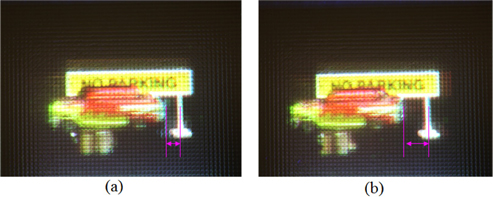
Finally, we carried out the optical experiments to display 3D images using the synthesized elemental image array in the DPII as shown in Fig. 8(c). In the experimental setup as shown in Fig. 6, the elemental images are displayed through a projector. The lenslet array has 45(H)×45(V) lenslets whose focal length and diameter are 3 mm and 1.08 mm, respectively. The size of reconstructed images is approximately 5 mm. The ‘car’ image is observed at
In conclusion, a novel integral imaging display method has been proposed using axially recorded multiple images. The proposed method extracts 3D information based on the statistical variance of rays from a 3D object point. With the extracted 3D information of objects, the elemental images are computationally synthesized based on a ray mapping model between 3D space and an elemental image plane. We can display 3D images optically in the depthpriority integral imaging system with lenslet array. The experimental results show that the proposed method can display 3D images using the elemental images synthesized from axially recorded multiple 2D images.