Recently, porous silicon (PS) has generated a great interest for use in photonic structures and optical devices. Several studies of PS were devoted to understanding the formation mechanisms of pores and porous multilayer structures and the relationship of PS with its physical and chemical properties that can be altered easily just by controlling the current density and electrolyte solution in the electrochemical etching process [1-3]. The one-dimensional porous silicon photonic crystal (1D-PSPC) devices such as optical filters and microcavities in the PS technology have been achieved by multilayer structure formation with periodic refractive index sequence [4]. The periodic sequence was obtained by controlling the current density and etching time in a periodic way while the others electrochemical parameters were fixed [5]. The PS photonic crystal structures have large potential for use in the optical sensor technology, especially in the gas and liquid-phase sensors [6-9]. The specifications of these optical devices are the porous structure of constituent layers that showed high specific surface area for interaction with ambient gas or liquid. Then the nanoporous structural features have allowed fabrication of high sensitivity gas, chemical and/or biosensors [10-12]. In the literature on the nano-PS photonic sensors, most papers show PS distributed feedback (DFB) structures with large reflectance spectra that limited the accuracy of the measurement. In addition, the role of porosity and its contrast with the multilayer structures, which strongly depends on preparation process, still has not been discussed.
In this paper, we present research results on preparation of the liquid-phase photonic sensors based on nano-PS microcavity structures and the influences of the configuration and porosity of multilayers on the sensitivity and accuracy of measurements using simulation and experiments. We show the fabrication process and characteristics of liquidphase sensors based on nano-PS microcavity using an electrochemical etching method. Simulation study is based on the transfer matrix method (TMM), which developed our previous results in ref. [13] for prediction of porosity of multilayers. The sensor response is given by the shift of the resonant wavelength of the microcavity when the sensors are immersed in liquids. A change of sensor reflectance spectra is temporary, that characteristic is useful for reversible optical sensing. The nano-porous silicon microcavity sensors can be used to investigate different kinds of gasoline such as bio-fuel (E5), A92 added ethanol and methanol with concentrations of 5%-15%.
II. DESIGN AND PREPARATION OF NANO-POROUS SILICON MICROCAVITY
For design of nano-porous silicon microcavity (PSM), we use the TMM for calculation of the parameters of multilayer structures. The microcavity structure was designed by using the (HL)
In this equation λ is the wavelength corresponding to the center of the photonic band gap (PBG) region; nH and nL (dH and dL) are the refractive indices (thicknesses) of the H and L layers, respectively.
Porous silicon layers with different refractive indices were formed by electrochemical etching of a highly doped p-type silicon wafer (resistivity is of 0.01 ÷ 0.1 Ω.cm) in an aqueous HF: ethanol electrolyte, because the p-type silicon substrates yield the most favorable porous silicon morphology. The electrolyte with concentration of 16% HF and ethanol of ratio 1:2 is chosen because of the large porosity variation obtained by varying the electrical current. The electrochemical etching process was controlled by computer program using Galvanostat equipment (Autolab PGSTAT 30), so precise control over electrical current density and etching time was achieved. The result is a good control of the refractive index and thickness over the individual layers forming the multilayer.
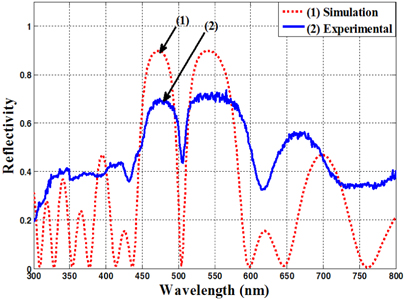
Figure 1 shows the calculation result with a numerical simulation and the experimental measured reflective spectrum of the microcavity based on (HL)
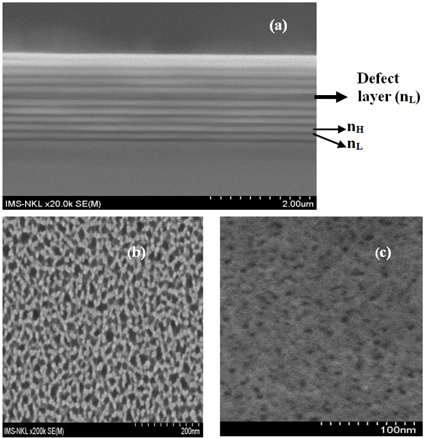
Figure 2 shows the image of a cross-section of the nano-porous silicon multilayer microcavity (Fig. 2(a)) and the surface plan views of the nano-porous silicon layers with high (Fig. 2(b)) and low refractive index (Fig. 2(c)), captured by ultrahigh resolution field emission scanning electron microscopy (FE-SEM) S-4800. The silicon pores have a size of 20-25 nm. For characterization of the nanoporous silicon microcavity, we used the ultraviolet-visiblenear infrared (UV-VIS-NIR) spectrophotometer (Varian Cary 5000) for measurement of reflective spectra of the samples. For prevention of aging in the porous silicon layers, we thermally annealed the samples at 200℃ in nitrogen ambient for a time of 60 minutes. After annealing, the resonant wavelength peak shifted 1.0-1.5 nm into the short-wavelength zone from the increasing pore density of the layers.
III. CHARACTERISTICS OF LIQUID-PHASE PHOTONIC SENSORS
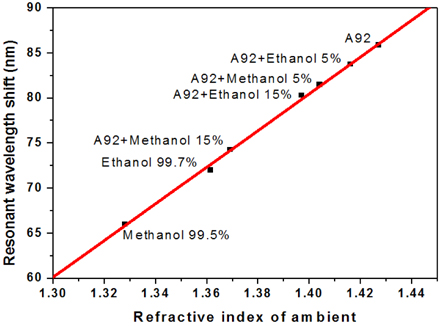
The basic characteristics of the porous silicon microcavity (PSM) and the resonant wavelength shift (Δλ) caused by the ambient refractive index (n), were built experimentally by using a series of liquids with known refractive indices. The effective refractive index of the nano-porous silicon layer immersed into organic solvent would be increased due to the substitution of air with liquid in the pores and consequently the optical thickness of the layer is increased. As a result, the resonant wavelength shift would be dependent upon the refractive index value of the organic solvent. Table 1 presents a series of organic solvent such as methanol 99.5%, ethanol 99.7%, isopropanol 99.7% and methylene chloride 99.5% (product of NHTC-China) with their refractive indices and the resonant wavelengths of the sensors, when they are dipped into the corresponding organic solvent for some minutes.
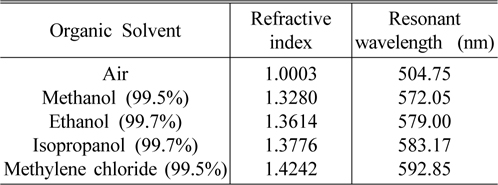
Various organic solvents with known refractive index and resonant wavelengths of sensors based on porous silicon microcavity dipped in corresponding solvent
Sensitivity (Δλ/Δn) is one of the most important parameters to evaluate the performance of the sensors. Using the experimental data in Table 1, we calculate the sensor sensitivity of about 200 nm/RIU. The Spectrophotometer Varian Cary 5000 is able to detect a wavelength shift of 0.1nm, corresponding to the minimum detectable refractive index change in the porous silicon layer of less than 10 -3 . Experiment shows that after complete evaporation of organic solvent, the reflectance spectra of the sensors return to their original waveform positions (as in the air). In our case the evaporation of organic solvents in open air at room temperature was carried out for 40-50 minutes, but this process can occur in 20 seconds when the samples are in a vacuum chamber with 10 -1 torr. That means, the change of sensor reflectance spectra are temporary, and it is useful for reversible optical sensing.
An important parameter of the microcavity sensor is that the change of the refractive index of the porous layer depends on the refractive index of the liquid as well as on the porosity of the porous layer. In Bruggeman effective medium approximation, the relation between effective refractive index of the pore layers (
Based on this relation we determined the porosity (
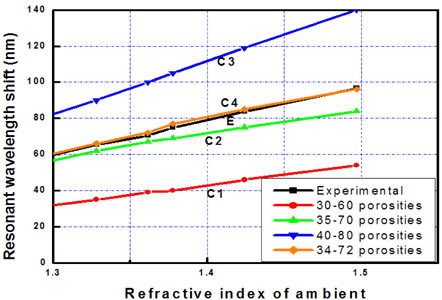
1. Determination of the refractive index of the defect layer based on the experimental resonant wavelength and the pore layer thickness from the scanning electron microscopy (SEM) image. 2. Determination of layer porosity in air using the relation (2). When the refractive indices of the pore layers in air changed from 2.739 to 1.323, the porosity of the layer changed from 30 to 80 by calculation.3. Determination of effective refractive index of the layer when the voids were filled by liquid with known refractive index using the relation (2).4. Determination of resonant wavelength of the sensor dipped into liquid using the simulation reflectance spectra.
Simulation shows that the contrast of the porosities (i.e. refractive indices) of the layers strongly influences the wavelength shift (i.e. on the sensitivity) of the microcavity. The contrast of the porosities would be high when the change of current density was large in the electrochemical etching process. However, the experiment shows that the imperfection of the interfaces of layers increased with the large change of current densities. In our work, when the porosity contrast of layers is more than 40, the reflective spectra of the device were deformed in the reflection intensity and the line-width of the transmittance zone.
The curves from C1 to C4 in Fig. 3 present the fitting process of sensor basic characteristics by simulations with that by experiment (curve E). The fitting showed that the porosity contract between two layers affects the sensor sensitivity (Δλ/Δn). Consequently, the matching process found suitable porosity of 34% and 72% of low and high porosity layers of the prepared sensor, respectively.
The microcavity-based sensors have been applied to determination of different solutions of ethanol and methanol in the commercial gasoline A92. Figure 4 shows the measured results of the resonant wavelength shift of the microcavity sensor immersed into gasoline A92 with different concentrations of ethanol and methanol. In the case of a mixture of ethanol/A92, a resonant wavelength shift is 3.6 nm, when ethanol concentration changed in the range from 5% to 15% in the gasoline. With the sensitivity of the sensor as described above, the minimum determination of ethanol concentration change in the gasoline is about 0.4%. In the case of methanol/A92, wavelength shifts are 7.2 nm between the 5% and 15% methanol mixtures,. From these experimental data, we suppose that the enhanced sensor can distinguish change of about 0.2% in concentration of methanol in the gasoline.
In conclusion, we successfully fabricated a nano-porous silicon microcavity with resonant wavelength in the visible region and used them as liquid-phase photonic sensors. We built the basic characteristics of sensors by simulation calculations and by experiment based on a series of organic solvents with known refractive indices. Enhanced sensor sensitivity of 200nm/RIU can detect a minimum refractive index change of about 10 -3 . We used these sensors for determination of ethanol and methanol concentration from 5% to 15% in the commercial gasoline A92. Based on the experimental data we suppose that the enhanced sensors can distinguish a small concentration of methanol and ethanol in gasoline. This sensor, to our knowledge, is suitable to detect the very small content of methanol that damages the resin details in cars and motorbikes.