Seven feeding trials were conducted to determine the effects of feeding rate and frequency in the Korean rockfish Sebastes schlegeli at seven different water temperatures. Two feeding-rate experiments for 5-g Korean rockfish at 17°C and 20°C; three feeding rate experiments for 16-g Korean rockfish at 16°C and 24°C; and finally, two feeding frequency experiments for 93- and 100-g at 15°C and 20°C were conducted. Twenty fish averaging 5.5 ± 0.2 g (mean ± SD) were randomly distributed into 18 indoor tanks containing 40-L seawater from a semi-recirculation system. Fish were fed a commercial diet for 4 weeks at water temperatures of 17°C and 20°C. Two feeding trials were conducted to determine the optimum feeding frequency in growing Korean rockfish reared at temperatures of 15°C and 19°C. Broken line regression analysis of weight gain (WG) indicated that the optimum feeding rates of 5-g growing Korean rockfish were 4.48% (BW/day; BW, body weight) at 17°C and 4.83% (BW/day) at 20°C. Broken line regression analysis of WG showed optimum feeding rates of 16-g juvenile Korean rockfish of 3.41% (BW/day) at 16°C, 3.75% (BW/day) at 20°C, and 3.34% (BW/day) at 24°C. The biological performance, results, along with morphological indices and serological characteristics, suggest that a feeding frequency of 1 meal/day was optimal to improve WG in growing Korean rockfish grown from 93 to 133 g at a water temperature of 15°C, and 100 to 132 g at 19°C.
The Korean rockfish,
The feeding rate is the amount of a specific feed fed per fish per day. The optimal feeding rate is the most important factor in the success of any aquaculture practice because overfeeding or underfeeding leads to increased disease, resulting in higher mortality. While overfeeding of juvenile fish does not create the same problems as in adult fishes, as the fish mature, feeding rates, frequencies, and protein content of the food must be reduced (Türker and Yildirim, 2011). The experimental evidence suggests that water temperature is an important factor that influences aquacultural practices (Desai and Singh, 2009), as it has a profound impact on feeding rate, functional responses, and growth rate (Oyugi et al., 2012). The optimum water temperature increases the metabolic rate and the feeding demand of the fish, while low temperatures cause sluggishness by slowing down the rate of digestion (Park et al., 2012). The optimum feeding rate and frequency depend on the fish species, size, and the rearing system used (Cho et al., 2003). It also varies with feeding frequency, nutrient content of the food, fish species, fish size, water temperature, and other water-quality parameters (Okorie et al., 2013).
The feeding frequency is how much and how often the fish feed over a specific time and is vital in the establishment of an appropriate feeding management program. Fish growth is influenced by several factors, such as feeding frequency, food intake, food type, and food ratios. The feeding frequency is one of the most important variables influencing growth and the feed conversion ratio in aquaculture husbandry practices (Biswas et al., 2010; Lee and Pham, 2010; Aydin et al., 2012). The growth of fish at all stages is largely governed by the kind of food, ratio, feeding frequency, food intake, and the fish’s ability to absorb the nutrients. Among these, feeding frequency is an important aspect in the survival and growth of juvenile fish (Mollah and Tan, 1982). Several studies have evaluated the effects of feeding frequency on growth, survival, feed utilization, and body composition in fish species including the juvenile Korean rockfish
The optimal feeding frequency improves fish growth, survival, feed conversion ratio, and also reduces size variations in the fish and environmental pollution (Tucker et al., 2006; Xie et al., 2011). Excessive feeding leads to a reduction in the feed conversion efficiency and increases input costs, and the accumulation of waste that adversely affects the water quality, whereas a sporadic feeding frequency may lead to increased hunger, intra-specific aggression, and an increased rate of cannibalism (Folkvord and Ottera, 1993). All these factors result in decreased production efficiency and increased production costs (Booth et al., 2008).
Each fish species has an optimum water-temperature range for rapid growth. Water temperature is a major influence on aquaculture husbandry practices and also a profound impact on the feeding rate. The feeding rate, water temperature, and fish size are three major factors that act synergistically to affect fish growth (Gardeur et al., 2007). Water tempera 230ture regulates fish metabolic activity, and each fish species is characterized by an ideal temperature range within which it grows quickly (Person-Le et al., 2006; Bjornsson et al., 2007; Oyugi et al., 2011), and fish grow quicker within their preferred temperature range (Molnar et al., 2006; Schulz et al., 2007; Ronyai and Csengeri, 2008). The optimum water temperature increases the metabolic rate and the food demand of fish, while low temperatures cause sluggishness by slowing down the digestion processes in the fish (Bailey and Alanärä, 2006). The optimal feeding rate depends on fish size and water temperature (Kestemont and Baras, 2001; Wang et al., 2009). Türker (2009) found that the digestion rate increased as the temperature increased, and that environmental temperature is one of the most important ecological factors influencing the behavior and physiological processes of aquatic animals (Xia and Li, 2010). The effects of water temperature on fish growth and development have been well documented for many species (Chatterjee et al., 2004; Larsson and Berglund, 2005). The optimum feeding rate showed the maximum growth of fish, which is affected by fish size and water temperature (De Silva and Anderson, 1995; Mizanur et al., 2014a, 2014b).
Fish growth is affected by many behavioral, physiological, nutritional, and environmental factors, but temperature is one of the most important abiotic factors affecting growth, food intake, and food conversion (Martinez et al., 1996; Azaza et al., 2008). According to Wang et al. (1998) an excessive feeding frequency enhances the opportunity for food intake and thus decreases the size variation among the fish population. When the fish are under- or overfed, feeding efficiency (FE) and growth decreases and water quality deteriorates, and these factors increase production costs (Dwyer et al., 2002). For this reason, feeding rates and frequency should be optimal, whereby the fish obtain sufficient food to result in maximum growth. Limited information is available on the optimal feedings rates and frequencies for maximum growth in the Korean rockfish at different water temperatures. Consequently, the aim of this study was to determine the optimum feeding rate and frequency for different sizes of Korean rockfish at different water temperatures.
The same commercial feed was used in all the feeding trials (Suhyup Feed Company Ltd., Uiryeong, Korea). For 5- and 16-g fish, the extruded pellet (EP) size was 2.4-2.6 mm and the feed contained 46.61% crude protein, 11.06% crude lipids, 13.94% crude ash, and 8.60% moisture, and for the 93- and 100-g fish, the EP size was 5 mm and the feed contained 52.95% crude protein, 12.14% crude lipids, 13.75% crude ash and 9.45% moisture.
>
Experimental fish and feeding trials
Korean rockfish were collected from a hatchery in the coastal city of Tongyeong and transported to the Department of Marine Biology at Pukyong National University, Busan, Korea. Prior to the start of the experiment, the fish were acclimated to the experimental diet and conditions. After acclimatization, three aquaria were used to determine satiation. Fish were fed 3 times/day to apparent satiation for a week. For satiation, the fish were fed as much as they could ingest at each feeding session. Feeding was done by hand, very slowly and carefully to ensure complete ingestion of the food. The total weight of any remaining food was subtracted from the initial weight and calculated as the percentage of satiation.
Seven feeding trials were conducted to determine the effects of feeding rate and frequency in Korean rockfish at seven different water temperatures as follows: two feeding rate experiments for 5-g Korean rockfish at 17°C and 20°C; three feeding rate experiments for 16-g Korean rockfish at 16°C, 20°C, and 24°C; and finally, two feeding frequency experiments for 93 and 100 g Korean rockfish at 15°C and 20°C.
>
Feeding rates for 5-g Korean rockfish at 17ºC and 20ºC
Three hundred sixty fish were randomly distributed into 18 tanks (20 in each tank). Fish in tanks at 17°C weighed an average of 5.5 ± 0.2 g (mean ± SD), and fish in tanks at 20°C weighed an average of 5.5 ± 0.3 g (mean ± SD). For each water temperature, triplicate tanks were randomly assigned to 1 of 6 different feeding rates: 2.8%, 3.8%, 4.1%, 4.4%, 4.7%, 4.9%, and 5.0% (satiation for both 4.9% and 5.0%) BW (body weight)/day. Fish were fed thrice daily at 7:00, 13:00, and 19:00 h, with each daily ration divided into three portions by hand and with satiation levels according to Wang et al. (2006).
>
Feeding rates for 16-g Korean rockfish at 16ºC, 20ºC, and 24ºC
After 1 week of satiation, 270 fish (15 in each tank) with initial individual BWs of 16.2 ± 0.13 g (mean ± SD) for the 16°C experiment, 16.3 ± 0.11 g (mean ± SD) for the 20°C experiment, and 16.1 ± 0.13 g (mean ± SD) for the 24°C experiment were randomly distributed into 18 aquaria. Each aquarium was then randomly assigned to 1 of the 6 feeding rates: 1.5%, 2.5%, 2.8%, 3.1%, 3.4%, and 3.7% (satiation) BW/day at 16°C; 1.9%, 2.9%, 3.2%, 3.5%, 3.8%, and 4.1% (satiation) BW/day at 20°C; and 1.7%, 2.7%, 3.0%, 3.3%, 3.6%, and 3.9% (satiation) BW/day at 24°C. Fish were fed thrice daily at 8:00, 14:00, and 20:00 h, with each daily ration divided into three portions by hand and with the satiation levels according to Wang et al. (2006). Water temperature was maintained using a water heater and cooler in the central tank during the experimental period. The water temperatures (16°C, 20°C, and 24°C) were based on annually recorded seasonal natural water temperatures of the Korean sea.
>
Feeding frequency for 93- and 100-g Korean rockfish at 15ºC and 19ºC
After the conditioning period, 270 fish (15 in each tank) with initial average BWs of 92.2 ± 0.7 g (mean ± SD) for the 15°C and 100.2 ± 0.4 g (mean ± SD) for the 19°C experiment were randomly distributed into indoor tanks. Each tank was then randomly assigned to 1 of 3 groups. Five feeding frequency groups were set up as follows: 1 meal/day at 08:00 h; 2 meals/day at 08:00 and 17:00 h; 3 meals/day at 08:00, 14:00, and 20:00 h; 4 meals/day at 08:00, 12:00, 16:00, and 20:00 h; and 1 meal every 2 days at 08:00 h. Fish were fed at the optimum feeding rate (1.0% BW/day at 15°C and 1.4% BW/ day at 19°C) except for the satiation group with feeding of 1 meal every 2 days (satiation 1.2% BW/day at 15°C and 1.5% BW/day at 19°C). The optimal feeding rates were estimated according to the quantity of food eaten that maximized growth and FE. The seawater temperature (°C) was maintained at 19.0 ± 0.5 and 15.0 ± 0.5 using a water heater and cooler in the central tank during the experimental period.
The photoperiod was fixed under natural conditions during the feeding period. The total BW of the fish in each tank was determined at the middle of the experiment, and the food was adjusted according to the increasing BW during the trial. To maintain suitable environmental conditions, siphoning was carried out twice daily and the water was changed every 2 days. The feeding trials were conducted using a semi-recirculation system in 40-L rectangular tanks for the 5- and 16-g fish and in 250-L rectangular tanks for the 93- and 100-g fish, which receiving filtered seawater at a flow rate of about 2 and 5 L/min, respectively, from the central tank. Supplemental aeration was provided to maintain dissolved oxygen levels of 6.5 ± 0.5 mg/L, and the salinity was maintained at 33 ± 1 g/L in all feeding trials. The seawater temperature was maintained using a water heater in the recirculation central tank.
>
Sample collection and chemical analyses
At the end of the feeding trials, fish were starved for 24 h before being counted and weighed. Weight gain (WG), the specific growth rate (SGR), FE, protein efficiency ratio (PER), survival, and whole-body proximate composition were measured and calculated. At the end of the feeding period, the total length and total BW were measured for five randomly selected Korean rockfish from each tank. These fish were anesthetized with MS222 at a concentration of 100 mg/L before being dissected to measure liver and visceral weight, and to determine their condition factor (CF), hepatosomatic index (HSI), and visceral somatic index (VSI). Blood samples were taken from the caudal vein of five randomly chosen fish per tank using heparinized syringes, and blood analysis was performed. Blood serum was collected after centrifugation (3000 rpm for 10 min) and stored at –70°C for hematocrit (HCT), hemoglobin (Hb), glutamic oxaloacetic transaminase (GOT), and glutamic pyruvic transaminase (GPT) analysis. HCT and Hb were measured using Drabkin’s reagent (Brown, 1980). Blood serum analyses were performed by the National Fisheries Research and Development Institute (NFRDI), Gijang-Gun, Busan, Korea, using the DRI-CHEM 4000i (Fujifilm, Tokyo, Japan) and Slide-3150 kits (Fujifilm). Whole-body proximate composition analyses were performed on the five remaining fish from each tank. The proximate composition analyses of the experimental diets and the fish were performed according to the standard methods of AOAC (1995). Moisture contentment was determined for several diet samples and the fish were dried at 105°C for 24 h to ascertain a constant weight. Ash content was determined using a muffle furnace (550°C for 4 h). Crude lipid content was determined by the Soxhlet extraction method by using the Soxtec system 1046 (Foss Analytical AB, Höganäs, Sweden) and crude protein content was measured using the Kjeldahl method (
>
Statistical analyses and calculations
A one-way analysis of variance (ANOVA) using Statistix 3.1 (Analytical Software, St. Paul, MN, USA) was performed on all data to test the dietary treatments. A least significant difference (LSD) test was used to compare the means among treatments with significant effects. Treatment effects were considered significant at
SA: Satiation (% BW/day) = [total feed weight (g)/total fish weight (g)] × 100, WG: Weight gain (%) = [(final weight – initial weight)/initial weight] × 100,SGR: Specific growth rate (% /day) = 100 × (loge final wt – loge initial wt)/days,FE: Feeding efficiency (%) = [wet WG (g)/dry feed intake (g)] × 100, PER: Protein efficiency ratio = wet WG/protein intake,CF: Condition factor = [fish weight (g) /total length (cm3)] × 100,HSI (BW/day): Hepatosomatic index = [liver weight (g) /fish weight (g)] × 100,VSI: Visceralsomatic index = [visceral weight/fish weight (g)] × 100,Pooled SEM: Pooled standard error of means, SD/√n,Survival (%): [(Number of fish at the end of the experiment)/ (number of fish stocked)] × 100.
>
Feeding rates of 5-g juvenile Korean rockfish reared at 17ºC and 20ºC
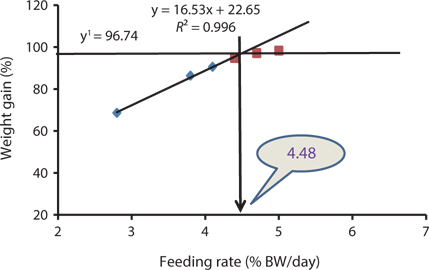
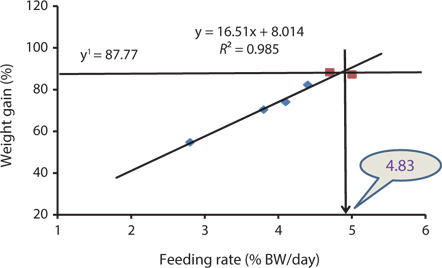
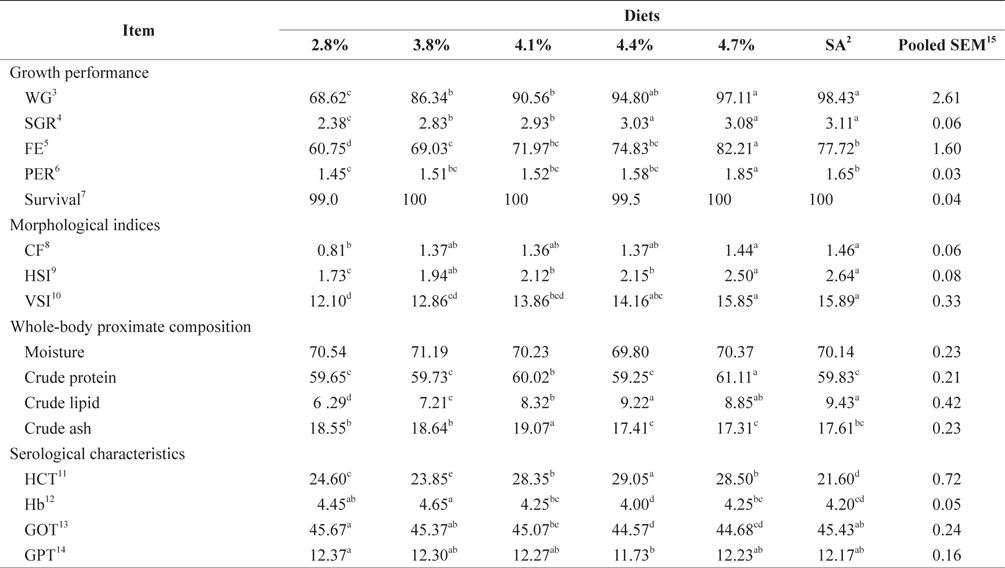
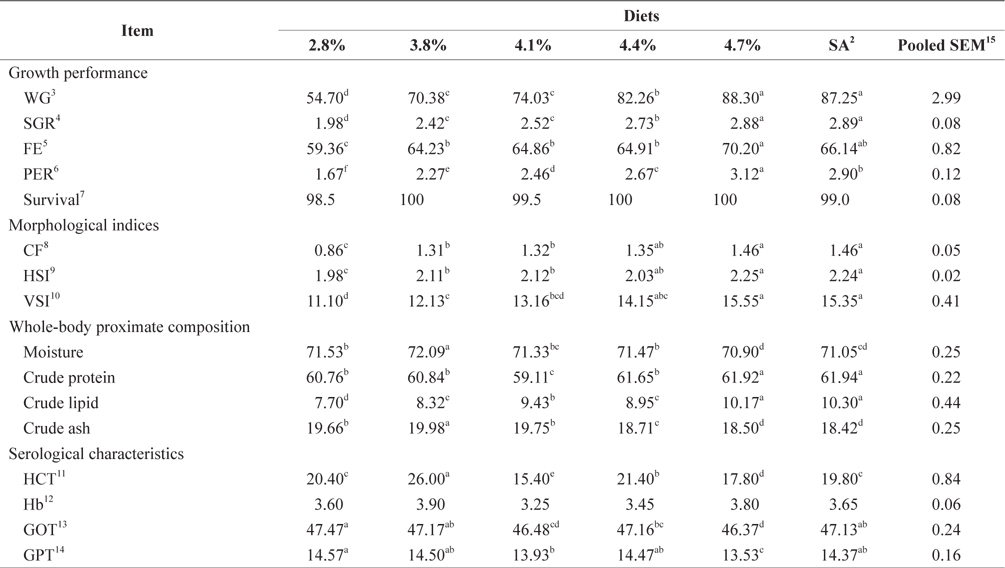
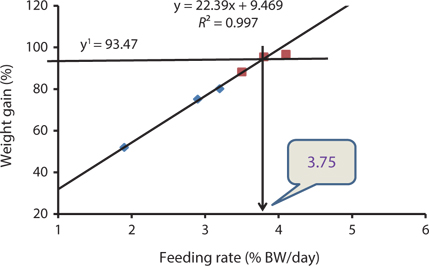
The data collected at the end of the 4-week feeding trials are shown in Tables 1 andTables 2. The WG and SGR of fish groups fed at 4.7% and to satiation (% BW/day) were significantly higher than those fish groups fed at 2.8%, 3.8%, and 4.1% (BW/day) in both experiments. No significant differences were noted in WG and SGR among fish groups fed at 3.8% and 4.1% BW/day, but the WG, SGR, FE, and PER of fish fed at 2.8% were significantly lower. No significant difference was observed in the FE in fish groups fed at 4.1% and 4.4% (BW/day) at 17 and 20°C. Broken line regression analysis of WG indicated that the optimum feeding rate was 4.48% (BW/day) at 17°C (Fig. 1) and 4.83% (BW/day) at 20°C (Fig. 2). The optimum feeding rate of growing Korean rockfish could be >4.1%, but <4.48% (BW/day) at 17°C and >4.4%, but <4.83% (BW/day) at 20°C.
Crude protein levels in fish fed at 4.7% (BW/day), crude lipids in 4.4% and at satiation (4.9% BW/day), and crude ash at 4.1% (BW/day) were significantly higher than those of other fish maintained at 17°C (Tables 1, 2). Whole-body crude protein and crude lipid of fish groups fed at 4.7% and 5.0% (satiation) BW/day were significantly higher than all other fish maintained at 20°C, while the crude lipid of fish fed group at 3.8% (BW/day) and the crude protein at 4.1% (BW/day) were significantly lower than those of fish maintained at 20°C. No clear trends were detected in whole-body crude protein, whole-body moisture, and crude ash contents of the fish in all treatments, but whole-body lipid contents increased with increasing feeding rates in both experiments.
The effects of feeding rate and water temperature on the biological indices of 5-g Korean rockfish are shown in Tables 1 and 2. The CF, HSI, and VSI of fish gradually increased with increasing feeding rates in both experiments at 17°C and 20°C. The CF, HSI and VSI of fish fed at 4.7% and to satiation (% BW/day) were significantly higher, and significantly lower in fish fed at 2.8% than those of other fish groups in both experiments. No significant differences were observed in the HSI of fish fed at 4.1% and 4.4% (BW/day) and maintained at 17°C. No significant differences were noted in the CF of fish fed at 3.8% and 4.1% (BW/day) and maintained at 20°C.

Effects of feeding rates on growth performance and body composition of 5-g Korean rockfish reared at 17°C water temperature1
At 17°C, the HCT of fish fed at 4.4% was significantly higher, and significantly lower at satiation (4.9% BW/day) compared to those of other fish groups. At 20ºC, the HCT of fish fed at 3.8% (BW/day) was significantly higher, and significantly lower for fish fed at 4.7% (BW/day) than other fish groups. At 17°C, the Hb of fish fed at 3.8% (BW/day) was significantly higher, and significantly lower for fish fed at 4.4% (BW/day) than those of other fish groups. No significant difference was detected in Hb among all the fish groups at 20°C. Serum GOT and GPT of the fish fed at 2.8% (BW/day) were significantly higher in both experiments. The GPT and GOT of fish fed at 4.4% (BW/day) and reared at 17°C, and of fish fed at 4.7% (BW/day) and reared at 20°C, were significantly lower than those of all the other fish groups (Tables 1 and Tables 2).

Effects of feeding rates on growth performance and body composition of 5-g Korean rockfish reared at 20°C water temperature1
>
Feeding rates of 16-g juvenile Korean rockfish reared at 16ºC
Biological performance data are shown in Table 3. At the end of the 4-week feeding trials at 16°C, the WG and SGR of fish groups fed at 3.4% and to satiation (3.7% BW/day) were significantly higher than those of fish fed at 1.5% and 2.5% BW/day (
Whole-body proximate composition data of juvenile Korean rockfish reared at 16°C are shown in Table 3. Whole-body CP and crude lipid content of fish groups fed at 3.4% and to satiation (3.7% BW/day) were significantly higher, and significantly lower for fish groups fed at 1.5% BW/day than for any other groups (
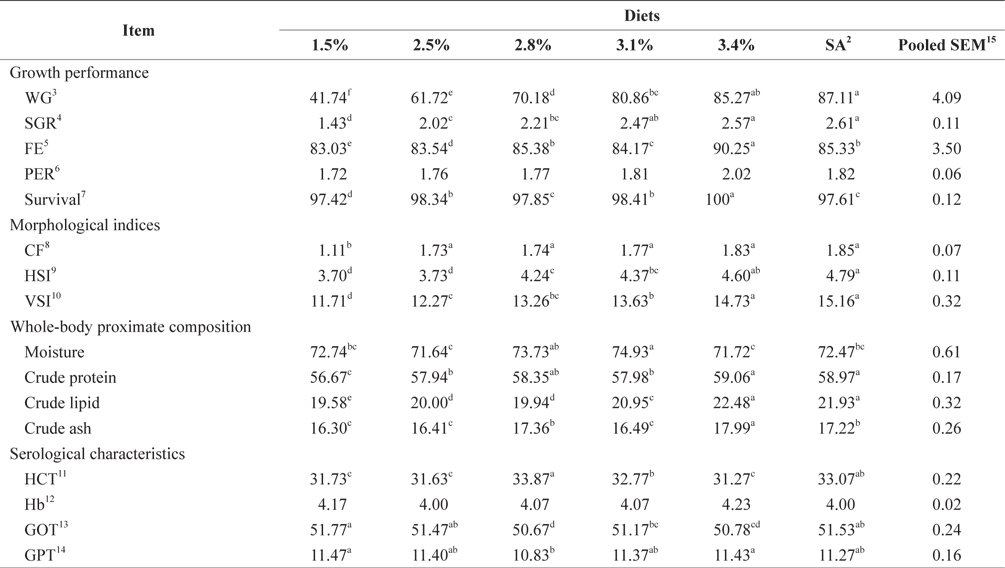
Effects of feeding rates on growth performance and body composition of 16-g Korean rockfish reared at 16°C water temperature1
>
Feeding rates of 16-g juvenile Korean rockfish reared at 20ºC
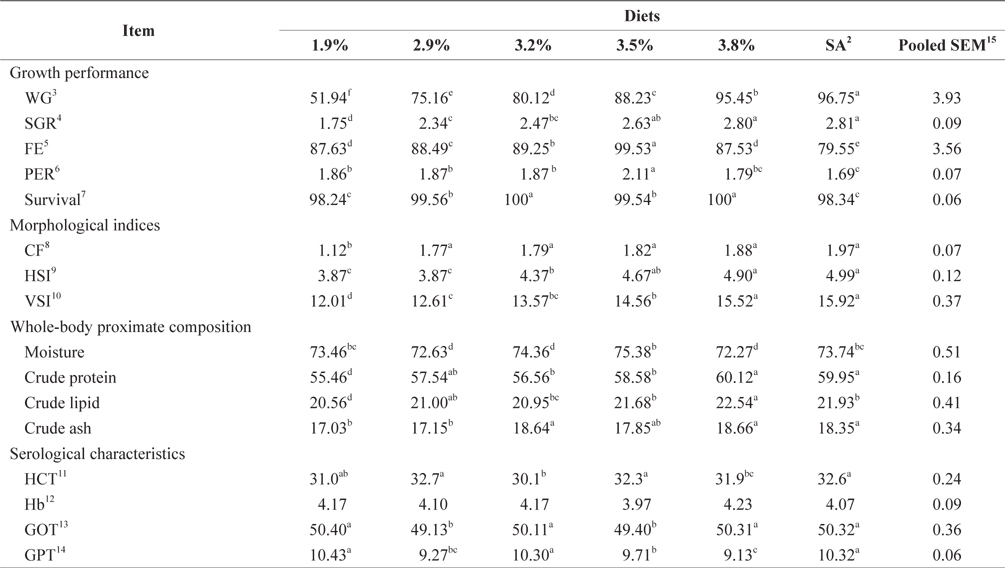
At the end of the 4-week feeding trials at 20ºC, the WG and SGR of fish groups fed at 3.8% and to satiation (4.1% BW/day) were significantly higher than those of fish groups fed at 1.9% and 2.9% (
Effects of feeding rates on growth performance and body composition of 16-g Korean rockfish reared at 20°C water temperature1
Whole-body proximate composition and morphological indices of 16-g juvenile Korean rockfish fed a commercial diet at 20°C are shown in Table 4. Whole-body CP and crude ash content of fish groups fed at 3.8% and satiation (4.1% BW/ day) were significantly higher, and those of fish fed at 1.9% was significantly lower than in other groups. The crude lipid of fish fed at 1.9% BW/day was significantly lower, and significantly higher for fish fed at 3.8% than for the other groups (
Serological characteristics of 16-g juvenile Korean rockfish reared at 20°C are shown in Table 4. The HCT of the fish fed at 3.2% (BW/day) was significantly lower than in other fish groups. No significant differences were detected in the HCT levels of fish in the groups fed at 2.9%, 3.5%, and to satiation (4.1% BW/day), but they were significantly higher than in the other fish groups. No significant differences were seen in the Hb level of fish in all the treatments. However, the serum GOT and GPT of the fish fed at 1.9%, 3.3%, and to satiation (4.1% BW/day) were significantly higher in the juvenile Korean rockfish.
>
Feeding rates of 16-g Juvenile Korean rockfish reared at 24ºC
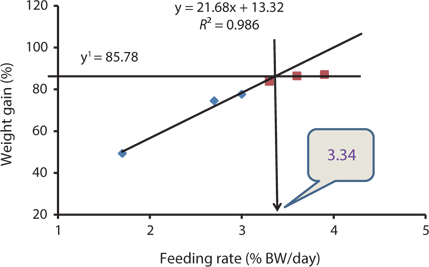
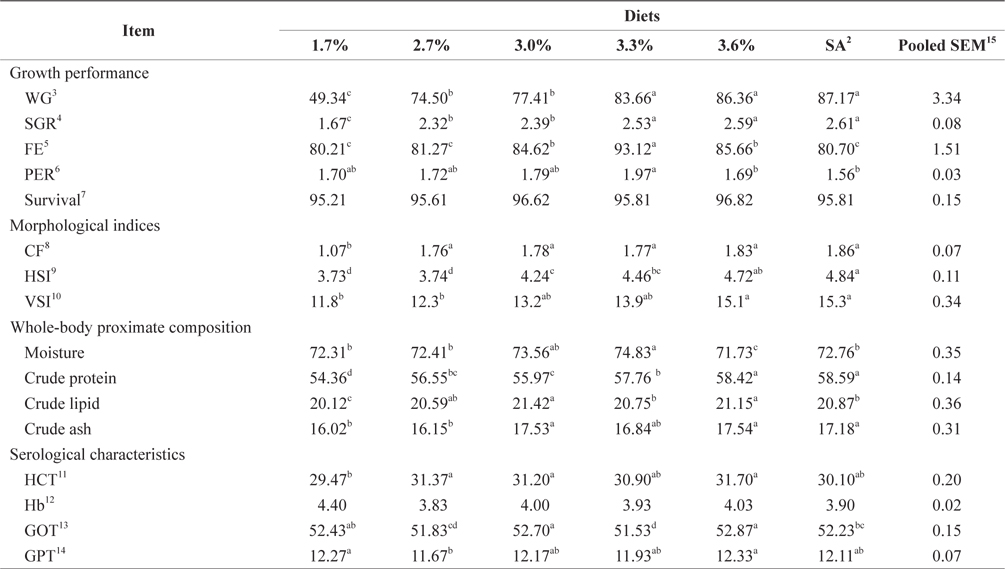
At the end of the 4-week feeding trials at 24°C, the WG and SGR of fish fed at 3.3%, 3.6%, and 3.9% (satiation) BW/day were not significantly different, but they were significantly higher than for fish fed at 1.7%, 2.7%, and 3.0% (
Morphological indices and serological characteristics of 16-g juvenile Korean rockfish reared at 24°C are shown in Table 5. The CF, HSI, and VSI of the fish gradually increased with an increased feeding rate. The HSI of the satiation group (3.9% BW/day) and the VSI of the fish fed at 3.6% and to satiation were significantly higher than in the other groups. No significant differences were noted in the HSI and VSI of fish groups fed at 1.7% and 2.7% (BW/day), but they were significantly lower than in the other groups. However, the VSI of fish fed at 3.0% and 3.3% showed no significant difference (

Effects of feeding rates on growth performance and body composition of 16-g Korean rockfish reared at 24°C water temperature1
>
Feeding rates of 93-g Korean rockfish reared at 15ºC
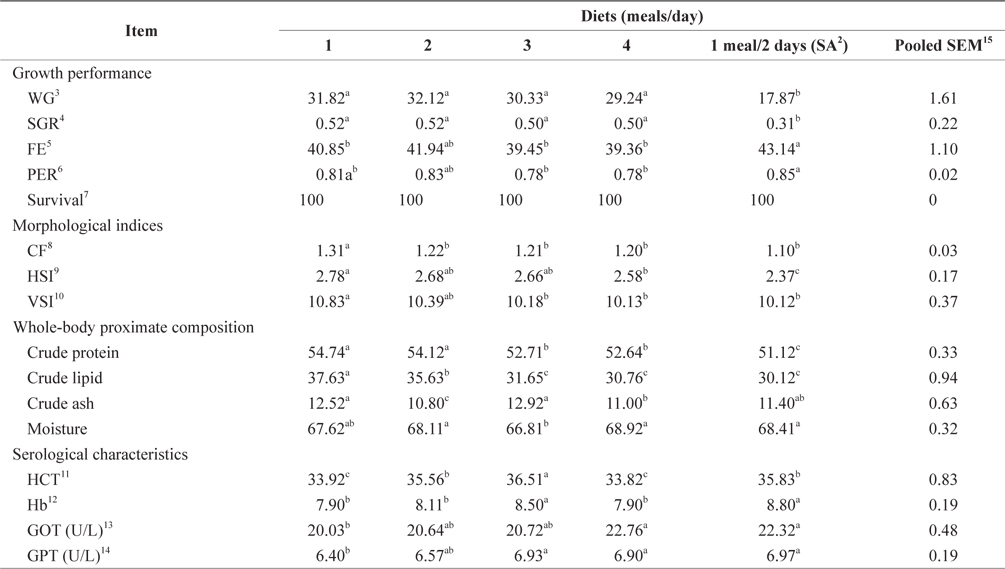
The WG, SGR, FE, and PER of 93-g Korean rockfish reared at 15ºC are shown in Table 6. WG was significantly affected by feeding frequency. At the end of the 8-week feeding trial, the WG and SGR of the fish groups fed 1 and 2 meals/day were significantly higher than those of the other feeding groups (P < 0.05). No significant differences were observed in WG and SGR for fish groups fed 3 and 4 meals/day and 1 meal every 2 days. The FE and PER of fish fed 1 meals/day, 2 meals/day, and 1 meal every 2 days were significantly higher than for fish fed 3 and 4 meals/day. However, no significant differences were detected in FE and PER for fish fed 3 and 4 meals/day. Survival rates were not affected by the feeding frequency.
The effects of feeding frequency on the fish morphological indices for 93-g Korean rockfish reared at 15ºC are shown in Table 6. These were significantly affected by feeding frequency. The CF, HSI, and VSI were significantly higher at 2 meals/day and significantly lower for fish fed 1 meal every 2 days. The CF at 1 and 2 meals/day and the VSI at 2 meals/day were significantly higher than in all the other groups. CF gradually decreased as the feeding frequency increased. However, no significant differences were noted in CF among fish fed 1 and 2 meals/day. HSI levels were also not significantly different for fish fed 2, 3, and 4 meals/day, but they were significantly higher than in the other groups. Whole-body protein and lipid contents were significantly higher at 1 meals/day and significantly lower for fish fed 4 meals/day and 1 meal every 2 days (Table 6). A clear trend was noted in the feeding frequency and whole-body crude protein and crude lipid, which gradually decreased with an increase in feeding frequency. Whole-body moisture and crude ash content of the fish were significantly higher for fish fed 2 meals/day, but comparatively lower for fish fed 4 meals/day.

Effects of feeding rates on growth performance and body composition of 93-g Korean rockfish reared at 15°C water temperature1
The HCT of fish fed 1 meals/day was significantly higher than in the other fish groups (Table 6). No significant differences were seen in HCT levels for fish fed 2 and 4 meals/day and 1 meal every 2 days. Hb was not significantly different in any of the groups. Feeding frequency did not affect HCT and Hb levels at all the feeding rate and frequency experiments. GOT and GPT were significantly affected by feeding frequency; the GPT and GOT of fish fed 1 meal every 2 days were significantly higher, and significantly lower for fish fed at 1 and 2 meals/day than in all the other groups. GOT and GPT increased with an increase in feeding frequency. No significant difference was found in GPT for the fish fed 3 and 4 meals/day or for GOT levels of fish fed 1 and 2 meals/day.
>
Feeding rates of 100-g Korean rockfish reared at 19ºC
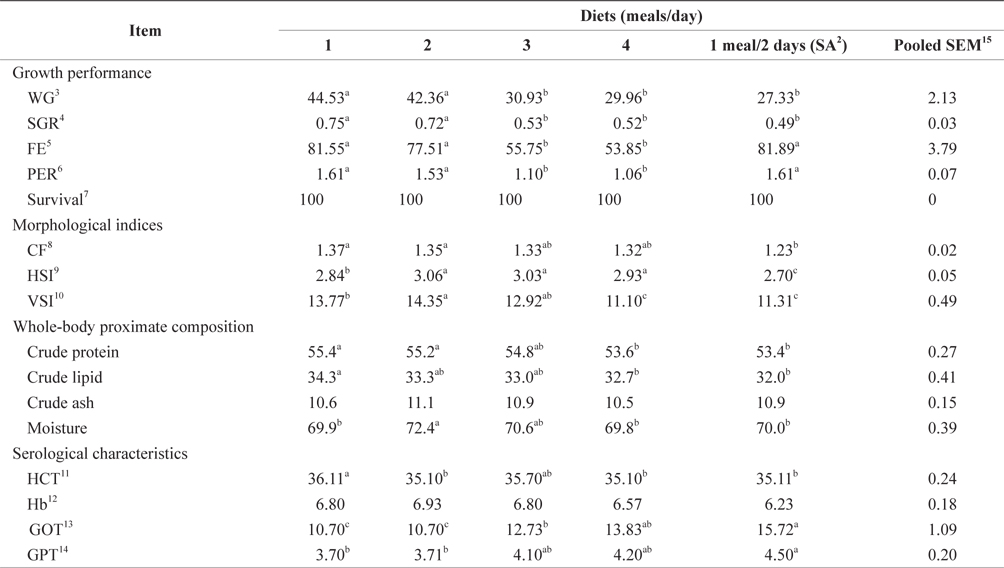
The WG, SGR, FE, and PER of 100-g Korean rockfish reared at 19°C are shown in Table 7. WG was significantly affected by feeding frequency. At the end of the 8-week feeding trial, WG and SGR of fish fed 1 meal every 2 days was significantly lower than in the other groups (
The morphological indices were significantly affected by feeding frequency (Table 7). The CF, HSI, and VSI of fish fed 1 meal/day were significantly higher, and significantly lower for fish fed 1 meal every 2 days, than in the other fish groups. The CF, HSI, and VSI gradually decreased with an increase in feeding frequency. However, HSI was not significantly different in any of the groups. Whole-body protein and lipid contents were significantly higher at 1 meals/day and significantly lower at 4 meals/day (Table 7). Whole-body crude protein and crude lipid decreased gradually with an increase in feeding frequency from 1 to 4 meals/day. However, this was not the case for whole-body moisture and crude ash contents; whole-body moisture was significantly lower for fish fed 3 meals/day, and crude ash content was significantly lower for fish fed 2 meals/day, than in the other fish groups.
Effects of feeding rates on growth performance and body composition of 100-g Korean rockfish reared at 19°C water temperature1
The HCT of fish fed 3 meals/day and Hb of fish fed 1 meal every 2 days were significantly higher than in the other groups (Table 7). No significant differences were found in the HCT levels of fish fed 1 and 4 meals/day, and Hb was also not significantly different in fish fed 3 meals/day and 1 meal every 2 days. GOT and GPT were significantly affected by the feeding frequency. GOT and GPT increased with an increase in feeding frequency. Serum GOT and GPT of fish fed 1 meals/day was significantly lower and significantly higher for fish fed 4 meals/day and 1 meal every 2 days. No significant difference was detected in the GOT for fish fed 2 and 3 meals/day, but the GPT of fish fed at 1, 3, and 4 meals/day was significantly higher.
>
Feeding rates of 5-g Korean rockfish reared at 17ºC and 20ºC
WG and SGR increased with increased feeding rates, up to satiation, in the 17°C and 20°C experiments. FE and PER also increased with increased feeding rates up to the optimum level. In this study, fish were not able to utilize additional food beyond the peak feeding rate, leading to a drop in FE and PER (Tables 1 and 2), which agrees with previous results for a 5-g juvenile olive flounder (Okorie et al., 2013). Fish tend to optimize their digestion to extract nutrients more efficiently at lower feeding rates (Van Ham et al., 2003). In this study, an ANOVA indicated that the optimum feeding rates in 5-g Korean rockfish were below satiation levels, and this agreed with the optimum feeding rates in the juvenile olive flounder, which were also below satiation feeding levels (Cho et al., 2006; Kim et al., 2007). The rate of WG of 5-g Korean rockfish at 17°C was relatively higher than at 20ºC (Tables 1 and 2). The maximum WG in Nile tilapia occurred at an optimum water temperature (Workagegn, 2012; Gienger et al., 2013). We found no clear trends in whole-body crude protein, ash, and moisture content, but the lipid contents increased with an increase in feeding rates. Wang et al. (2007) reported increased moisture levels and ash contents with a corresponding decrease in the lipid contents and feeding rate in the cuneat drum
Cho et al. (2006) observed no significant differences in serum glucose, total protein, or GPT in olive flounder fed EPs at different feeding rates. Furthermore, serum total protein, glucose, and GPT of the olive flounder were not significantly affected by feeding rates, while the GOT fluctuated (Cho et al., 2007). At 17°C, the HCT of fish fed at the optimum level of 4.4% (BW/day) was significantly higher, but significantly lower at satiation (4.9% BW/day), possibly caused by a variation in feed assimilation of the fish. Our experiments show that serum GPT and GOT in fish fed at the lowest feeding rate of 2.8% (BW/day) were significantly higher than in the other groups (Tables 1 and 2) because the fish probably endured stress as a result of being underfed. Under stressful and unfavorable conditions, GPT and GOT can increase in the blood serum. These serological results indicate that 17°C may be a favorable water temperature for maximum growth of Korean rockfish.
Our study showed that growth performance of 5-g Korean rockfish was affected by feeding rates and water temperature. The WG and SGR of fish fed to satiation and at 4.7% (BW/ day) were significantly higher than those of the other fish groups. However, WG, SGR, and FE were comparatively higher, and serum GPT and GOT contents were comparatively lower at 17°C than at 20°C (Tables 1 and 2). HSI, CF, and VSI increased with an increase in feeding rates. Moreover, HSI and CF were higher at 17°C than at 20°C. Broken line regression analysis of WG indicated that the optimum feeding rate for growing Korean rockfish was 4.48% (BW/day) at 17°C and 4.83% (BW/day) at 20°C (Figs. 1 and 2). Therefore, the optimum feeding rates could be >4.1%, but <4.48%, at 17°C, and >4.4%, but <4.83%, at 20°C for growing Korean rockfish. The WG results and the serological characteristics and biological indices suggest that 5-g Korean rockfish perform better at a water temperature of 17°C than at 20°C.
>
Feeding rates of 16-g Korean rockfish reared at 16ºC, 20ºC, and 24ºC
Three feeding trial experiments at 16°C, 20°C, and 24°C were conducted to determine the effects of feeding rate and water temperature on biological performance, morphological indices, whole-body proximate composition, and serological characteristics of juvenile Korean rockfish. WG and SGR increased with increasing feeding rates up to the satiation level, although the improvement rates were different in the feeding trials. In this study, FE and PER also increased with increased feeding rates up to the optimum level, while feed utilization plateaued at a certain feeding rate in all of the trials. FE and PER increased gradually but a drop occurred after a peak had been reached in all experiments (Tables 3 and 5). The fish increased in weight continuously with increasing feeding rates up to satiation at 16°C, 20°C, and 24°C, although the weight increase did not always correspond to an incremental food consumption. A continuous WG with an increased feeding rate has been recorded in the white sturgeon
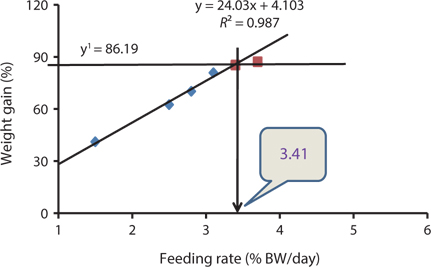
Our results indicated that the optimum feeding rates of 16-g juvenile Korean rockfish were below the satiation levels, which has also been found in European sea bass (Eroldogan et al., 2004), juvenile olive flounder (Kim et al., 2007), and juvenile Korean rockfish (Mizanur et al., 2014a, 2014b). In our study, the optimum range of feeding rates at 16°C, 20°C, and 24°C were 3.1-3.41% BW/day, 3.5-3.75% BW/day, and 3.0-3.34% BW/day, respectively. In the experiments at 16°C, 20°C, and 24°C, the growth rate of the 16-g Korean rockfish was relatively higher at 20°C. Also, the upper lower optimum water temperatures significantly affected the growth, survival, and FE of the Nile tiapia
The HSI and CF levels may provide information on growth, physical condition, energy reserves, and ability of fish to tolerate environmental stresses. In poor, stressful, and unfavorable environments, fish usually have smaller livers, and are thus not able to store as much energy in the liver. In this study, HSI, VSI, and CF increased with an increase in feeding rate in all of the experiments. These results were the same as those in a previous study (Mizanur et al. 2014a). HSI is a good compensatory growth index in the olive flounder (Cho, 2005) and the juvenile black rockfish (Oh et al., 2008). HSI and CF in the largescale tonguesole
The plasma transaminase enzymes aspartate aminotransferase (AST) and alanine aminotransferase (ALT) are found not only in the liver but also in red blood cells, heart cells, muscle tissue, the pancreas, and the kidneys (Huang et al., 2006). AST and ALT are also known as GOT and GPT, respectively. No clear trends were observed in Hb, HCT, and serum GOT and GPT of juvenile Korean rockfish fed a commercial diet at different feeding rates at 16°C, 20°C, and 24°C. Serum GPT and GOT levels of 20-g olive flounder were not affected by different feeding treatments (Okorie et al., 2013). No significant differences were detected in serum glucose, total protein, or GPT of the olive flounder fed EPs at different feeding rates (Cho et al., 2006). Furthermore, serum total protein, glucose, and GPT of the olive flounder were not significantly affected by feeding rates, whereas GOT did fluctuate, as reported by Cho et al. (2007). Our results indicated that serum GPT and GOT in the groups of fish fed at the lowest feeding rates of 1.5% at 16°C, 1.9% at 20°C, and 1.7% at 24°C were slightly higher in the other groups (Tables 3 and 5), probably due to the fish being in a state of stress due to underfeeding. Under stressful and unfavorable environmental conditions, GPT and GOT may increase in the blood serum. In this study, serum GPT and GOT levels were affected by the different water temperatures; serum GPT and GOT levels in fish fed at 20°C were comparatively lower than those of fish fed at 16°C and 24°C (Tables 3 and 5). These results indicated that 20°C may be a favorable water temperature for enhanced growth of 16-g juvenile Korean rockfish.
Whole-body proximate compositions of the Korean rockfish were also determined to evaluate the optimum temperatures and feeding rates. Lipids accumulated with an increase in feeding rate at 16°C, although this trend was not seen in the other groups in all of the experiments. Normally, lipid levels increased in fish with an increase in feeding rate, while moisture and ash levels decreased (Abdelghany and Ahmad, 2002).
Survival rates were not significantly affected by the different feeding rates, but the survival rates at the lowest feeding rates at 16°C and 20°C were significantly lower. Survival rates could have been affected by the different water temperatures because the survival rate at 20°C was significantly higher than at 16°C and 24°C. An ANOVA indicated that the optimum FE and PER could be achieved at a feeding rate below satiation levels. Our results indicated that the WG and SGR in fish fed to satiation and 3.4% at 16°C, fish fed to satiation and 3.8% groups at 20°C, and fish fed to satiation and 3.6% groups at 24°C were significantly higher than in the other groups.
Our results demonstrate that the growth performance of 16-g juvenile Korean rockfish was affected by feeding rates and water temperature. The HSI, CF, and VSI increased with an increase in feeding rates in all of the experiments. Broken line regression analysis of the WG showed that the optimum feeding rates of juvenile Korean rockfish were 3.41% (BW/day) at 16°C (Fig. 3), 3.75% (BW/day) at 20°C (Fig. 4), and 3.34% (BW/day) at 24°C (Fig. 5). Therefore, the optimum feeding rates could be >3.1%, but <3.41%, at 16°C, >3.5%, but <3.75%, at 20°C, and >3.0%, but <3.34%, at 24°C. The results from the 16°C, 20°C, and 24ºC experiments, along with the biological performance, morphological indices, serological characteristics, and survival rates indicated that 16-g juvenile Korean rockfish performed better at 20ºC than at 16°C or 24°C.
>
Feeding rates of 93 and 100-g Korean rockfish reared at 15 and 19ºC
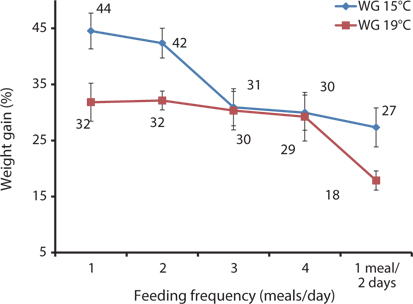
In this study, WG and SGR at 1 and 2 meals/day were significantly higher than in the other groups at 15°C, and in fish fed 1 meal every 2 days (1 meal/2 days), they were significantly lower at 15°C and 19°C. WG and SGR decreased with an increase in feeding frequency at both temperatures (Tables 6 and 7). Growth performance was comparatively higher at 15°C than at 19°C (Fig. 6), probably because 93-g Korean rockfish grew better at 15°C than the 100-g fish reared at 19°C. However, the higher growth could also have occurred because smaller fish can grow faster than bigger fish. Fish growth was not significantly enhanced by increasing the number of meals from 2 to 4 meals/day; when the feeding frequency was higher or the intervals between meals were shorter, food passed through the digestive tract more quickly, resulting in less effective digestion. Here, our findings agreed with previous research findings reported by Van Ham et al. (2003), Riche et al. (2004), and Biswas et al. (2010). The FE and PER decreased with an increase in feeding frequency from 2 to 4 meals/day. The FE and PER of fish fed 1 and 2 meals/day were significantly higher than fish fed 3 and 4 meals/day because fish tended to optimize their digestion to extract nutrients more efficiently at the optimum feeding rate (Van Ham et al., 2003). Feed consumption and growth increased linearly with an increase in the feeding frequency up to a certain level in juvenile black sea turbot (Aydin et al., 2011). In general, increasing the feeding frequency results in an escalation in food consumption in juvenile Nile tilapia (Riche et al., 2004) and juvenile turbot (Türker, 2006). Overfeeding not only reduces the feed conversion efficiency, but also results in the accumulation of waste that adversely affects the water quality (Biswas et al., 2006). Aydin et al. (2012) found that the feed conversion ratio did not change according to the feeding frequency in juvenile black sea flounder. In a previous study, we reported that fish could not efficiently utilize additional feeds above the optimum feeding levels, leading to the drop in FE and PER in juvenile Korean rockfish (Mizanur et al., 2014a) and also in the juvenile olive flounder (Okorie et al., 2013).
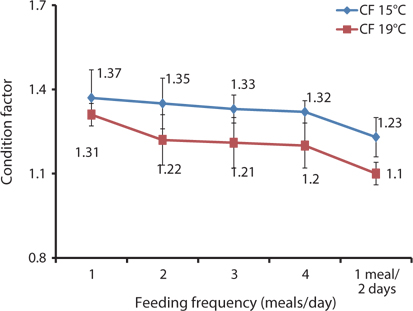
HSI, VSI, and CF can provide information on growth, physical condition, energy reserves, and the ability of fish to tolerate environmental stresses. In poor, stressful, and unfavorable environments, fish usually have smaller livers and can reserve limited energy in the reduced livers. In this study, the morphological indices were significantly affected by feeding frequency. The CF, HSI, and VSI biological indices were significantly higher for the group fed 2 meals/day at 15°C and 1 meal/day at 19°C, while the CF and HSI were comparatively higher at 15°C than at 19°C (Fig. 7, Tables 6 and 7). The CF, HSI, and VSI gradually decreased with an increase in feeding frequency, which was likely due to environmental pollution resulting from a higher feeding frequency, whereby the fish were not able to fully digest all of the food. The CF, HSI, and VSI of the 1 meal every 2 days group were significantly lower than in all the other groups because the fish were most likely continually hungry and suffered stress as a result of underfeeding. Oh et al. (2008) described how HSI provided a good compensatory growth index in juvenile black rockfish.
The whole-body proximate composition of the Korean rockfish was determined to ascertain the optimum feeding frequency at two different water temperatures. Whole-body protein and lipid contents were significantly higher at 1 meal/day and significantly lower at the 4 meals/day in both experiments. A clear relationship was observed between feeding frequency and whole-body crude protein and crude lipid content. Crude protein and crude lipid decreased with an increase in feeding frequency. Similar results were seen in turbot (Van Ham et al., 2003). The lipid content in fish is related to dietary energy levels, indicating that excess dietary energy is not utilized in fish growth, but rather that it is deposited as lipids (Lee and Pham, 2010). Moreover, less energy was used in the competition for food and the avoidance of cannibalism because of the plentiful food at the higher feeding frequencies, resulting in more protein and lipids being deposited in the fish body (Xie et al., 2011). In this study, the crude lipid and protein contents of fish fed 1 meal every 2 days were lower than in the other groups. As a lower feeding frequency required more energy to compete for limited food and to avoid cannibalism, this could have accelerated the metabolism of proteins and lipids.
Some of the findings in this study are in contrast with previous research findings; e.g., the whole-body crude protein and crude lipid contents increased with an increase in feeding frequency in juvenile red spotted grouper (Kayano et al., 1993: Yao et al., 1994) and in juvenile Korean rockfish (Lee et al., 2000). This is most likely because those studies used juvenile or larval stages of fish, which have a high digestive power. Also, for optimum growth of juvenile or larval fish, a higher feed frequency is required than that for growing or larger fish (NRC, 2011).
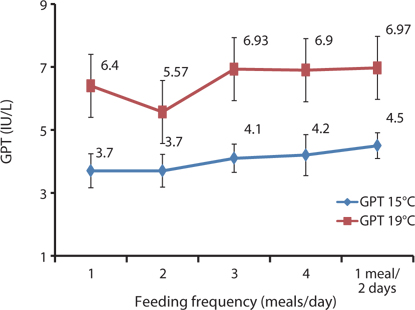
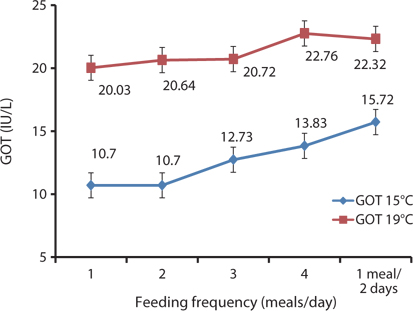
In this study, the serological characteristics of growing Korean rockfish were affected by the different feeding frequencies. Serum GPT and GOT increased with an increase in feeding frequency in both experiments at 15°C and 19ºC. GPT and GOT were comparatively lower at 15°C than at 19°C (Figs. 8 and 9). The environmental temperature is one of the most important ecological factors that influence the behavior and physiological processes of aquatic animals (Xia and Li, 2010). Serum GPT and GOT of fish fed 1 meal every 2 days were significantly higher, while they were significantly lower in fish fed 1 meal/day in both experiments, which may have occurred because the Korean rockfish were continually hungry and under stress in the 1 meal every 2 days group. Generally, under stressful and unfavorable environmental conditions, GPT and GOT increase in the blood serum. Serum GPT and GOT increased with a decrease in the feeding rations in juvenile Korean rockfish (Mizanur et al., 2014b) and olive flounder (Cho et al., 2007), most likely due to stress induced by underfeeding.
The optimal feeding frequency for maximum growth of fish varies depending on the fish species, size, and growth conditions (Cho et al., 2003). Fish size is the most important factor to determine the optimum feeding frequency. Generally, mature fish need to be fed less frequently and a lower amount of feed per feeding (NRC, 2011). We found no significant difference in the WG among the fish groups fed 1, 2, 3, and 4 meals/day, but it was significantly higher than in those fed 1 meal every 2 days. We determined that the most cost-effective feeding frequency in terms of labor and food would be 1 meal/day for growing Korean rockfish. Seo and Lee (2008) found that the WG of juvenile Korean rockfish fed to satiation once daily was higher than that of fish fed once every 2 days, or twice daily. A feeding frequency of 1 meal/day until satiation is best for increasing the WG in juvenile Korean rockfish, as described by Lee et al. (2000). WG and CF were comparatively higher, and GPT and GOT were comparatively lower at 15°C than at 19°C, indicating that growing Korean rockfish of 93- and 100-g weight perform better at a water temperature of 15°C than 19°C.
This study showed the effects of feeding rates and frequencies on growth performance and body composition of different sizes of Korean rockfish reared at different water temperatures. The WG and SGR of the fish groups fed at the optimum and satiation levels were significantly higher than those of other groups, while WG, SGR, FE, HSI, and CF showed better growth at 17°C than at 20°C (Tables 1 and 2). The HSI, CF, and VSI increased with an increase in feeding rate in all of the experiments.
Broken line regression analysis of WG indicated that the optimum feeding rates of 5-g growing Korean rockfish were 4.48% (BW/day) at 17°C and 4.83% (BW/day) at 20°C (Figs. 1 and 2). Therefore, the optimum feeding rate could be >4.1%, but <4.48%, at 17°C and >4.4%, but <4.83%, at 20°C for 5-g juvenile Korean rockfish. Broken line regression analysis of WG suggested the optimum feeding rates of 16-g juvenile Korean rockfish were 3.41% (BW/day) at 16°C (Fig. 3), 3.75% (BW/day) at 20°C (Fig. 4), and 3.34% (BW/day) at 24°C (Fig. 5). Therefore, the optimum feeding rates of 16-g Korean rockfish were >3.1%, but <3.41%, at 16°C, >3.5%, but<3.75%, at 20°C, and >3.0%, but <3.34%, at 24°C. The biological performance, morphological indices, and serological characteristics results showed that the most economic feeding frequency for increased WG in growing Korean rockfish grown from 93 to 133 g at 15°C, and 100 to 132 g at 19°C, is 1 meal/day. The feeding frequency results indicate that growing Korean rockfish of 93- and 100-g perform better at 15°C.
In the 5-g juvenile Korean rockfish, the serum GPT and GOT of the different fish groups fed at 17°C were comparatively lower than those of fish groups fed at 20°C. However, the WG and SGR of the 16-g size of Korean rockfish were comparatively higher, and serum GPT and GOT were comparatively lower at 20°C than at 16°C or 24°C. In the feeding frequency experiments for 93- and 100-g Korean rockfish, WG and CF were comparatively higher, and GPT and GOT were comparatively lower at 15°C than at 19°C (Figs. 6 and 9). Serum GPT and GOT gradually increased with a decrease in the feeding rate in all of the experiments. Generally, under stressful and unfavorable environmental conditions, GPT and GOT increase in the blood serum. Similarly to the WG results, the serological characteristics and biological indices show that 5-, 16-, and 93- to 100-g weight Korean rockfish growth better at water temperatures of 17°C, 20°C, and 15°C respectively.