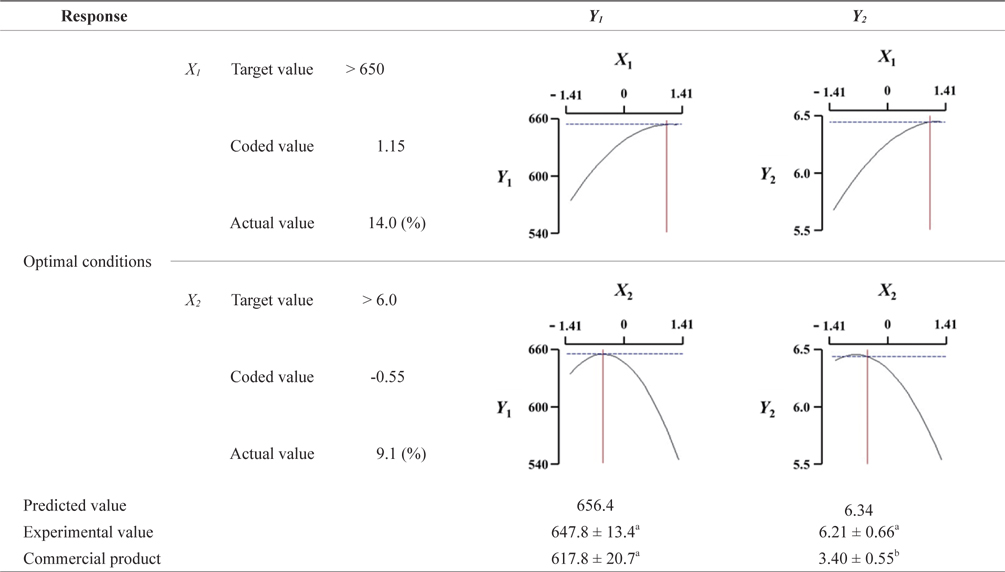
Surimi (or fish paste) products are one of the most representative processed seafoods in Korea. In a previous study, we evaluated the potential use of rice flour as an agent to replace wheat flour in surimi products. In this study, we optimized the content of rice flour and water in surimi products using response surface methodology. Rice flour content (X1, w/w) and water content (X2, v/w) were chosen as independent variables and gel strength (Y1) and overall acceptance (Y2) as dependent variables. Optimal conditions of X1 and X2 were 14% and 9.1%, respectively, and the predicted values of the multiple response optimal conditions were Y1 = 656.4 (g·cm) and Y2 = 6.34. Under optimal conditions, the experimental values of Y1 and Y2 were 647.8 (g·cm) and 6.21, respectively, which were similar to the predicted values. Surimi products that are prepared under optimum conditions were similar in gel strength to those of commercial products. However, its sensory evaluation score was higher than that of the commercial products. In conclusion, rice flour can not only be used as an alternative to wheat flour, but it also can be used to improve the quality of surimi products.
Surimi (or fish paste) products are the most representative processed fishery foods. They are widely used because their cooking is simple and inexpensive. In addition, surimi products can easily change the shape, taste, and texture of the final product as per consumer preferences (Kim et al., 2005). In South Korea, the most popular surimi product is the fried type, which is traditionally mixed with vegetables (Park, 2005a; Choi et al., 2012). Currently, most surimi products are prepared using starch or wheat flour as an ingredient. Unfortunately, the price of wheat flour has increased and consumers were required high-quality products. Therefore, there is a need to come up with a cheaper alternative to replace wheat flour. Recently, rice flour was highlighted as a possible alternative to wheat flour (We et al., 2011).
Rice is the major staple crop of nearly half of the world’s population, and is particularly important in Asia, where approximately 90% of the world’s rice is produced and consumed (Zeigler and Barclay, 2008; Khush, 2004; Lee, 2012). However, rice consumption in South Korea has decreased sharply owing to westernization of diet and increasing popularity of instant foods (Cha, 2010; Statistics Korea, 2011). Most rice are consumed after simple cooking and therefore the South Korean food industry is exploring the use of rice in new foods, both for domestic consumption and for export purposes (Shin, 2009). The rheological properties and manufacturing process of surimi products containing different starches or functional powders, such as potato (Yang and Park, 1998; Tabilo-Munizaga and Barbosa-Canovas, 2005; Chung and Lee, 1996), waxy corn (Alvarez et al., 1997), wheat (Kong et al., 1999), red ginseng (Shim et al., 2012),
Golden threadfin bream (
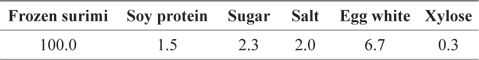
[Table 1.] Ingredients (??) of the preparation of surimi products containing rice flour

Ingredients (??) of the preparation of surimi products containing rice flour
>
Preparation of the surimi product containing rice flour
Frozen surimi was partially thawed for 1 h at room temperature, to allow the core temperature to reach approximately -5℃. The thawed surimi was then cut into cubes (5 × 5 × 5 cm) and placed in a chopping bowl. The sample was chopped further at 1500 rpm for 5 min by a silent cutter (OMF-500, Ohmichi Co., Ltd., Maebashi, Japan). Two percent salt was added and the sample chopped for another 5 min at 1500 rpm. Rice flour was added slowly until homogenization of the mixture. The other ingredients were then added to the homogenized mixture according to the amounts listed in Table 1 and 168mixed for 3 min by the silent cutter. The formulation of Table 1 was selected because it is a general combination of ingredient for the production of commercial surimi products. During the chopping and mixing procedure, the temperature was maintained at approximately 5℃ by crushed ice bath. After molding of the mixture, it was fried in soybean oil for 3 min at 150℃. All samples were then vacuum-packed and stored at 4℃.
>
Determination of gel strength
Breaking force and deformation of the surimi product was measured by a puncture test using a TA-XT2 texture analyzer (Stable Micro Systems, Surrey, UK) equipped with a 0.25-inch spherical stainless probe. When the gel sample lost its strength and ruptured at a crosshead speed of 1.0 mm/s, the breaking force and depth of depression were recorded. Ten cylindrical samples with a length of 2.5 cm were subjected to the test. Gel strength was calculated using the following formula: Gel strength (g·cm) = breaking force (g) × depth of depression (cm).
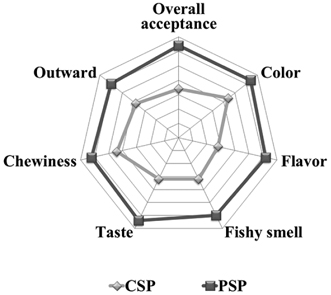
A trained panel comprising 20 members of the Korea Food Research Institute determined the organoleptic characteristics of the sample. The outward appearance, color, flavor, taste, chewiness, hardness, and overall acceptance were evaluated by a 7-point Likert scale (1 = extremely dissatisfied, 7 = extremely satisfied).
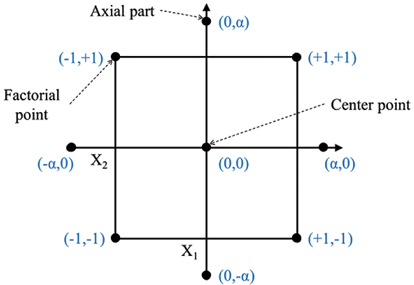
Central composite design (CCD) (Box and Wilson, 1951) was adopted in the optimization of rice flour and water content proportions in surimi products (Fig. 1). CCD matrix consists of 22 factorial points, 4 axial points (α = 1.414) and 3 center points. Rice flour content (

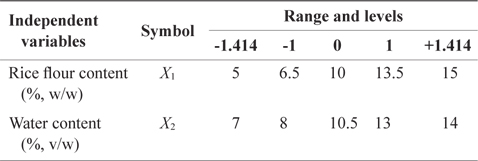
Experimental range and values of the independent variables in the central composite design for preparation of surimi products containing rice flour

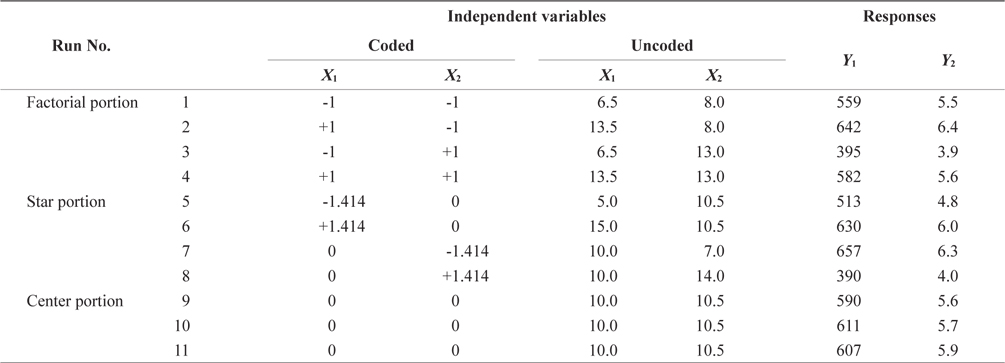
Central composite design and responses of the dependent variables for preparation of the surimi products containing rice flour
>
Analysis of data and optimization
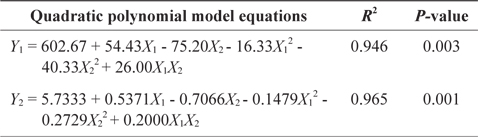
For the response surface regression procedure, MINITAB software version 14 (Minitab Inc., Harrisburg, PA, USA) was used to fit the following quadratic polynomial equation:
where Y is the dependent variable (gel strength and overall acceptance), β0 is a constant, βi, βii and βij are regression coefficients and Xi, Xj are the levels of the independent variables. The DVs,
Statistical analyses of data were performed using SPSS software Version 13 (SPSS Inc., Chicago, IL, USA). Results were presented as average and standard deviations. Tukey’s multiple range test was carried out with one-way analysis of variance (ANOVA) to determine the significance of the differences in the mean among treatments. The significance level was set at
>
Diangostic checking of the fitted models
Response surface methodology (RSM) is a useful statistical technique that has been applied to optimize formulations in various food products (Murphy et al., 2004). This methodology reduces the number of experimental runs required to generate sufficient information in order to provide a statistically acceptable result (Fogaça et al., 2013). The response surface regression procedure was employed to fit the quadratic polynomial equation to the experimental data. All the coefficients of linear (

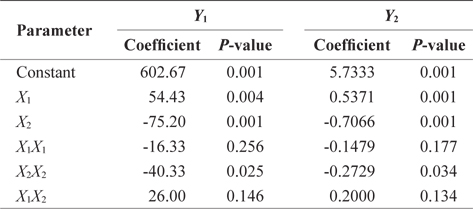
Estimated coefficients of the fitted quadratic polynomial equation for responses based on t-statistic for preparation of surimi products containing rice flour
[Table 5.] Response surface model for preparation of surimi products containing rice flour

Response surface model for preparation of surimi products containing rice flour
>
Analysis of variance (ANOVA)
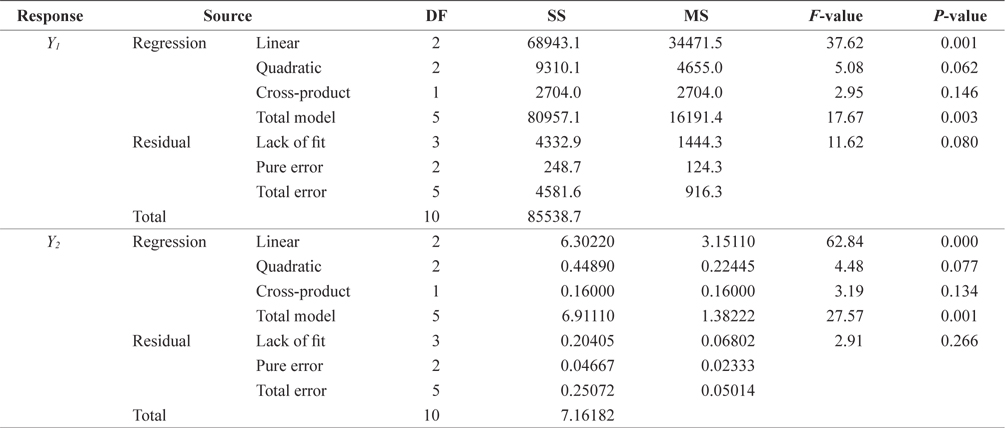
The statistical significance of the quadratic polynomial model equation was evaluated by analysis of variance (ANOVA). Table 6 shows ANOVA results for the models that explain the response of the two dependent variables,
[Table 6.] Analysis of variance (ANOVA) for response of dependent variables (Y1 and Y2)

Analysis of variance (ANOVA) for response of dependent variables (Y1 and Y2)
>
Response surface plots and the effect of factors
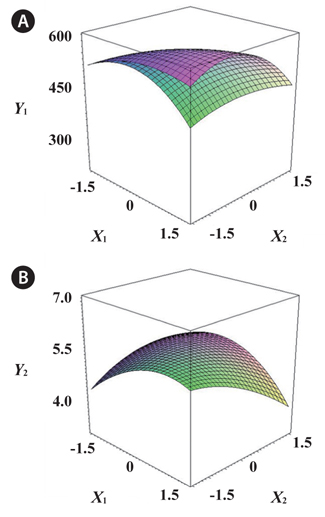
The estimated response function and the effect of the IVs on the DVs are shown in Fig. 2. When
Optimal conditions included both coded and uncoded values of the dependent variables (

Multiple response optimization for the preparation of surimi products containing rice flour of predicted and experimental values