The phylogenetic analysis was carried out to find out the validity of Chrysochroa coreana as a new species. The insect specimens were collected at Kaohsiung, Taiwan and Shizuoka, Japan. Partial region (532 bp) of COI was amplified and sequenced. The sequences were aligned and then analyzed. Based on the Kimura-2-parameter method, we calculated genetic distances among them. It indicated that the Korean individual of C. fulgidissima was closely related to Taiwan one with relatively low genetic distance (0.083). On the other hand, the Japanese individual was remotely related with those of Korean (0.192) and Taiwan (0.183) individuals. To clarify if the populations of C. fulgidissima from Korea, Taiwan, and Japan are different at the level(s) of subspecies, species, or genus, it is necessary that more samples of the members of the family Buprestidae should be collected and genetically analyzed.
The Korean jewel beetle,
The ecological study carried out by Kwon (2013) resulted in acquiring several specimens of
>
Sample collection and total cellular DNA extraction
The jewel beetle
>
PCR amplification and sequencing
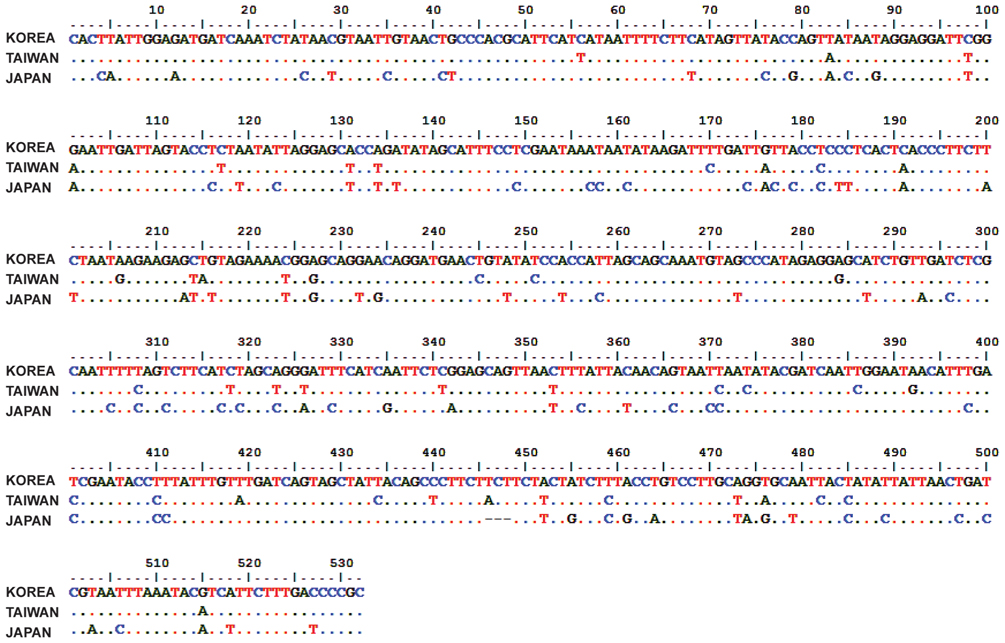
The partial cytochrome C oxidase I gene (COI) which is 532 bp in length was amplified using a pair of primers LCO1490 (5′-GGT CAA CAA ATC ATA AAG ATA TTG G-3′) and HCO2198 (5′-TAA ACT TCA GGG TGA CCA AAA AAT CA-3′) (Folmer et al. 1994). PCR was performed in a volume of 20 μL containing 1 pg to 1 μg DNA, 2.5 mM of each dNTP, 10 pM of each primers, and 2.5 unit of DNA polymerase with the reaction buffer (iNtRON Biotechnnology, Sungnam, Korea); the cycle setting include a cycle of 5 min at 94˚C for initial denaturation, 34 cycles of 30 s denaturation at 94˚C, 30 s annealing at 63˚C and 30 s extension at 72˚C; and single extension cycle of 72˚C for 5 min. The PCR products were mixed with ExoSAP-IT endonuclease (USB, Santa Clara, CA, USA) and incubated for 15 min at 37˚C to remove any unused primers and nucleotides. The PCR fragments of the purified were sequenced in both directions with an ABI PRISM BigDye terminator system (Applied Biosystems, Foster City, CA, USA). The reactants were analyzed on an ABI3700 model automatic sequencer (GenoTech Co., Daejeon, Korea).
COI sequences were identified by using BLAST searches (www.ncbi.nlm.nih.gov/BLAST/) and edited by BioEdit software (Hall 1999). In addition to the BLAST search, identification of COI was conducted by aligning with that of the previously published
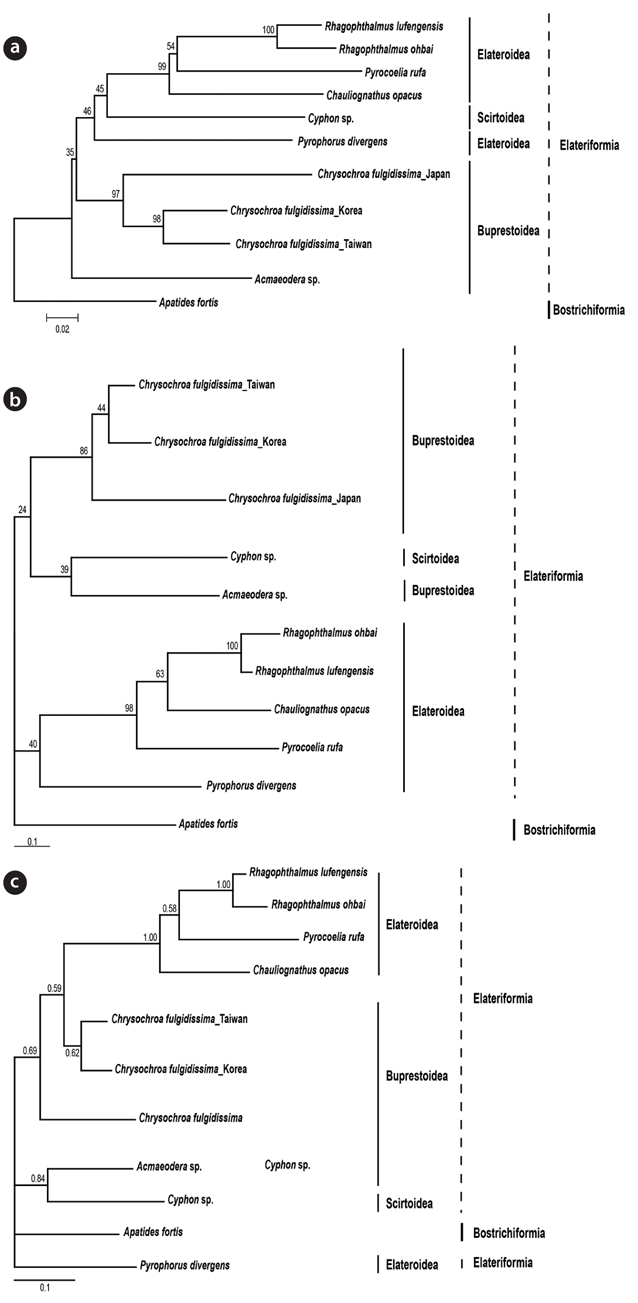
Genetic distances based on the Kimura-2-parameter method were compared across the examined species listed in Table 1 using MEGA ver. 4.0 (Tamura et al. 2007). The neighbor joining method (NJ) implemented in MEGA ver. 4.0 (Tamura et al. 2007), maximum likelihood method (ML) with PhyML ver. 3.0 (Guindon and Gascuel 2003), and Bayesian inference (BI) method with MrBayes ver. 3.1.2 (Huelsenbeck and Ronquist 2001) were employed to resolve their relationships. The bootstrapping values representing for node confidence were obtained with 1,000 bootstrapping replicates in the NJ and ML analyses. In BI, Bayesian posterior probability (BPP) was presented for the node confidence values. The BI analysis was carried out with the following options: 1,000,000 generations, 4 chains and a burn-in step of the 1,000.
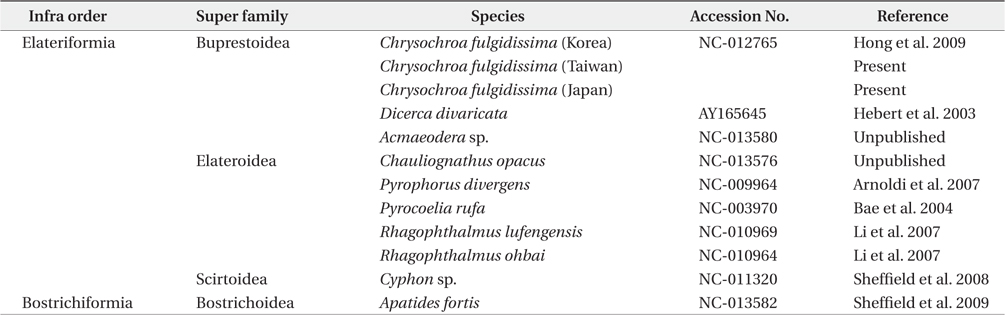
[Table 1.] List of used for comparisons of mitochondrial COI gene sequence

List of used for comparisons of mitochondrial COI gene sequence
Two individuals of the jewel beetle
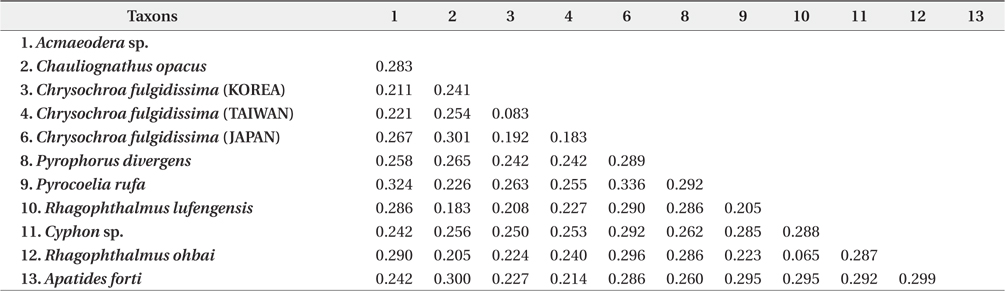
Genetic distances based on the Kimura-2-parameter method were compared across the examined species
It indicated that the Korean individual of
Phylogenetic analyses using ML, BI, and NJ were coincident with the result of the genetic distance comparison (Fig. 2). It showed that Korean and Taiwan individuals consistently formed a sister group in all the three different trees (BP 98% in NJ, BP 44% in ML, BPP 62% in BI). Japanese one appeared to be a sister of the clade of Korean and Taiwan individuals in NJ (BP 97%) and ML (BP 86%). Unexpectedly, the Japanese individual in BI tree was not clustered with the remaining Korean and Taiwan
The present results strongly suggested that the three different populations of