검색 전체 메뉴
PDF
맨 위로
OA 학술지
Phytoremediation potential of indigenous Ghanaian grass and grass-like species grown on used motor oil contaminated soils
  • 비영리 CC BY-NC
  • 비영리 CC BY-NC
ABSTRACT
Phytoremediation potential of indigenous Ghanaian grass and grass-like species grown on used motor oil contaminated soils
KEYWORD
Bothriochloa bladhii , contamination , motor oil , organic , phytoremediation , Torulinium odoratum
  • INTRODUCTION

    The exponential increase in the number of automotive vehicles in Africa has concomitantly led to the extensive use of refined petroleum products. In particular, such vehicles are usually old and have low efficiency in utilizing the refined products. Ghana epitomizes this phenomenon. Activities of way-side private automobile mechanics are largely uncontrolled across the cities and towns in non-built up areas in Ghana. This, in turn, has led to rampant spillage and deliberate release of used motor oil (UMO) directly on the soil surface leading to potential contamination of groundwater. Used motor oil may contain heavy metals, such as lead, chromium, cadmium, arsenic, zinc and other materials like benzene, naphthalene, chlorinated hydrocarbons, and sulphur. One liter of oil can contaminate up to 1 million liters of water and can accumulate in the subsoil system, posing a risk to the environment. A single automotive oil change is estimated to produce 4–5 L of used oil (Singh et al. 2009). The amount of used motor oil disposed of improperly by auto mechanics every 18 days is approximately 42 million L. Approximately, 3.8 L (i.e., one gallon) of used motor oil that is re-refined will produce 2.4 L of lubricating oil, but it takes 159 L of crude oil to produce the same 2.4 L of lubricating oil. Obviously, these motor lubricants and UMOs do alter soil physical, chemical and microbial properties (Patrick-Iwuanyanwu et al. 2010) and inhibit plant growth (Okonokhua et al. 2007, Kayode et al. 2009). The hydrocarbon component of the oil is also known to interfere with integrity of membranes (Carson et al. 2006).

    The ability of plants to thrive in oil contaminated media varies from one species to the other and this variation holds the key to the remediation of oil contaminated soils. To be a candidate for phytodegradation according to the Green Liver Model, 1) a suitable set of enzymes has to be present in the plant cells and 2) a soil contaminant has to be taken up by the plant through the xylem. As opposed to heavy metals that, as a result of their similarity to nutrients, are actively taken up by plant cells through transporter molecules (Krämer et al. 2007, Reichenauer and Germida 2008), no such specific transporter molecules exist in plants for organic contaminants of soil. These molecules are taken up passively by plant cells. Therefore, octanol– water partition coefficients (logKow) of such substances and their solubility in water, which facilitate the crossing of the outer cell membrane (the plasmalemma), are important and prerequisite for a substance to be taken up by plants (Reichenauer and Germida 2008). Substances with logKow between 0.5 and 3 are found to be taken up best by plants. Very hydrophilic substances (i.e., logKow < 0.5) can be transported well inside the plant but are not able to cross the plasmalemma, which is a lipid bilayer (Reichenauer and Germida 2008). Hydrophobic substances (i.e., logKow > 3), on the other hand, can be dissolved in the plasmalemma but are only poorly associated in the cytoplasm. For hydrophobic organic contaminants, including phenanthrene and pyrene, uptake by the roots of the plants shows a strong correlation with root lipid content (Gao et al. 2007). Both substances can be transferred from the root to the shoot, whereas no shoot-to-root transfer of these two polycyclic aromatic hydrocarbons (PAHs) in atmospheric deposition could be detected.

    According to Garbisu and Alkorta (2001), there are two different strategies for phytoremediation of organics: direct phytoremediation and phytoremediation explanta. The latter is based on the secretion by plants of their photosynthate in root exudates, which support the growth and metabolic activities of diverse fungal and bacteria communities in the rhizosphere. Some organic compounds in root exudates (such as phenolics, organic acids, alcohols, proteins) may serve as carbon and nitrogen sources for growth and long-term survival of micro-organisms that are capable of degrading organic pollutants (Garbisu and Alkorta 2001). Organic pollutants that have been successfully phytoremediated include organic solvents such as trichloroethylene (TCE) that is the most common pollutant of groundwater (Shang et al. 2003), herbicides such as atrazine (Burken and Schnoor 1997), explosives such as trinitrotoluene (TNT) (Hughes et al. 1997), petroleum hydrocarbons such as oil, gasoline, benzene, toluene, and PAHs (Olson et al. 2003), the fuel additive methyl tertbutyl ether (MTBE) (Winnike-McMillan et al. 2003), and polychlorinated biphenyls (PCBs) (Harms et al. 2003). The major factors limiting phytoremediation are the mass transfer, rate of plant uptake, and microbial biodegradation of hydrophobic organic compounds (HOCs) (Gao et al. 2007).

    In fact, existing research on phytoremediation has disproportionately focused on heavy metals. This study therefore, sought to determine the potential of some selected indigenous grass and grass-like species for phytoremediation of UMO contaminated soils. The specific objectives were to investigate the effect of the UMO on some growth parameters (chlorophyll concentration and biomass) of the selected plant species; measure the quantity of total hydrocarbon extracted by the grass species; and also to estimate the degradation ability of the species. It was envisaged that the plant species with the most proven potential could be employed in field trials.

    MATERIALS AND METHODS

      >  Seedlings collection and identification

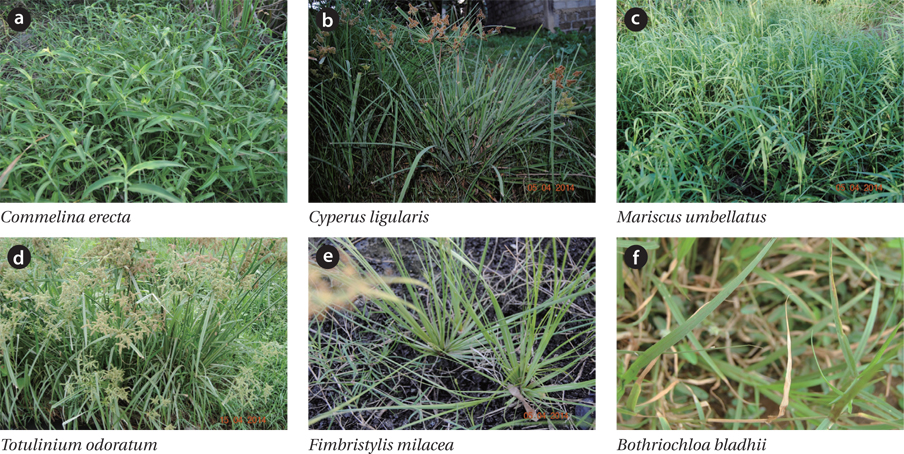
    Seedlings of plant species used for this study were collected from various locations along the Kpone and Tema Newtown beaches and inland points within Ashaiman (05º42′00″ N, 00º01′60″ W) and Tema (05º40′ N, 00º00″ W), Ghana. Bothriochloa bladhii (Retz.) S.T. Blake (Poaceae) was obtained along the beach of Kpone. Cyperus ligularis L. (Cyperaceae) and Commelina erecta L. (Commelinaceae) were obtained along the beach of Tema Newtown. Mariscus umbellatus (Rottb.) Vahl (Cyperaceae) was obtained around the Physiology Laboratory of the Department of Botany, University of Ghana. Fimbistylis miliacea L. (Cyperaceae) was obtained from the Japanese Farms at Ashaiman Jericho. Torulinium odoratum L. (Cyperaceae) was obtained around the Ashaiman Municipal Assembly (ASHMA) building. Seedlings of these plants were used in this study. The choice of these plant species (Fig. 1) was based on the fact that grasses and grass-like species are ubiquitous and have extensive root system which offers large surface area to accommodate consortia of microbiota. Additionally, they can be easily uprooted for dry weight measurement. Besides, their perennating buds are subterranean and so can have a long tenure at one place, while their aerial parts die off annually. The seedlings were transplanted into 15 × 15 cm black polythene bags filled with used motor oil contaminated soil.

      >  Site description and soil sampling

    The soils (Alajo series) used in this study were collected from five profile pits located along the catena that runs from the Legon hill, in the northeastern direction. The study area lies within 05º38′00″ N to 05º42′00″ N, and 00º08′00″ W to 00º12′00″ W, approximately. This area is typical of the general ecology and geomorphology of the coastal savanna zone and the Accra Plains in general (Eze et al. 2010). The altitude of the study area ranged from 54 to 164 m above sea level. It experiences a mean annual rainfall of about 800 mm and mean annual temperature of 27ºC (Eze et al. 2010). The rainfall regime typically consists of two rainy seasons: a main wet season which falls from April to July, and a minor rainy season around September to mid November. This area is further characterized by a distinct dry season between December and February. Legon hill in the Accra Plains is an outlier of the Togo–Akwapim Range. The geology of the area is Togo (pre-cambrian) quartzite with smaller amounts of phyllite, sericite, schist, sandstone, and shale (Eze et al. 2010). The catena on the Legon hill under study consists of five soil series, comprising four Alfisols and one Vertisol (Eze et al. 2010).

      >  Physical and chemical properties of soil

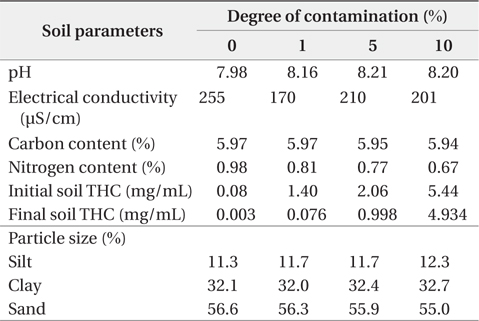
    The textural characterization of the soils indicates they are predominantly sandy clay loam, sandy clay, and clay. Sand content of the soils varied from 250 to 790 g/kg and tended to decrease with depth, while the silt content ranged from 100 to 300 g/kg. Clay content ranged from 130 to 730 g/kg and generally increased with depth. Table 1 shows the physicochemical properties of soils used in this study. The Alajo series located at the bottom slope was predominantly clay with a clay content of ≥500 g/kg in all horizons. Elevation tended to influence the distribucoltion of clay and sand within the upper 0–30 cm depth of these soils. A decrease in elevation clearly indicated an increase in clay enrichment with a corresponding decrease in sand content, since the finer particles (clay fraction) are easily transported down to bottom slopes. The pH of the soils ranged from 5.0 to 7.9 (moderately acidic to slightly alkaline) and tended to decrease with depth. Soil electrical conductivity (EC) values ranged from150 to 300 µS/cm indicating that the soils were non-saline.

    [Table 1.] Physicochemical properties of soil

    label

    Physicochemical properties of soil

      >  Degree of contamination

    In this paper, degree of contamination is defined as the percentage weight of UMO contaminant with respect to dry weight of soil. The observed contamination level at some contaminated sites (i.e., environs of mechanical workshops) provided a basis for contamination of the soil in the laboratory at varying percentages. Based on this consideration, the soil was contaminated at 1%, 5%, and 10% degree of contamination for further studies. The initial degree of contamination was fixed at 1% because Ghana does not have any statutory percentage degree of soil contamination that it considers as hazardous waste.

      >  Soil Analysis

    The soil was obtained from the Experimental Farm site on the University of Ghana campus and prepared by sieving it through 2 mm mesh to exclude debris and spread out thinly in a rectangular tray to air dry. Two kilograms of the dried soil was treated by mixing thoroughly with 0 ml, 26 ml, 115 ml and 228 ml of UMO to obtain a control, 1%, 5% and 10% level of UMO contamination of the soil. The test plants were allowed to grow for 8 weeks in a greenhouse. Analyses were carried out 2, 4, 6, and 8 weeks after transplanting respectively. Soil pH was analyzed by Orion ion meter model 525A (Thermo Scientific, Beverly, MA, USA). Available nitrogen (%) and available phosphorus (%) were estimated by following the approach of Carter and Gregorich (2007), while total organic carbon was analyzed by following the method of Walkley (1947). Water holding capacity was measured hydrometrically.

      >  Measurement of leaf chlorophyll

    Leaf chlorophyll content of the entire test plants were analysed spectrometrically at 647 and 664 nm, using the Perkin-Elmer spectrophotometer (Lambda 20 VS VIS; Perkin-Elmer, Waltham, MA, USA) after extraction with 80% (v/v) toluene. The Witham et al. (1971) formula was used to determine the leaf chlorophyll content of the test plants. Total hydrocarbon content of the test plants was determined spectrometrically at 420 nm after extraction with toluene 80% (v/v) and degradation ability of the test plants was estimated as the amount of hydrocarbons removed from the contaminated soils in relation to the amount applied (Merkl 2005). There were 12 replicates of each selected plant species per treatment option.

      >  Contaminant

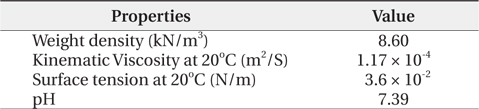
    Used motor oil (UMO) was chosen as the contaminant for this study. It was obtained from a local automobile workshop. The grade of used oil was the Society of Automotive Engineers (SAE) 10W. This means that the oil can still be pumped by the engine at a temperature as low as minus 10 degrees during winter. Physical properties of the UMO are shown in Table 2. The hydrocarbon components of the UMO consisted of saturates (76%), aromatics (12%), polar compounds (3%), asphaltenes (1.5%), volatile compounds (3.5%) and other components not characterized (4%). The metal components of the UMO consisted of Al (12 mg/kg), Sb (612 mg/kg), Ba (7,512 mg/kg), Ca (38,012 mg/kg), Cu (1,312 mg/kg), Fe (13,812 mg/kg), Pb (45,012 mg/kg), Zn (68,012 mg/kg), Mg (20,012 mg/kg) and Si (1,912 mg/kg).

    [Table 2.] Physical properties of used motor oil (UMO)

    label

    Physical properties of used motor oil (UMO)

      >  Contamination

    The calculated weight of UMO to achieve the desired degree of contamination was sprayed on 2 kg of each type of soil. The soil–contaminant mixture was pulverized manually and thoroughly mixed for 1 h in a covered tray. The mixture was placed in a covered container for 1 week so that the UMO would come to equilibrium with the soils. During this period, the soils were mixed periodically. Dry soils required 24 to 48 h to come to equilibrium with water (ASTM 1993).

      >  Total hydrocarbon uptake

    Total hydrocarbon uptake indicates the ability of total hydrocarbon accumulation in different plant parts of collected species. Concentration ratio for total hydrocarbon was calculated as per the following formula: CR = (shoot total hydrocarbon concentration)/(root total hydrocarbon concentration). Thus, in roots it is an index of translocation. Generally, the CR in all confirmed hyper-accumulators of hydrocarbons are >1, whereas it is usually <1 in non-accumulators.

      >  Statistical Analysis

    The statistical package for the social sciences (SPSS) ver. 16.0 for Windows software (SPSS Inc., Chicago, IL, USA) was used to analyze the means of data obtained as well as to display them graphically. The means were compared using two-way analysis of variance (ANOVA), significance was declared for values of P < 0.05 followed by mean separation by using the Tukey's HSD Post-hoc test.

    RESULTS

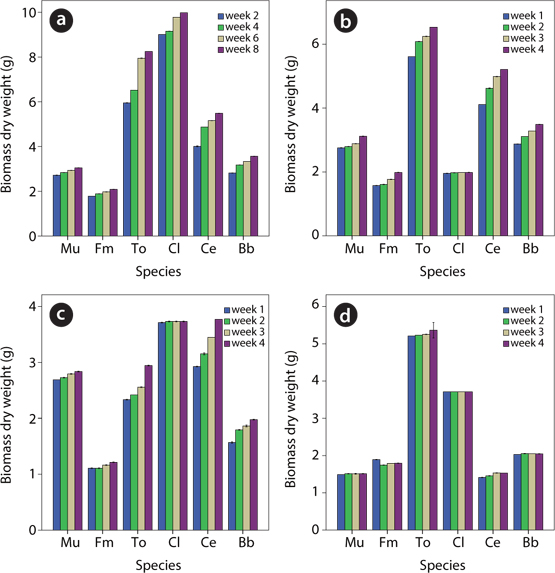
      >  Growth of plant species in contaminated soil

    Test plants thrived in all the levels of soil contamination with UMO except C. ligularis which grew only in the control soils. The week-by-week dry weight data presented in Fig. 2 showed that there was steady growth in M. umbellatus, F. miliacea, T. odoratum, C. erecta and B. bladhii in the 0% (i.e., control), 1% and 5%. There was an observed reduction in growth when control (0%) and treated (1, 5 and 10%) plant species were compared. This reduction was however, significant (P < 0.05) among plant species planted in soils at 5% and 10% level of UMO contamination (Fig. 1c and 1d).

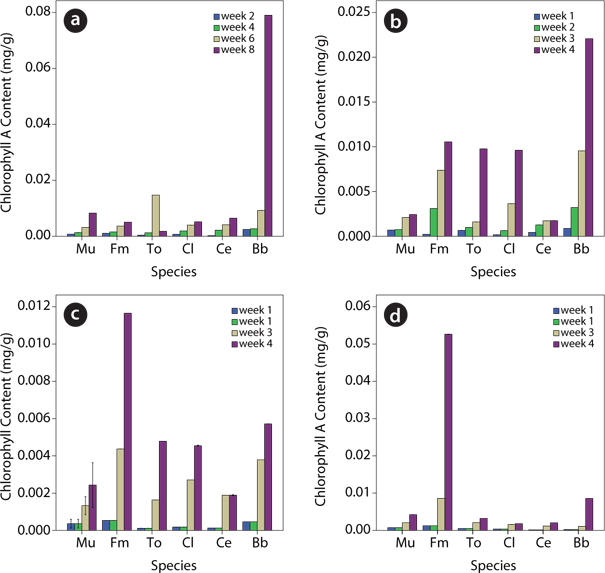
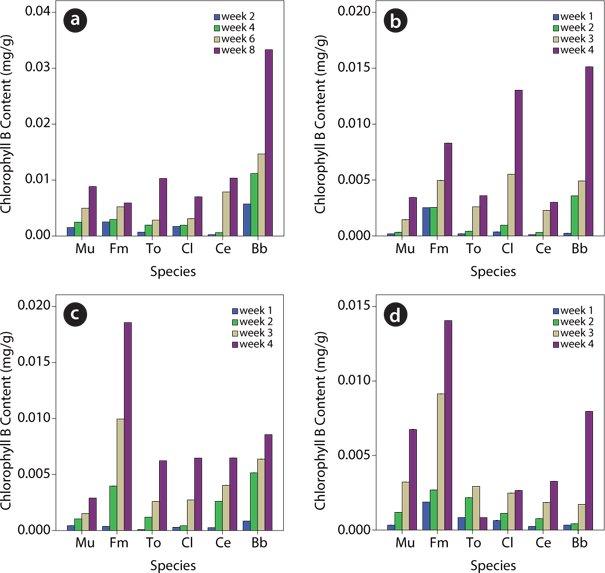
    Cholorophyll content of plants species in contaminated soil

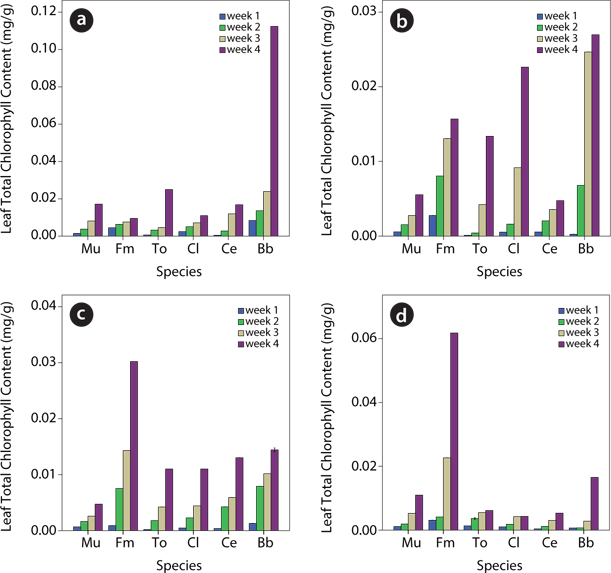
    Data on chlorophyll content showed that the leaf chlorophyll content (A, B and total chlorophyll) of test plants within each treatment level generally increased from week 1 to week 4 (Figs. 3-5). For chlorophyll A, B. bladhii planted in the control soils at week 4 recorded the highest values whilst T. odoratum species planted in soils at 1% level of UMO contamination recorded the least value (Fig. 3). Bothriochloa bladhii species planted in control soils again recorded the highest chlorophyll B content whilst T. odoratum planted in soils at 5% level of UMO contamination recorded the least chlorophyll B values (Fig. 4). The leaf total chlorophyll content of B. bladhii planted in the control soils recorded the highest leaf total chlorophyll content whilst the leaf total chlorophyll content of T. odoratum planted in soils at 10% level of contamination with UMO was the least at week 1 (Fig. 5). However, data on control and treated samples of each chlorophyll measure in the various treatment options showed that some species planted in contaminated media recorded chlorophyll contents (A, B and total chlorophyll) which were significantly (P < 0.5) higher than their corresponding species planted in the control soils. These species included C. ligularis (Figs. 3-5), F. miliacea (Figs. 3-5) and T. odoratum (Fig. 3).

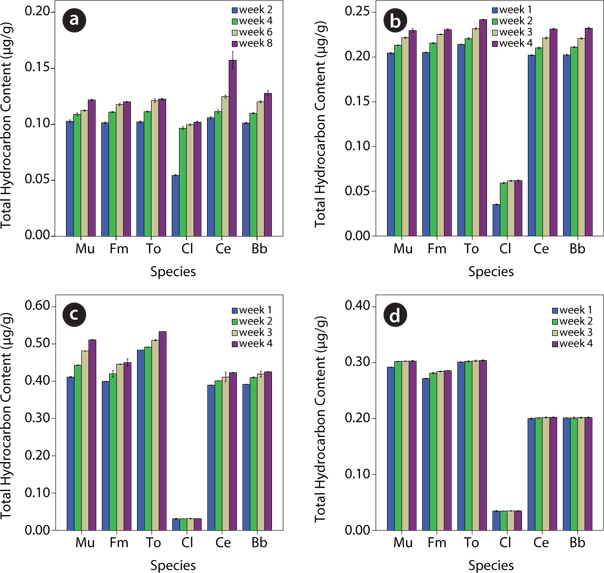
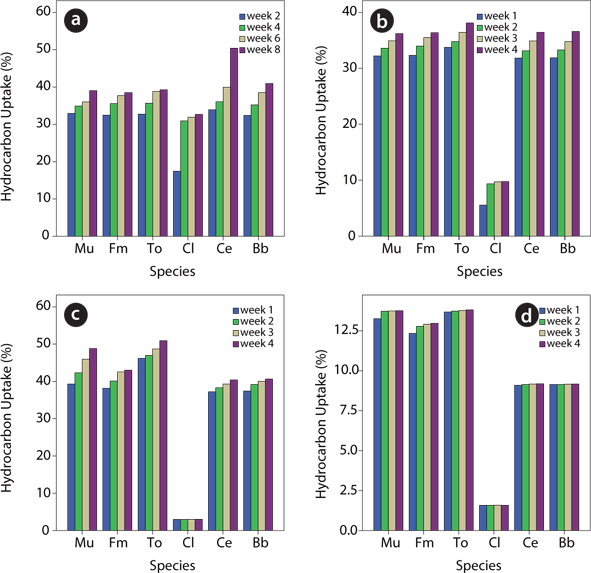
      >  Hydrocarbon content of the plants species in contaminated soil

    There was a steady increase in hydrocarbon content of test plant species from week 1 to week 4 of the 0%, 1% and 5% levels (Fig. 6). For C. ligularis, there was increase in total hydrocarbon content only in the 1% UMO contaminated soils. Generally, all the test plants did not show appreciable increase in the levels of total hydrocarbon content at the 10% level. The highest total hydrocarbon content was recorded in T. odoratum species at week 4 (Fig. 6c) planted in soils of the 5% of UMO contamination whilst the lowest was observed in C. ligularis at week 1 in the 1% contamination soil (Fig. 6b).

      >  Percentage degradation of hydrocarbons in contaminated soil

    The percentage degradation of hydrocarbons varied with the various treatments and plant species used as depicted in Fig. 7. The general degradation was slightly above average (i.e., 50%) as the highest recorded was 52.7% for T. odoratum at week 4 in the 5% UMO contaminated soils (Fig. 7c) whilst the lowest was 1.7% in C. ligularis planted in soils at 10% level of UMO contamination (Fig. 7d).

      >  Species-specific hydrocarbon uptake

    The treatment options had significant effect on the uptake of hydrocarbons in the various plant species. For M. umbellatus, F. miliacea and T. odoratum the trend of hydrocarbon uptake in decreasing order of magnitude was as follows: plant species planted in soils at 5% level speof UMO contamination > plant species planted in soils at 10% level of UMO contamination > plant species planted in soils at 1% level of UMO contamination > plant species planted in uncontaminated soils. The mean THC (mean ± standard error, µg/g) of M. umbellatus species was as follows: 0.111 ± 0.001, 0.218 ± 0.001, 0.462 ± 0.001 and 0.300 ± 0.001 respectively for M. umbellatus species planted in soils at 0%, 1%, 5% and 10% level of UMO contamination. The mean THC of F. miliacea species was as follows: 0.112 ± 0.001, 0.220 ± 0.001, 0.429 ± 0.001 and 0.281 ± 0.001 respectively for F. miliacea species planted in soils at 0%, 1%, 5% and 10% level of UMO contamination. The mean THC of T. odoratum species was as follows: 0.114 ± 0.001, 0.228 ± 0.001, 0.505 ± 0.001 and 0.303 ± 0.001 respectively for T. odoratum species planted in soils at 0%, 1%, 5% and 10% level of UMO contamination. For C. erecta and B. bladhii, the trend of hydrocarbon uptake in decreasing order of magnitude was as follows: plant species planted in soils at 5% level of UMO contamination > plant species planted in soils at 1% level of UMO contamination > plant species planted in soils at 10% level of UMO contamination > plant species planted in uncontaminated soils. The mean THC of C. erecta species was as follows: 0.125 ± 0.001, 0.217 ± 0.001, 0.406 ± 0.001 and 0.201 ± 0.001 respectively for C. erecta species planted in soils at 0%, 1%, 5% and 10% level of UMO contamination. The mean THC of B. bladhii species was as follows: 0.115 ± 0.001, 0.217 ± 0.001, 0.412 ± 0.001 and 0.202 ± 0.001 respectively B. bladhii species planted in soils at 0%, 1%, 5% and 10% level of UMO contamination. For C. ligularis, the trend of hydrocarbon uptake in a decreasing order was as follows: plant species planted in uncontaminated soils > plant species planted in soils at 1% level of UMO contamination > plant species planted in soils at 10% level of UMO contamination > plant species planted in soils 5% level of UMO contamination. The mean THC of C. ligularis species was as follows: 0.088 ± 0.001, 0.055 ± 0.001, 0.031 ± 0.001 and 0.035 ± 0.001 respectively for C. ligularis species planted in soils at 10% level of UMO contamination > plant species planted in uncontaminated soils.

      >  Soil to plant uptake

    Species variations in soil–plant transfer (concentration ratios) were observed and the magnitude of uptake for the plant species in decreasing order was as follows: T. odoratum > F. miliacea > M. umbellatus > B. bladhii > C. erecta > C. ligularis. Thus, almost all six plant species were hyperaccumulators except C. ligularis

    DISCUSSION

    Five out of the six plants investigated in this study showed a great ability to survive in UMO contaminated soils as demonstrated by their growth monitoring data. The exception was C. ligularis which could not survive beyond seven days after transplanting in various degrees of the contaminated soils. The test plants showed reduction in dry weights when compared with the control. This observation is similar to the observations made by Dominguez-Rosado and Pichtel (2004), Okieimen and Okieimen (2005), Merkl et al. (2005) and Ogbo et al. (2009) who in separate studies reported reductions in dry weights of plant species planted in oil contaminated soils compared to plant species planted in uncontaminated soils and concluded that UMOs pose significant stress on the growth and development of plants.

    The data obtained showed that within a given treatment level, leaf total chlorophyll as well as the chlorophyll A and B of the test plants were found to increase from week 1 to week 4. However, upon comparison of the different treatment levels, species response to the effect of the various levels of the UMO contamination in the soils was found to be significantly (P < 0.05) different. In a related study by Spiares et al. (2001), differences in chlorophyll A, chlorophyll B and total chlorophyll content were ascribed to the genetic makeup of the plants. The test plants showed remarkable potential to break down and take up the UMO, as determined from the amount of hydrocarbons removed in relation to the amount applied to the soil. According to Dai et al. (2009), chlorophyll levels were important parameters for identifying stress in plants and were associated with other important variables that affected plant development. Several studies have reported a reduction in photosynthetic pigments and chlorophyll in plant leaves under used motor oil-induced stress (Odjegba and Sadiq 2002, Achuba and Peretiemo-Clarke 2008, Adenipekun et al. 2008). Dai et al. (2009) explained that the reduction resulted in decreased photosynthetic activity efficiency by the inhibition of chlorophyll biosynthesis and a decreased carbon assimilation, which ultimately led to a decrease in biomass production.

    The observation made in this study that the total hydrocarbon content of test plants varied from species to species and increased throughout the study period in all except for one specie is consistent with the findings of Palmroth et al. (2002) and Ogbo et al. (2009) who, in similar but separate studies using different plant species reported variations in the hydrocarbon contents of the test plants used. It is thus, apparent that different plant species have different potentials for the uptake of hydrocarbons. Frick et al. (1999) explained that the ability of plants to conduct phytoremediation depended on the activities of the degrading microorganisms in the rhizosphere of these plants which secreted chemical substances into the rhizosphere that aided plant roots to absorb hydrocarbons into their tissues. Thus, genetic makeup of the species and micro-environmental factors of the rhizoplane and rhizosphere could influence the ability of the plant species to carry out phytoremediation, causing them to respond differently to the toxicity posed by the oil (Spiares et al. 2001).

    This study also revealed that the 5% UMO contaminated soils recorded the highest hydrocarbon uptake and degradation values compared to the other treatment options. This shows that there is an optimum level or threshold of the contaminant that can sustain the growth of the plant species even though the growth realized was lower than in the case of the uncontaminated soils. The degradation ability of the test plants was appreciable though the experiment was conducted in unamended soils. The degradation values attained by T. odoratum and M. umbellatus are particularly encouraging. Data on plant growth, uptake of hydrocarbons as well as the degradation of hydrocarbons collected from the test plants used in this study have provided credible basis to exploit their potential for phytoremediation of spent oil contaminated soils on trial basis. Bothriochloa bladhii, C. erecta, T. odoratum, M. umbellatus and F. miliacea were identified as the most suitable plant species to clean up spent oil contaminated soils. Based on the results of this study, the phytoremediation potential of the test plants can be arranged in decreasing order as: T. odoratum, M. umbellatus, F. miliacea, B. bladhii and C. erecta, but C. ligularis has no phytoremediation potential.

    CONCLUSION

    This study set out to investigate the ability of six tropical grass species namely B. bladhii (Retz.) S.T. Blake (Poaceae), C. ligularis L. (Cyperaceae), C. erecta L. (Commelinaceae) M. umbellatus (Rottb.) Vahl (Cyperaceae), F. miliacea L. (Cyperaceae) and T. odoratum L. (Cyperaceae) to clean up various levels of UMO contaminated soils. T. odoratum L. (Cyperaceae) and B. bladhii decomposed hydrocarbons more rapidly than other plant treatments. All the plant species had phytoremediation potential except C. ligularis. The processes that affect hydrocarbon availability, hydrocarbon uptake, translocation, degradation, and volatilization need to be investigated in detail. Better knowledge of these biochemical mechanisms may lead to: 1) identification of novel genes and the subsequent development of transgenic plants with superior remediation capacities; 2) better understanding of the ecological interactions involved (e.g., plant-microbe interactions); 3) appreciation of the effect of the remediation process on ecological interactions; and 4) knowledge of the entry and movement of the organic pollutant in the ecosystem. In addition to being desirable from a fundamental biological perspective, findings will help improve risk assessment during the design of remediation plans, as well as alleviation of risks associated with the remediation.

참고문헌
  • 1. Achuba FI, Peretiemo-Clarke BO 2008 Effect of spent engine oil on soil catalase and dehydrogenase activities [Int Agrophysics] Vol.22 P.1-4 google
  • 2. Adenipekun CO, Oyetunji OJ, Kassim LS 2008 Effect of spent engine oil on the growth parameters and chlorophyll content of Corchorus olitorius Linn [Environmentalist] Vol.28 P.446-450 google
  • 3. 1993 Standard test method for liquid limit, plastic limit and plasticity index of soils ASTM standard (D4318-84). In: Annual Book of ASTM Standards Vol.04.08 google
  • 4. Burken JG, Schnoor JL 1997 Uptake and metabolism of atrazine by poplar trees [Environ Sci Technol] Vol.31 P.1399-1406 google
  • 5. Carson CF, Hammer KA, Riley TV 2006 Melaleuca alternifolia (tea tree) oil: A review of antimicrobial and other medicinal properties [Clin Microbiol Rev] Vol.19 P.50-62 google
  • 6. Carter MR, Gregorich EG 2007 Soil sampling and methods of analysis google
  • 7. Dai Y, Shen Z, Liu Y, Wang L, Hannaway D, Lu H 2009 Effects of shade treatments on the photosynthetic capacity, chlorophyll fluorescence, and chlorophyll content of Tetrastigma hemsleyanum Diels et Gilg [Environ Exp Bot] Vol.65 P.177-182 google
  • 8. Dominguez-Rosado E, Pichtel J, Coughlin M 2004 Phytoremediation of soils contaminated with used motor oil. 1. Enhanced microbial activities from laboratory and growth chamber studies [Environ Eng Sci] Vol.21 P.157-168 google
  • 9. Eze PN, Udeigwe TK, Stietiya MH 2010 Distribution and potential source evaluation of heavy metals in prominent soils of Accra Plains, Ghana [Geoderma] Vol.156 P.357-362 google
  • 10. Frick CM, Farrel RE, Germida JJ 1999 Assessments of phytoremediation as an in-situ technique for cleaning oil contaminated sites. A report prepared for the Petroleum Technology Alliance google
  • 11. Gao YZ, Ling WT, Zhu LZ, Zhao BW, Zheng QS 2007 Surfactant-enhanced phytoremediation of soils contaminated with hydrophobic organic contaminants: Potential and assessment [Pedosphere] Vol.17 P.409-418 google
  • 12. Garbisu C, Alkorta I 2001 Phytoextraction: a cost-effective plant-based technology for the removal of metals from the environment [Bioresour Technol] Vol.77 P.229-236 google
  • 13. Harms H, Bokern M, Kolb M, Bock C 2003 Transformation of organic contaminants by different plant systems. In: Phytoremediation: transformation and control of contaminants (McCutcheon SC, Schnoor JL, eds) P.285-316 google
  • 14. Hughes JB, Shanks J, Vanderford M, Lauritzen J, Bhadra R 1997 Transformation of TNT by aquatic plants and plant tissue cultures [Environ Sci Technol] Vol.31 P.266-271 google
  • 15. Kayode J, Olowoyo O, Oyedeji A 2009 The effects of used engine oil pollution on the growth and earth seedling performance of Vigna uniguiculata and Zea mays [Res J Soil Biol] Vol.1 P.15-19 google
  • 16. Kramer U, Talke IN, Hanikenne M 2007 Transition metal transport [FEBS Lett] Vol.581 P.2263-2272 google
  • 17. Merkl N 2005 Phytoremediation of petroleum-contaminated soils in the tropics P.126-131 google
  • 18. Merkl N, Schultze-Kraft R, Infante C 2005 Assessment of tropical grasses and legumes for phytoremediation of petroleum contaminated soils [Water Air Soil Pollut] Vol.165 P.195-209 google
  • 19. Odjegba VJ, Sadiq AO 2002 Effect of spent engine oil on the growth parameters, chlorophyll and protein levels of Amaranthus hybridus L [Environmentalist] Vol.22 P.23-28 google
  • 20. Ogbo EM, Avwerosovwe U, Odogu G 2009 Screening of four common Nigerian weeds for use in phytoremediation of soil contaminated with spent lubricating oil [Afr J Plant Sci] Vol.3 P.102-106 google
  • 21. Okieimen CO, Okieimen FE 2005 Bioremediation of crude oil polluted soil ? Effect of poultry droppings and natural rubber processing Sludge application on biodegradation of petroleum hydrocarbons [Environ Sci] Vol.12 P.1-8 google
  • 22. Okonokhua BO, Ikhajiagbe B, Anoliefo GO, Emede TO 2007 The effects of spent engine oil on soil properties and growth of maize (Zea mays L.) [J Appl Sci Environ Manage] Vol.11 P.147-152 google
  • 23. Olson PE, Reardon KF, Pilon-Smits EAH 2003 Ecology of rhizosphere bioremediation. In: Phytoremediation: Transformation and Control of Contaminants (McCutcheon SC, Schnoor JL, eds) P.317-354 google
  • 24. Palmroth MRT, Pitchel J, Puhakka JA 2002 Phytoremediation of subarctic soil contaminated with diesel fuel [Bioresour Technol] Vol.84 P.221-228 google
  • 25. Patrick-Iwuanyanwu KC, Ogwe GO, Onwuka FC 2010 The hepatotoxic effects of the water-soluble fraction of spent lubricating oil in Wistar Albino Rats [The Internet J Toxicol] google
  • 26. Reichenauer TG, Germida JJ 2008 Phytoremediation of organic contaminants in soil and groundwater [Chem Sus Chem] Vol.1 P.708-717 google
  • 27. Shang TQ, Newman LA, Gordon MP 2003 Fate of tricholorethylene in terrestrial plants. In: Phytoremediation: Transformation and control of contaminants (Mc-Cutcheon SC, Schnoor JL, eds) P.529-560 google
  • 28. Singh SK, Srivastava RK, John S 2009 Studies on soil contamination due to used motor oil and its remediation [Can Geotech J] Vol.46 P.1077-1083 google
  • 29. Spiares JDE, Kenwrthy K, Rhykerd R 2001 Emergence and height of plants seeded in crude oil contaminated soil [Texas J Agric Nat Resour] Vol.14 P.37-46 google
  • 30. Van Dyke F 2008 Conservation Biology: Foundations, Concepts, Applications google
  • 31. Walkley A 1947 A Critical examination of a rapid method for determination of organic carbon in soils - effect of variations in digestion conditions and of inorganic soil constituents [Soil Sci] Vol.63 P.251-264 google
  • 32. Winnike­McMillan SK, Zhang Q, Davis LC, Erickson LE, Schnoor JL 2003 Phytoremediation of methyl tertiarybutyl ether. In: Phytoremediation: Transformation and Control of Contaminants (McCutcheon SC, Schnoor JL, eds) P.805-828 google
  • 33. Witham FH, Blaydes BF, Devlin RM 1971 Experiments in plant physiology google
OAK XML 통계
이미지 / 테이블
  • [ Fig. 1. ]  The plant species used in the study.
    The plant species used in the study.
  • [ Table 1. ]  Physicochemical properties of soil
    Physicochemical properties of soil
  • [ Table 2. ]  Physical properties of used motor oil (UMO)
    Physical properties of used motor oil (UMO)
  • [ Fig. 2. ]  Dry weights of test plant species at various treatment levels of soil contamination with used motor oil (UMO). (a) control (i.e., 0% UMO treatment), (b) 1% UMO treatment, (c) 5% UMO treatment, (d) 10% UMO treatment. Mu, Mariscus umbellatus; Fm, Fimbistylis miliacea; To, Torulinium odoratum; Cl, Cyperus ligularis; Ce, Commelina erecta, Bb, Bothriochloa bladhii. Error bars represent standard errors.
    Dry weights of test plant species at various treatment levels of soil contamination with used motor oil (UMO). (a) control (i.e., 0% UMO treatment), (b) 1% UMO treatment, (c) 5% UMO treatment, (d) 10% UMO treatment. Mu, Mariscus umbellatus; Fm, Fimbistylis miliacea; To, Torulinium odoratum; Cl, Cyperus ligularis; Ce, Commelina erecta, Bb, Bothriochloa bladhii. Error bars represent standard errors.
  • [ Fig. 3. ]  Weekly mean chlorophyll A content of the test plants at the various levels of soil contamination with used motor oil (UMO). (a) control (i.e., 0% UMO treatment), (b) 1% UMO treatment, (c) 5% UMO treatment, (d) 10% UMO treatment. Mu, Mariscus umbellatus; Fm, Fimbistylis miliacea; To, Torulinium odoratum; Cl, Cyperus ligularis; Ce, Commelina erecta, Bb, Bothriochloa bladhii. Error bars represent standard errors.
    Weekly mean chlorophyll A content of the test plants at the various levels of soil contamination with used motor oil (UMO). (a) control (i.e., 0% UMO treatment), (b) 1% UMO treatment, (c) 5% UMO treatment, (d) 10% UMO treatment. Mu, Mariscus umbellatus; Fm, Fimbistylis miliacea; To, Torulinium odoratum; Cl, Cyperus ligularis; Ce, Commelina erecta, Bb, Bothriochloa bladhii. Error bars represent standard errors.
  • [ Fig. 4. ]  Weekly mean chlorophyll B content of the test plants at various levels of soil contamination with used motor oil (UMO). (a) control (0% UMO treatment) (b) 1% UMO treatment (c) 5 % UMO treatment (d) 10% UMO treatment. Mu, Mariscus umbellatus; Fm, Fimbistylis miliacea; To, Torulinium odoratum; Cl, Cyperus ligularis; Ce, Commelina erecta, Bb, Bothriochloa bladhii. Error bars represent standard errors.
    Weekly mean chlorophyll B content of the test plants at various levels of soil contamination with used motor oil (UMO). (a) control (0% UMO treatment) (b) 1% UMO treatment (c) 5 % UMO treatment (d) 10% UMO treatment. Mu, Mariscus umbellatus; Fm, Fimbistylis miliacea; To, Torulinium odoratum; Cl, Cyperus ligularis; Ce, Commelina erecta, Bb, Bothriochloa bladhii. Error bars represent standard errors.
  • [ Fig. 5. ]  Total chlorophyll content of leaf of the test plants at various levels of soil contamination with used motor oil (UMO). (a) control (0% UMO treatment) (b) 1% UMO treatment (c) 5 % UMO treatment (d) 10% UMO treatment. Mu, Mariscus umbellatus; Fm, Fimbistylis miliacea; To, Torulinium odoratum; Cl, Cyperus ligularis; Ce, Commelina erecta, Bb, Bothriochloa bladhii. Error bars represent standard errors.
    Total chlorophyll content of leaf of the test plants at various levels of soil contamination with used motor oil (UMO). (a) control (0% UMO treatment) (b) 1% UMO treatment (c) 5 % UMO treatment (d) 10% UMO treatment. Mu, Mariscus umbellatus; Fm, Fimbistylis miliacea; To, Torulinium odoratum; Cl, Cyperus ligularis; Ce, Commelina erecta, Bb, Bothriochloa bladhii. Error bars represent standard errors.
  • [ Fig. 6. ]  Total hydrocarbon content of the test plants at various levels of soil contamination with used motor oil (UMO). (a) control (0% UMO treatment) (b) 1% UMO treatment (c) 5 % UMO treatment (d) 10% UMO treatment. Mu, Mariscus umbellatus; Fm, Fimbistylis miliacea; To, Torulinium odoratum; Cl, Cyperus ligularis; Ce, Commelina erecta, Bb, Bothriochloa bladhii. Error bars represent standard errors.
    Total hydrocarbon content of the test plants at various levels of soil contamination with used motor oil (UMO). (a) control (0% UMO treatment) (b) 1% UMO treatment (c) 5 % UMO treatment (d) 10% UMO treatment. Mu, Mariscus umbellatus; Fm, Fimbistylis miliacea; To, Torulinium odoratum; Cl, Cyperus ligularis; Ce, Commelina erecta, Bb, Bothriochloa bladhii. Error bars represent standard errors.
  • [ Fig. 7. ]  Weekly mean percentage uptake of hydrocarbons by the test plants at various levels of soil contamination with used motor oil (UMO). (a) control (0% UMO treatment) (b) 1% UMO treatment (c) 5 % UMO treatment (d) 10% UMO treatment. Mu, Mariscus umbellatus; Fm, Fimbistylis miliacea; To, Torulinium odoratum; Cl, Cyperus ligularis; Ce, Commelina erecta, Bb, Bothriochloa bladhii.
    Weekly mean percentage uptake of hydrocarbons by the test plants at various levels of soil contamination with used motor oil (UMO). (a) control (0% UMO treatment) (b) 1% UMO treatment (c) 5 % UMO treatment (d) 10% UMO treatment. Mu, Mariscus umbellatus; Fm, Fimbistylis miliacea; To, Torulinium odoratum; Cl, Cyperus ligularis; Ce, Commelina erecta, Bb, Bothriochloa bladhii.
(우)06579 서울시 서초구 반포대로 201(반포동)
Tel. 02-537-6389 | Fax. 02-590-0571 | 문의 : oak2014@korea.kr
Copyright(c) National Library of Korea. All rights reserved.