The soil organic carbon (SOC) stored in the Arctic has been of great interest in recent discussions on global climate change, due to the high amount of carbon (C) storage and vulnerability (Schuur et al. 2008). Although the permafrost regions in the northern latitude cover 16% of soil area, it is estimated that about 1,400–1,850 Pg of C is stored in Arctic soil (McGuire et al. 2009, Tarnocai et al. 2009). The low temperatures in the Arctic have prevented the decomposition of organic matter, thus leaving a high proportion of SOC in the Arctic vulnerable to microbial degradation once temperatures increase (ACIA 2004, Dutta et al. 2006, Schuur et al. 2008). However, the studies on SOC storage and quality in the Arctic have been mainly conducted in boreal and arctic ecosystems such as Alaska and Siberia (Hobbie et al. 2000, Dutta et al. 2006, Mishra and Riley 2012). The high Arctic tundra regions have gained relatively less attention in terms of the storage or characteristics of SOC. Recently, Burnham and Sletten (2010) estimated the amount of SOC stored in the high Arctic as 12 Pg and showed that previously reported values have underestimated the actual SOC storage. They also pointed out that general information regarding SOC in the high Arctic has been very limited.
There are several factors influencing SOC accumulation and distribution, with soil forming factors considered important parameters in the interpretation of SOC concentrations (Finzi et al. 1998, Burke et al. 1999). Many existing studies on SOC distribution in the high Arctic have been conducted in glacier retreat regions (Hodkinson et al. 2003, Nakatsubo et al. 2005, Kabala and Zapart 2012). Soil organic matter (SOM) accumulation along the chronosequence has been a traditional topic as a parameter of soil development following glacial retreat (Matthews 1992). The SOM accumulation rate in the Arctic is relatively slower than in temperate and tropical regions due to the harsh nature of the environment (Hodkinson et al. 2003). Hodkinson et al. (2003) showed that the SOM significantly increased after 150 years, and Bekku et al. (2004) reported significant differences in the SOC content of sites which became ice-free more than 2,000 years ago, and another young site (ice-free for less than 30 years) in the glacier foreland in Svalbard. That is to say, time has proven to be a critical factor in the interpretations of SOC accumulation and distribution in the Arctic.
In addition to the age of soil, disturbances play an important role in determining the quantities and distribution of SOC. Thus, SOC stored in areas affected by cryoturbation has been studied considerably (Bockheim and Hinkel 2007, Kaiser et al. 2007). Cryoturbation in cold regions has the potential to alter general SOC distribution, with higher concentrations of SOC on the surface and an exponential decrease of SOC with depth. Cryoturbation could transport surface carbon to a deeper soil profile or, conversely, expose materials found in deep soil to the surface (Schaetzl and Anderson 2005). In addition to cryoturbation, topographical and geomorphological features (e.g., altitude or shape of land) have the ability to influence the direction of wind or water flow, thus changing the distribution of SOC (Doetterl et al. 2012). The mechanisms of detachment, transport, and deposition, and variation in factors related to soil erosion have been greatly studied over the last 15 years (Berhe et al. 2008), and further understanding the redistribution of SOC is essential for quantification of the global carbon budget (Van Oost et al. 2007, Lal and Pimentel 2008). In the high Arctic tundra regions, the topography consists of hilly areas where snow and glacial melting has altered soil surface features. These processes have the ability to influence SOC distribution as well. Despite the significance of these processes, however, existing studies on SOC distribution related to geomorphology are very limited in the high Arctic.
Carbon storage and turnover in soil is directly related to the quality of available SOC (Torn et al. 2009). Since the SOC consists of a heterogeneous mixture of C substrates, there are many physical and/or chemical approaches to distinguish labile, slow, and recalcitrant fractions of SOC (Sollins et al. 1996, Wander 2004). Each fraction can provide information about the sensitivity of SOC pools to external changes, long-term C sequestration, etc. (Wander 2004). One popular method for SOC characterization is physical fractionation depending on density and size. By using dense liquids, Golchin et al. (1994) separated SOC into two different fractions: (1) light fraction (LF), being composed of fresh or partially decomposed plant materials and (2) heavy fraction (HF), which is associated with minerals. Although SOC fractionation has been widely used in many soil studies, SOC characterization with Arctic soil has been poorly studied (Paré and Bedard-Haughn 2011). Therefore, this study pursued the influence of geomorphological features over SOC distribution in the high Arctic. We also tried to understand the characteristics of SOC in the high Arctic by using a fractionation method.
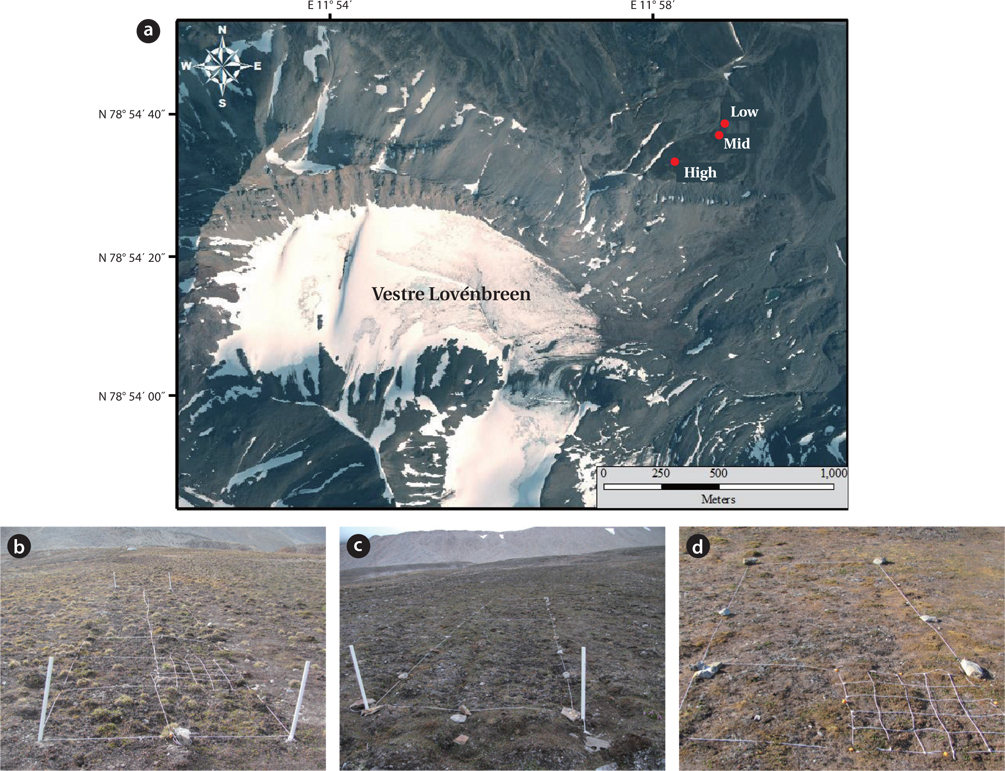
This study was conducted on the exterior of the Vestre Lovénbreen moraine in the Ny-Ålesund area, Svalbard, Norway. The average annual air temperature and precipitation in Ny- Ålesund were -6.3ºC and 385 mm respectively (Norwegian Meteorological Institute). Since the Little Ice Age (at the end of the last century), mild climate resulted in the significant decrease of glacier in Svalbard (Haldorsen and Heim 1999). Three study sites (High, Mid, and Low) were chosen based on the altitude and differences in levels of vegetation establishment. The High site (78º54′33.92″ N, 11º58′0.14″ E, elevation 53 m) is located directly below the glacial drift (Fig. 1). According to the map from Haldorsen and Heim (1999), the most apparent glacial terminus was formed in 1921, with the High site located about 50 m from the moraine. The Mid site (78º54′38.48″ N, 11º58′30.25″ E, elevation 27 m) is located approximately 220 m northeast from the High site, and the Low site (78º54′39.67″ N, 11º58′33.93″ E, elevation 23 m) is approximately 50 m away from the Mid site (Fig. 1). The Low site was located very close to the stream. All three sites were selected for being slightly higher than their surroundings and for being located in between the stream paths where water was not flowing during the sampling period.
>
Vegetation survey and aboveground biomass measurement
Ten quadrates (1 × 1 m) were established in each site for plant investigation in August 2011. All vascular plants occurring in the quadrates were recorded, and their coverage percentages were estimated visually. The importance value for each species was calculated by measuring the average value of both relative frequency and relative coverage at each site. Species nomenclature was followed by Rönning (1996). Three additional quadrates (0.5 × 0.5 m) were established for measuring plant aboveground biomass. All aboveground parts of vascular plants located inside of the quadrate were harvested, and their weights were measured after drying at 60ºC for 48 h.
Soil sampling was conducted after the vegetation survey. Soil samples were collected from depths of 0–5, 5–10, and 10–15 cm below ground surface at each of the three points, and then pooled together by depth to make one replicate sample (Kimble et al. 2001). Thus, a total of three replicate soil samples were collected from each site. Soil samples were moved to the lab in the Korea Arctic Research Station (i.e., DASAN) and oven-dried at 45ºC, and sieved through a 2-mm sieve for further soil analyses.
>
Soil physical and chemical analyses
Soil for textural analysis was treated with H2O2 to remove organic matter. A sand size fraction was determined by wet sieving, and silt and clay fractions were determined by using Micrometrics Sedigraph 5120 (Micromeritics, Norcross, GA, USA). The sedigraph data were processed for modal size analysis by the method of Jones et al. (1988). Soil was ground using a Ball mill and passed through a 250-µm sieve. Total carbon (TC) and total nitrogen (TN) contents were measured following combustion at 950ºC using an elemental analyzer (FlashEA 1112; Thermo Fisher Scientific, Waltham, MA, USA) (Nelson and Sommers 1996), and total inorganic carbon (TIC) content was determined by CO2 gas production using a CO2 coulometer (CM5014; UIC Inc, Joliet, IL, USA) after treating powder soil sample with 42.5% phosphoric acid at 80ºC for 10 minutes. The SOC content was calculated by subtraction of TIC and coal-carbon (coal-C) contents estimated by density fractionation from TC contents. To characterize SOC, density-size fractionation was performed (modified from Six et al. 1999). Thirty mL of sodium polytungstate solution (SPT, density 1.55 g cm-3) was mixed with 10 g of the soil, and the floating materials (free light fraction, FLF) were collected by using pre-combusted GF/A filters (Paré and Bedard-Haughn 2011). Used SPT solution was recycled according to the method from Six et al. (2000). The remaining soil (HF) was dispersed with 0.5% sodium hexametaphosphate solution, shaking for 18 h, and wetsieved through a 53-µm sieve (Six et al. 2002). The materials on the sieve were the sand + iPOM (particulate organic matter occurring within aggregates) fraction, and this fraction passed through a 53-µm sieve was mSOC (mineral- associated SOC). All soil fractions were dried at 45ºC after fractionation. Sand +iPOM and mSOC fractions were acid-washed with 1 M HCl to remove inorganic carbon. Coal pieces were manually removed from the FLF with the aid of a microscope, and they were then weighed. All fractions were weighed, ground using a pestle and mortar, and then passed through a 250-µm sieve for SOC and TN analyses.
Prior to statistical analysis, the normality of data and constant variance of errors were examined. One-way ANOVA model was used to test whether there were differences between any of the means in three sites (R Development Core Team 2011). When significant differences were observed (
>
Plant coverage, importance value, and aboveground biomass
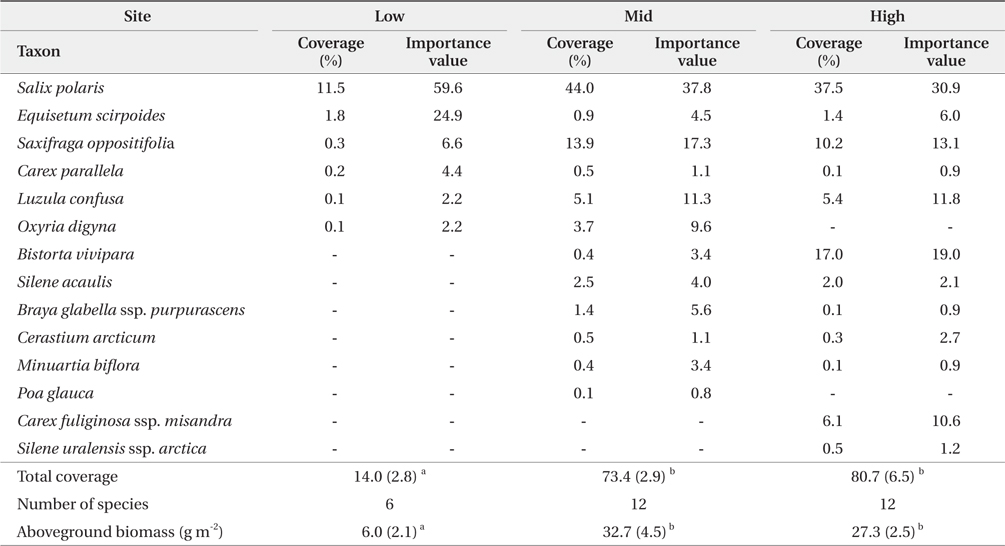
Most measured parameters in plants were similar between High and Mid sites, while lower numbers of plant species, plant coverage, and aboveground biomass were observed at the Low site. While 12 plant species were recorded in both the High and Mid sites, only six species were observed in the Low site (Table 1).
[Table 1.] Vegetation index and aboveground biomass in the study sites

Vegetation index and aboveground biomass in the study sites
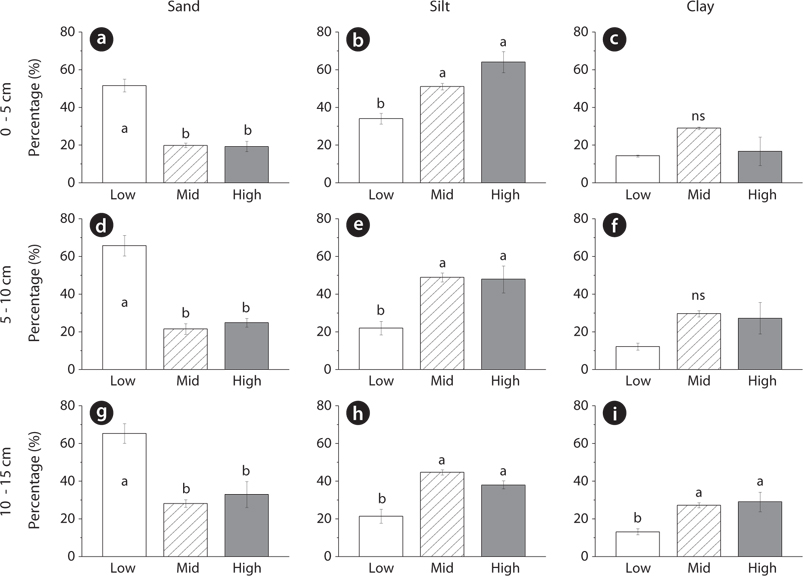
Soil texture in the Low site was different from that in the Mid and High sites, while the contents of sand, silt, and clay measured in the Mid site were similar to those measured in the High site. On the other hand, sand content in the Low site accounted for more than 50% in samples collected from all three depths, which was significantly higher than measurements from the Mid and High sites (
>
SOC distribution and characterization
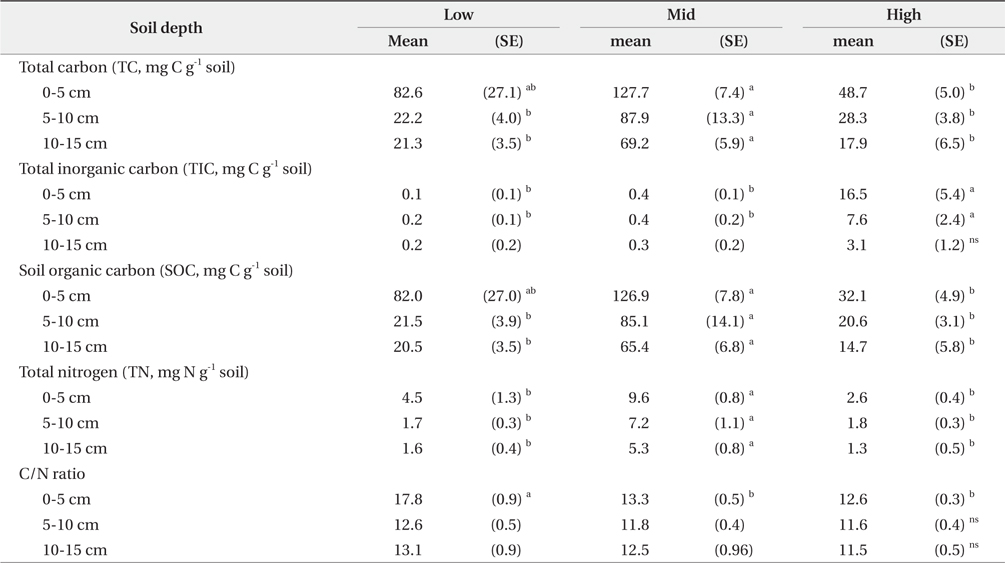
The TC, SOC, and TN contents of the Mid site were higher than those measured for the Low and High sites (Table 2). The SOC content for samples collected from a 0–5 cm depth was in order of Mid, Low, and High sites. The SOC content in the Mid site (126.9 mg C g-1 soil) was four times higher than that of the High site for 0–5 cm depth, however there were no other statistical differences between the Mid and Low sites and between the High and Low sites for samples collected from the 0–5 cm depth (Table 2). SOC contents in the Mid site were 85.1 and 65.4 mg C g-1 soil for 5–10 and 10–15 cm depths, respectively, and these were significantly higher than those measured for the other two sites (
[Table 2.] Soil chemical properties in the study site
Soil chemical properties in the study site
The SOC content in the High site was much lower than the Mid site, however vegetation parameters in the High site were similar to the Mid site (Table 1, 2). This discrepancy could be explained by the location of the High site in close proximity to the most apparent recent glacier moraine in 1921 (Haldorsen and Heim 1999). Thus, it is possible that the High site had been affected by glacial advances prior to 1921. The low SOC content in the High site could also be associated with the unconsolidated glacier drifts, which could have been moved to the High site.
The Low site showed a higher SOC content with very sparse vegetation cover when compared to the Mid site. In view of its low vegetation cover and high sand content (Table 1, Fig. 2), we could infer that the Low site has been previously disturbed. Since the Low site is the farthest from the glacier moraine and close to the Mid site, the soil surface should have been covered with vegetation similar to the Mid site under no significant disturbances. Aerial images have shown changes in the stream width around the sampling area in the past (data not shown). In addition, the Low site was very near to the stream with an altitude lower than the other sites. This geographical location would have made the Low site susceptible to runoff disturbances from glaciers and/or snow melt. There was also a historical report for the high glacier mass losses over the Vestre Lovénbreen during the period of 1966–1977 (Etzelmoüller and Sollid 1996). These glacier mass changes would have affected the discharge and runoff. The increased discharge would have resulted in increased sediment transport (Etzelmoüller and Sollid 1996). Therefore, a higher proportion of sand particles might have been left in the Low site after fine silt and clay particles were transported by the highly active glacier/snow melt stream.
While the TIC content was very low as 0.1–0.4 mg C g-1 soil in the Low and Mid sites, the High site contained 16.5 mg C g-1 soil as a TIC form, which constituted about 34% of the total TC contents (Table 2). TN contents followed similar trends to the SOC contents at all three depths. The C/N ratio for the 0–5 cm depth in the Low site was 17.8, which was significantly higher than the ratios calculated for the other two sites (
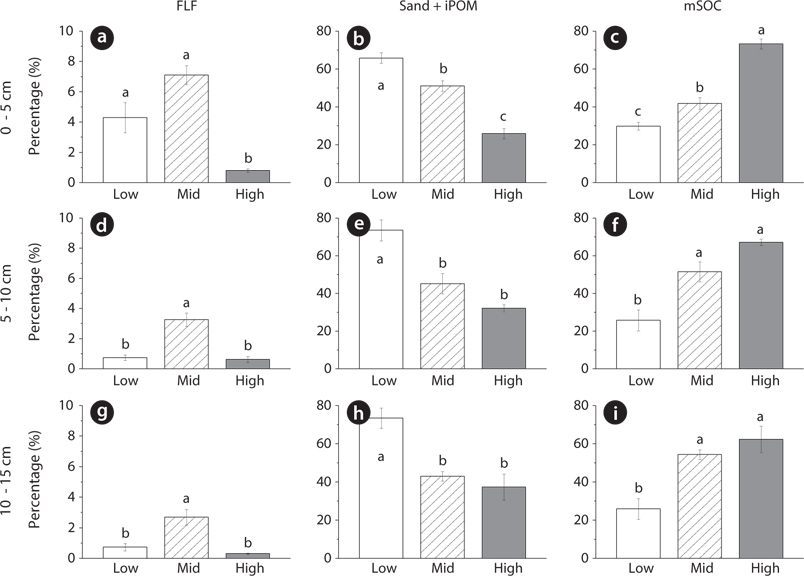
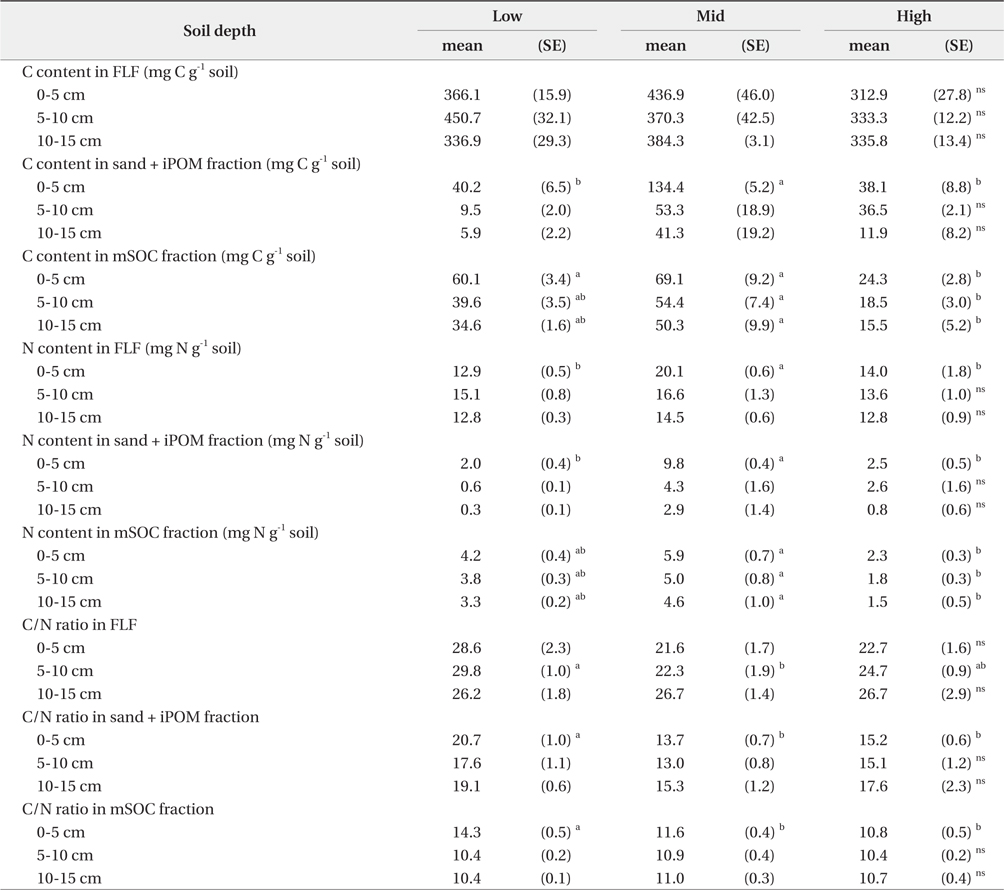
Free light fraction (FLF) among the density-size fractions was higher in the Mid than in the High site (Fig. 3). While soil from the High site was comprised of 1% of FLF and 99% of HF, the Mid site soil contained 7% of FLF and 93% of HF (Fig. 3). This means that the Mid site contained more fresh and un-decomposed materials than the High site. The low amount of FLF in the High site directly relates to the low content of SOC. A short period of vegetation growth after de-glaciation in the High site could be one of the reasons for the low amount of FLF. The mass ratio of FLF was significantly higher in the Low and Mid sites than in the High site at the 0–5 cm depth, however at greater depths the FLF ratio in the Mid site was solely higher than that of the other two sites. The amount of FLF generally decreased as depth increased. C and N contents in FLF were not different among the study sites with the exception of N content at the 0–5 cm depth (Table 3).
[Table 3.] C and N contents in each fraction after density-size fractionation
C and N contents in each fraction after density-size fractionation
Despite low vegetation cover in the Low site, the organic carbon content, amount of FLF, and C storage ratio in FLF were comparable to the Mid site for samples collected from the 0–5 cm depth (Table 2, Figs. 3 and 4). Free light fraction generally contains fresh or less decomposed plant residues. It is, therefore, highly labile and has a short turnover time. However, FLF could also contain the low density of coal materials (Spycher et al. 1983, Elliott and Cambardella 1991). We observed the composition of FLF through microscopy and found coal pieces in samples from all three sites. To avoid the contribution of coal-C to SOC, we removed coal particles from the FLF under microscopy. The coal in this study area was found to have about 60% C and 1% N (data not shown), thus even small amounts could affect the organic C content. When we calculated the ratio of coal-C to organic C content, the coal-C generally accounted for less than 3% of organic C prior to coal removal. However, there was a case in which 8% of organic C came from coal-C in the Mid site sample collected from the 10–15 cm depth. The existence of coal-C was not a result of soil development, but could be included with the amounts of SOC if the coal was not removed appropriately. Therefore, caution should be exercised in interpreting the organic carbon content in the coal-contaminated area.
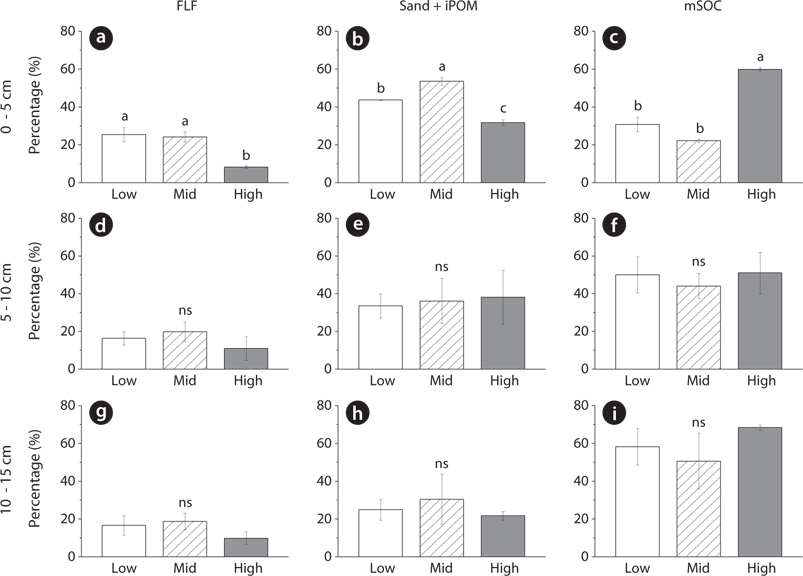
While the mass ratio of sand + iPOM fraction was the greatest in the Low site, the amount of the mSOC fraction was found to be the highest in the High site (Fig. 3). C and N contents in HF decreased with depth. This trend was more evident for the sand + iPOM fraction because while the amount of the sand particles increased, the associated iPOM decreased with depth as shown in Table 3. In the mSOC fraction, the C and N contents in the Mid site were significantly higher than those measured in the High site. The C content in the mSOC fraction was higher in the Low site than High site, but the amount of C stored in the mSOC fraction was similar in both sites due to a higher mass of the mSOC fraction in the High site (Table 3, Fig. 4). In most cases, the total amount of C and N stored in each fraction was significantly higher in the Mid site than the other two sites (Fig. 4). While the mSOC fraction was found to comprise a large proportion of the HF in the High site, C associated with the sand + iPOM fraction was the highest proportion in the Mid site at the 0–5 cm depth (Fig. 4). Despite finding a similar soil texture between the two sampling locations, the difference in the major C storage fraction would indicate different SOC protection mechanisms occurring between High and Mid sites. While the SOC protection in the High site would consist mainly of mineral association by silt and clay particles, SOC protection by soil structure (such as aggregation) could also have played a role in the Mid site since the sand + iPOM fraction was obtained after the disruption of aggregates (Six et al. 2002, Lützow et al. 2006).
Our study provided detailed data on SOC in the high Arctic. There have been previous reports about the amount of SOC in Svalbard; however, the quality and individual characteristics of the SOC had not been incorporated. Moreover, there are several important factors for dealing with SOC in the high Arctic. Investigations for SOC and plants close to the glacial moraine showed that the geographical location could influence the distribution of SOC and that SOC accumulation was slower than vegetation establishment. In addition to the geographical location, disturbances should be considered as a critical factor in interpreting SOC and vegetation distribution. Lastly, quantification of SOC should be conducted cautiously when soil contains a certain amount of coal-C.