Robinia pseudoacacia has become invasively naturalized in Japan. We investigated the role of sexual reproduction in the development of R. pseudoacacia riparian forests along the Chikumagawa River in Japan, by using five chloroplast (cpSSR) and seven nuclear (nSSR) markers. We identified eight chloroplast haplotypes and 147 nuclear genotypes from 619 R. pseudoacacia trees sampled in three plots (Plots A, B, and C) and along two line transects (Lines D and E). CpSSR analyses showed that multiple maternal lines were distributed along the river, and that some haplotypes from different populations overlapped. In addition, while Plots A and B were separated by a short distance, only these two plots exhibited genetic differentiation in the haplotypes. In the nSSR analysis, all pairwise FST values among the three plots were significantly different from zero. Kinship analysis based on nSSR markers revealed that kinship connected many individuals to another individual from the same plot. These results indicate that seed dispersal near to mother trees contributes to the fine-scale genetic structure of R. pseudoacacia riparian forests. Our results indicate that sexual reproduction, in addition to asexual reproduction, is a major contributor to the fine-scale formation of R. pseudoacacia forests.
The establishment of an invasive woody species in a habitat that would normally be inhabited by native species might alter ecosystem functioning, consequently having a major impact on native ecosystems (Vitousek 1990, Parker et al. 1999). To address this issue, it is essential to understand how the propagules of such species disperse from the parent plants. While an accurate history of the expansion of a naturalized species is difficult to obtain, the radiation of some invasive plants has been demonstrated through historical records of naturalization assimilated via landscape-scale analyses (Landenberger et al. 2009) and population-genetic analysis (Bossdorf et al. 2005, Rosenthal et al. 2008, Sakio 2009, Pairon et al. 2010). For example, landscape-scale information, such as aerial photographs and GIS, indicate that the
After the establishment of
Our research group has previously used dendroecological and microsatellite polymorphism analyses to investigate the regeneration process of
In our previous study, various sizes of
To improve our understanding about the radiation of
>
Study site and sample collection
The current study was conducted in
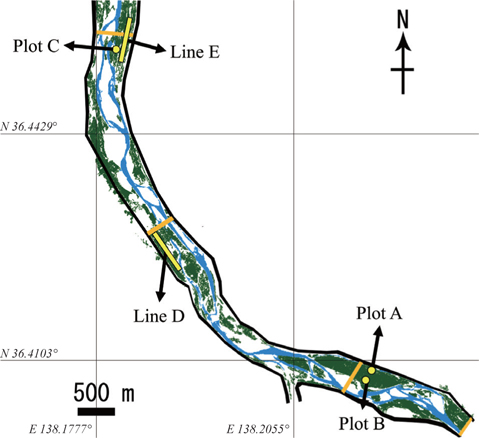
We established three plots (Plots A, B, and C) and two transect lines (Lines D and E) along the river banks of the middle section of the Chikumagawa River, where large
Plots A, B, and C were 60 × 30 m, 30 × 30 m, and 30 × 30 m in size, respectively. The average tree diameter at breast height (DBH) in all plots ranged from 9 to 14 cm (Kurokochi et al. 2010). Lines D and E were both approximately 600 m in length, and were established parallel to the river bank. Line E passed Plot C at a distance of 10 m (Fig. 1).
Because most
>
PCR amplification and length determination of cpSSR and nSSR markers
DNA was extracted from each fragment using a modified cetyltrimethylammonium bromide (CTAB) method (Kurokochi et al. 2013). Five cpSSR markers (Ropscp03, Ropscp04, Ropscp06, Ropscp07, and Ropscp08) developed by Kimura et al. (in press), three nSSR markers (Rops05, Rops06, and Rops08) developed by Lian and Hogetsu (2002), and four nSSR markers (RP109, Rp200, RP206, and RP01B) developed by Mishima et al. (2009) were used in this study. All types of markers were amplified by PCR in a manner similar to that reported by Kurokochi et al. (2010). PCR products were electrophoresed using a Hitachi SQ5500E analyzer (Hitachi, Tokyo, Japan), and their lengths were determined using FRAGLYS ver. 3 (Hitachi). To avoid misreading the band sizes, the PCR products that were preliminarily judged as being the same length in the first electrophoregrams were re-electrophoresed side by side to confirm this.
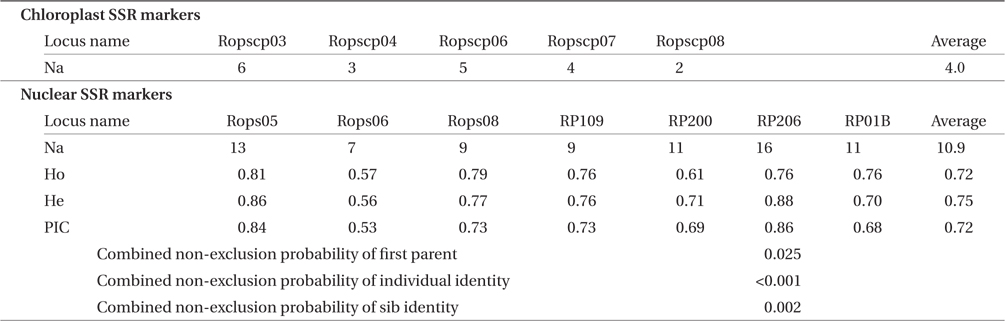
Regarding the five cpSSR markers, the number of alleles (Na) that were detected at each marker was visually counted. For the seven nSSR markers, the number of alleles (Na), observed heterozygosity (Ho), expected heterozygosity (He), polymorphic information content (PIC) of each marker, and combined non-exclusion probabilities of all nSSR markers were evaluated using CERVUS 3.0.3 (Marshall et al. 1998). In the analysis, trees of the same nSSR genotype and the same cpSSR haplotype with no mismatching on each locus were regarded as belonging to the same genet and the same maternal line, respectively.
Genetic differentiation among plots was evaluated using a dendrogram constructed based on pairwise genetic distances for all samples using the neighbor-joining (NJ) method of the Populations 1.2.30 (Langella 2007) from datasets of nSSR markers. Pairwise
The presence of potential kinship between nuclear genotypes was tested at a significance level of 0.001, using KINGROUP ver. 2 (Konovalov et al. 2004) from the nSSR markers by 10,000,000 random permutations. Genotype pairs, in which the relationships of full-siblings, half-siblings, or parent-offspring were detected, were regarded to have kinship.
>
Chloroplast haplotypes (cp-haplotypes) and nuclear genotypes (n-genotypes)
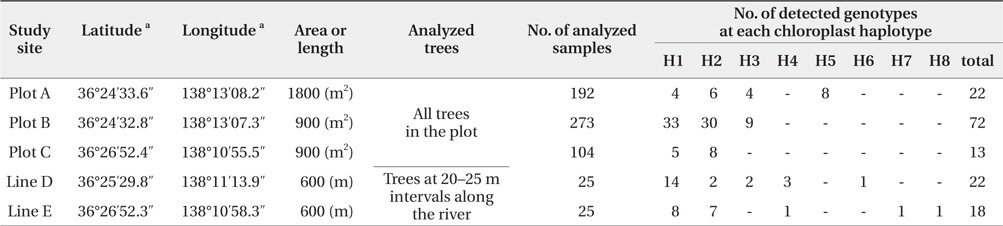
We successfully completed PCR amplification of cpSSR and nSSR markers in 192 samples from Plot A, 273 samples from Plot B, 104 samples from Plot C, 25 samples from Line D, and 25 samples from Line E (Table 1).
[Table 1] Baseline data at each study site using chloroplast and nuclear microsatellite markers
Baseline data at each study site using chloroplast and nuclear microsatellite markers
The five cpSSR markers contained between two and six alleles, with an average of four (Table 2). In Plots A, B, and C, and Lines D and E, four, three, two, five, and five cphaplotypes were found, respectively, with a total of eight unique cp-haplotypes being present (Table 1). Cp-haplotypes H1 and H2 were found in all Plots and Lines.

Traits of five chloroplast and seven nuclear microsatellite markers of Robinia pseudoacacia based on 147 individual nuclear genotypes
The seven nSSR markers were highly variable, containing between nine and 16 alleles, with an average of 10.9 alleles. The averages of Ho, He, and PIC were 0.72, 0.75, and 0.72, respectively (Table 2). The combined non-exclusion probability of the first parent was 0.025, and genotypic consistency probabilities between two unrelated individuals and between two unrelated siblings were < 0.001 and 0.002, respectively (Table 2). Since the probability of genet discrimination ability by the present analysis using seven nSSR markers was high (Table 2), ramets with the same n-genotype were assumed to belong to the same clonal genet. In Plots A, B, and C, and Lines D and E, we identified 22, 72, 13, 22, and 18 n-genotypes, respectively, with a total of 147 n-genotypes being present (Table 1). Each n-genotype was found at only one study site.
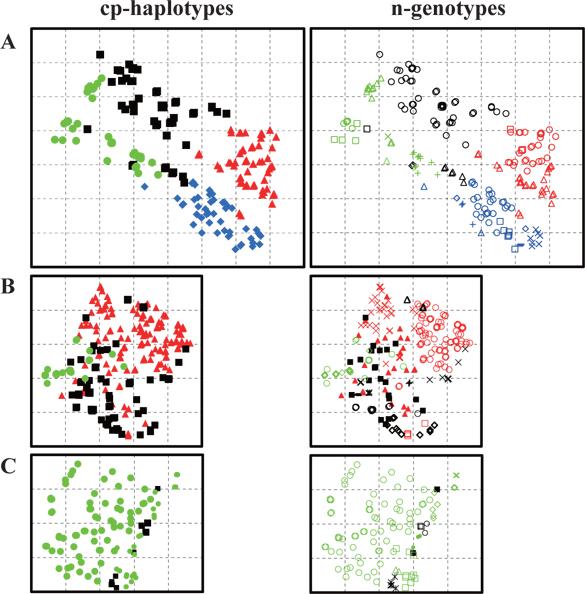
Trees with the same cp-haplotype (i.e., maternal line) were aggregated (Fig. 2), with some being included in different n-genotypes (i.e., genets) (Table 1). Trees in the same genet were continuously established in clusters, and always belonged to the same maternal line (Fig. 2). In cases where a certain n-genotype was detected in more than one tree within each population, we selected one tree as a representative of the n-genotype, and used its n-genotype and cp-haplotype for the analyses in this study.
>
Genetic differentiation among Plots
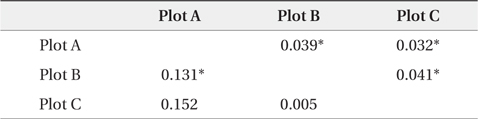
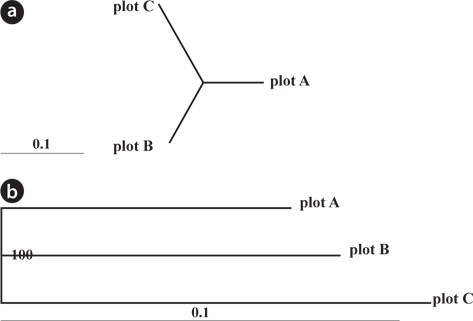
The dendrogram and NJ tree revealed that the plot populations were genetically differentiated, and the populations in Plots A and B were marginally close (Fig. 3). For pairwise
[Table 3.] Pairwise FST' values by nuclear and chloroplast microsatellite markers

Pairwise FST' values by nuclear and chloroplast microsatellite markers
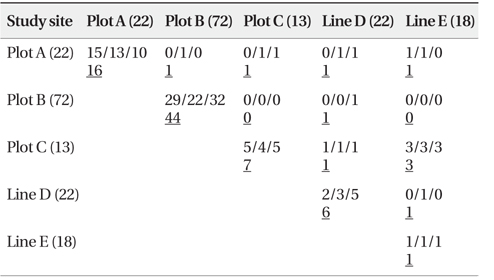
As shown in Table 4, a total of 84 n-genotype pairs were detected to have kinship. Kinship was primarily recorded between two n-genotypes within the same plots or lines. Only a few pairs were between n-genotypes of spatially different plots and/or lines (Table 4).
[Table 4.] Number of pairs connected by kinship site-by-site (Full-sibs/Half-sibs/Parent-offspring)

Number of pairs connected by kinship site-by-site (Full-sibs/Half-sibs/Parent-offspring)
In this study, cpSSR and nSSR polymorphism analyses provided information about the reproduction process leading to the initiation of
>
Fine-scale genetic structure of R. pseudoacacia
CpSSR analyses showed that multiple maternal lines were distributed along the river, and that some haplotypes from different populations overlapped (Table 1). These results were similar to the distribution patterns recorded for
As for nuclear DNA analyses, with respect to several invasive woody plants, an absence of genetic structure, which is related to geographical distance, has been previously reported at a broad (country-wide and/or landscape) scale (Dunphy and Hamrick 2005, Aldrich et al. 2010, Le Roux et al. 2011). At the same scale, studies using nuclear DNA polymorphism analysis have also reported this trend for
>
Relationship among R. pseudoacacia trees
Kinship analysis provided insights into the seed propagation (sexual reproduction) of
In most cases,
>
Fine-scale initiation and maintenance of R. pseudoacacia riparian forests
Only a small number of
In our previous study (Kurokochi et al. 2010), we provided information on the regeneration and distribution characteristics of developed
The combined results of our current research (sexual reproduction) and previous research (asexual reproduction and forest regeneration; Kurokochi et al. 2010) allowed us to elucidate the process of
Our result was one of the reminders that the asexual and sexual reproductive ability of