To understand the effects of fluctuations in dam discharge due to river environments and phytoplankton communities, we monitored such environments and phytoplankton communities biweekly, from February 2001 to February 2002 and from February 2004 to February 2005, in the lower Han River (LHR), South Korea. The phytoplankton abundance during the dry season was approximately two times higher than that during the rainy season. In particular, fluctuations in diatom assemblages, which constituted over 70% of the total phytoplankton abundance, were affected severely by the changes in the discharge. When a large quantity of water in a dam was discharged into the LHR, the conductivity and the concentrations of total nitrogen (TN), total phosphorus (TP), and dissolved inorganic phosphorus (DIP) decreased rapidly, whereas the concentrations of suspended solids (SS), dissolved inorganic nitrogen (DIN), and dissolved silica (DSi) increased immediately. Time-delayed relationship also revealed that the dam discharge had an immediately significant negative relationship with phytoplankton abundance. On the whole, fluctuations in phytoplankton communities in the LHR were influenced much more by hydrodynamics such as dam discharge than by the availability of nutrients. Thus, the variability in these concentrations usually parallels the strength of river flow that is associated with summer rainfall, with higher values during periods of high river discharge.
The flow of most rivers worldwide is regulated by channelization or the construction of dams (Dynesius and Nilsson 1994). Diverse hydraulic conditions could be influenced by the control of a river’s flow, thereby affecting the dynamics of aquatic organisms (Lamouroux and Capra 2002). In particular, fluctuations in the phytoplankton communities of many regulated rivers are affected by increases in the water flow due to dam discharge (Humborg et al. 1997). The release of water held behind a dam can wash away much of the phytoplankton biomass downstream of the dam. In contrast, stagnation of water flow can increase the density of phytoplankton abundances. However, this can impede the purification of water for human use and the toxicity that is shown by certain species of phytoplankton, such as
Phytoplankton in rivers are sensitive aquatic organisms, the spatiotemporal distribution of which is controlled by both abiotic (water flow, nutrients, and water temperature, etc.) and biotic (competition and grazing, etc.) mechanisms (Hutchinson 1961). Although grazing by predators, including zooplankton and fish, contributes to changes in phytoplankton communities, spatiotemporal fluctuations of such communities are caused primarily by changes in abiotic variables (Sellner et al. 1993). Of these, high-velocity water flow (as a result of heavy precipitation or the discharge of dams) has been found to result in major shifts in the abundances and compositions of phytoplankton assemblages (Hallegraeff 1993). Each group of phytoplankton communities in a regulated river system can undergo different spatial and temporal changes due to nutrient levels as well as water flow. In a region downstream of the Three Gorges Dam (the world’s largest dam), a small diatom,
Given the current state of research, the objectives of the present study were to gain increased understanding of fluctuations in phytoplankton communities in the regulated river system and to characterize the association of these fluctuations with dam discharges and environmental factors. The results were then integrated over spatial and temporal scales to determine the impact of dam discharge on phytoplankton communities and environmental factors.
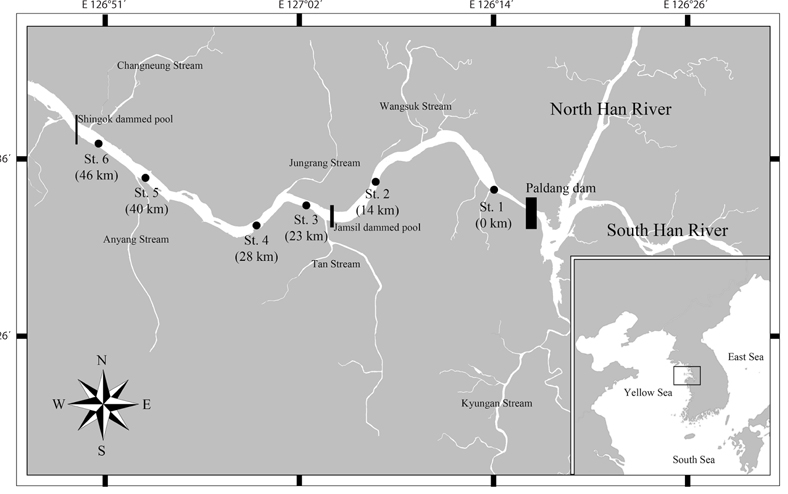
The Han River is one of the longest and largest rivers in South Korea. The channel of the river is 482 km in length and it has a drainage basin with a total area of 26,018 km2. The river is used as the main source of drinking water for more than 25 million residents in the Seoul metropolitan area. Jeong et al. (2007) reported that rainfall during the summer season (June to September) in South Korea provides 50-60% of the annual total, whereas limited precipitation during the winter (December to February) provides much less (approx. 10%). For flood control, supply of water, and hydropower generation, nine dams have been constructed along the Han River. Among these, the Paldang Dam (the dam furthest downstream) directly regulates flow and prevents flooding in the Seoul metropolitan area. The water in the Paldang Reservoir is retained for shorter periods (approx. 5-7 days) than that in the other reservoirs along the river. The LHR is defined as the part of the river located from downstream of the Paldang Dam to the entrance of Kyunggi Bay in the Yellow Sea, and it flows through the city of Seoul. During periods of heavy rainfall, when a large amount of water flows from the Paldang Reservoir into the LHR, the retention time in the LHR is approximately 1-2 days and the water flows rapidly into Kyunggi Bay in the Yellow Sea (Kim et al. 1998). The hydrological dynamics of the LHR are controlled mainly by the discharge schedules for the Paldang Dam. In the late 1980s, two small reservoirs (Jamsil and Shingok) were constructed downstream of the Paldang Dam to control water levels and for recreational activities.
>
Sample collection and analysis
Water samples for measurement of ambient physico-chemical factors were obtained at six sites in the LHR at biweekly intervals (a total of 51 samplings) from February 2001 to February 2002 and from February 2004 to February 2005 (Fig. 1). The samples were collected at a depth of 0.5 m by using a 2 L horizontal Niskin sampler at each sampling site between 9:00 and 11:00 AM. Water temperature, dissolved oxygen (DO), pH, and conductivity were measured with subsampling using portable meters: YSI-85 and YSI-63 models (YSI Inc., Yellow Springs, OH, USA). Biological oxygen demand (BOD), chemical oxygen demand (COD), and SS were measured according to the method of the American Public Health Association (APHA 1995). To determine chlorophyll
Samples for the enumeration and identification of phytoplankton species were collected in a 1000 mL sterilized polyethylene bottle that contained 900 mL of subsample, and immediately fixed with a glutaraldehyde solution at a final concentration of 2%; then, they were concentrated by natural sedimentation for 24 hours. Over 500 phytoplankton cells in each sedimented sample were counted using a Sedgwick-Rafter counting chamber at ×400 magnification under a light microscope (Axioskop 40; Zeiss, Oberkochen, Germany). We recorded the relatively common species, which were defined as those that constituted more than 1% of the total and those with an abundance of more than 105 cells mL-1. During the identification of phytoplankton species, the dataset of all phytoplankton communities was divided into six major taxonomic groups, which were identified in accordance with the commonly used nomenclature: Bacillariophyceae, Chlorophyta, Cryptophyta, Cyanophyta, Dinophyceae, and Euglenophyta.
Means and standard deviations were calculated for the data collected at the six sampling sites. To examine significant relationships between abundances of phytoplankton and environmental factors in the LHR, Pearson’s correlation analysis and one-way ANOVA were used. Pearson’s correlation analysis was used to reveal directly the correlation between environmental changes and phytoplankton abundance, and the ANOVA enabled us to determine the potential differences between rainy and dry seasons in terms of the abundance of phytoplankton and the effects of environmental factors. In the ANOVA, significant differences were tested by Scheffe’s post hoc test.
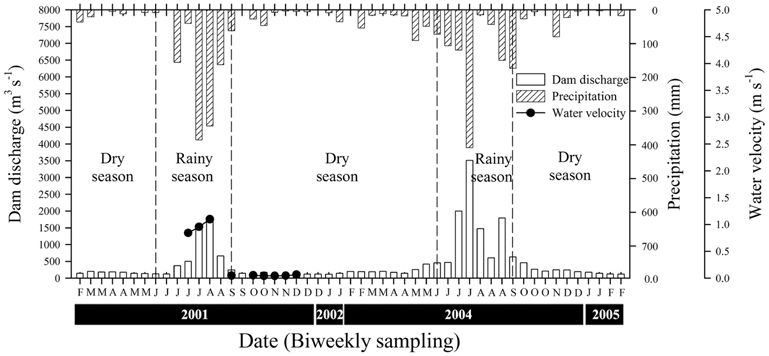
The mean values for precipitation were 7.06 ± 8.17 mm during the rainy season and 0.98 ± 1.26 mm during the dry season (Fig. 2). During the rainy season, the mean volume of water discharged by the Paldang Dam into the LHR was 1,108 m3 s-1, but this fell to 157 m3 s-1 during the winter (dry season). There was a positive correlation between precipitation and discharge, with a coefficient of 0.76 (
>
Changes in environmental factors
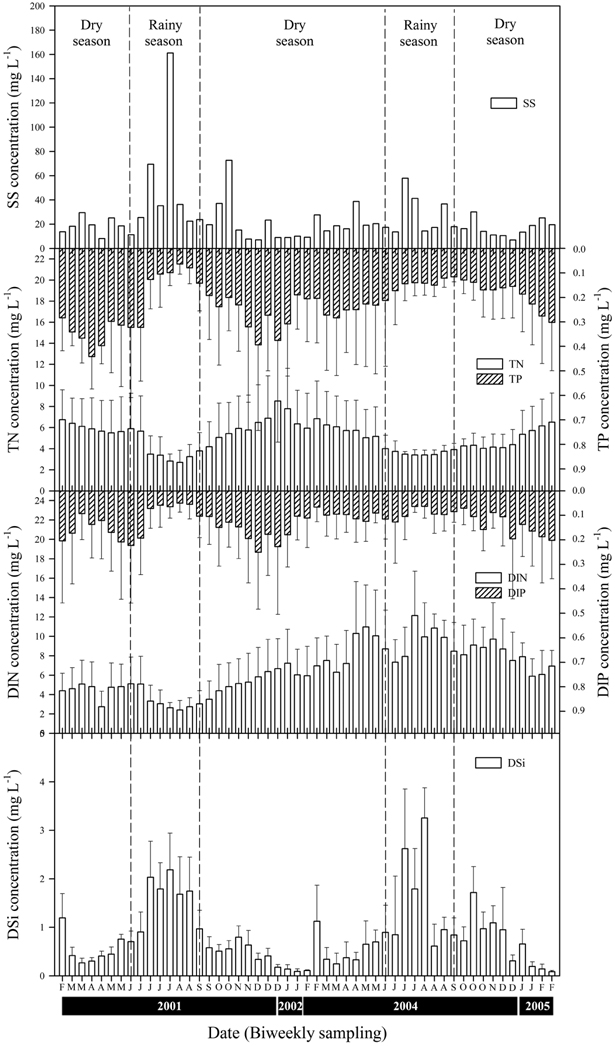
The LHR was eutrophic on the basis of TN (mean value: 4.78 mg L-1), TP (0.21 mg L-1), and chlorophyll
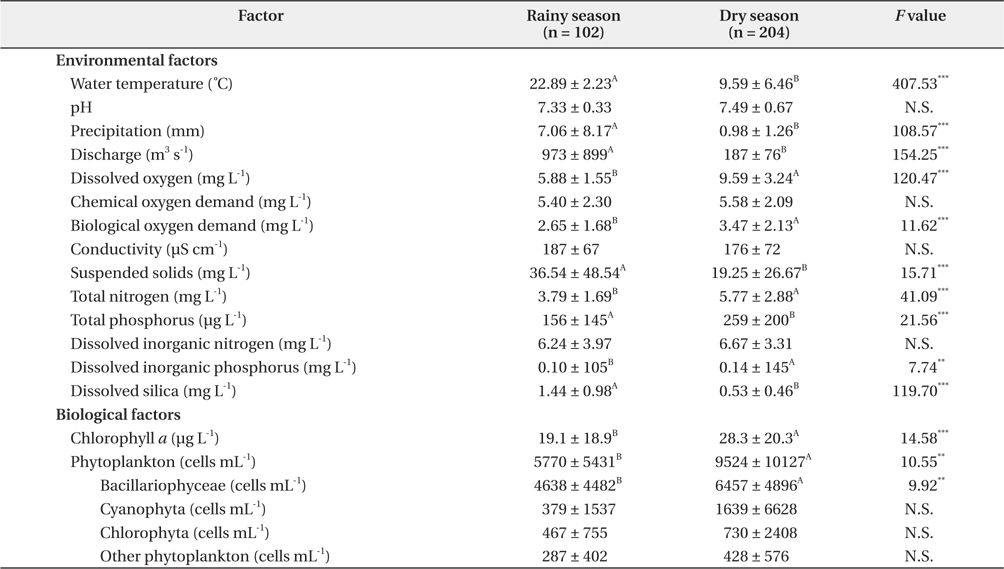
Differences between rainy and dry seasons in terms of environmental and biological factors in the lower Han River
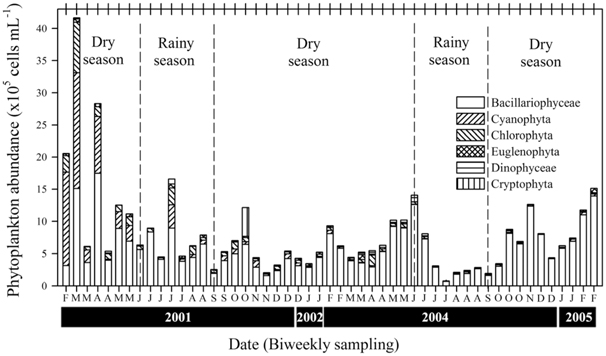
A total of 437 phytoplankton taxa were identified in the LHR, and were distributed among the following taxonomic groups: Bacillariophyceae (203), Chlorophyta (169), Cryptophyceae (6), Cyanophyta (37), Dinophyceae (5), and Euglenophyta (17). The mean density of the total abundance of phytoplankton was 5.80 ± 4.48 × 10⁵ cells mL-1 during the rainy season, whereas the abundance was higher during the dry season at 9.14 ± 7.70 × 10⁵ cells mL-1 (Fig. 4). A change in chlorophyll
>
Time-delayed effect of dam discharge on environmental factors and phytoplankton communities
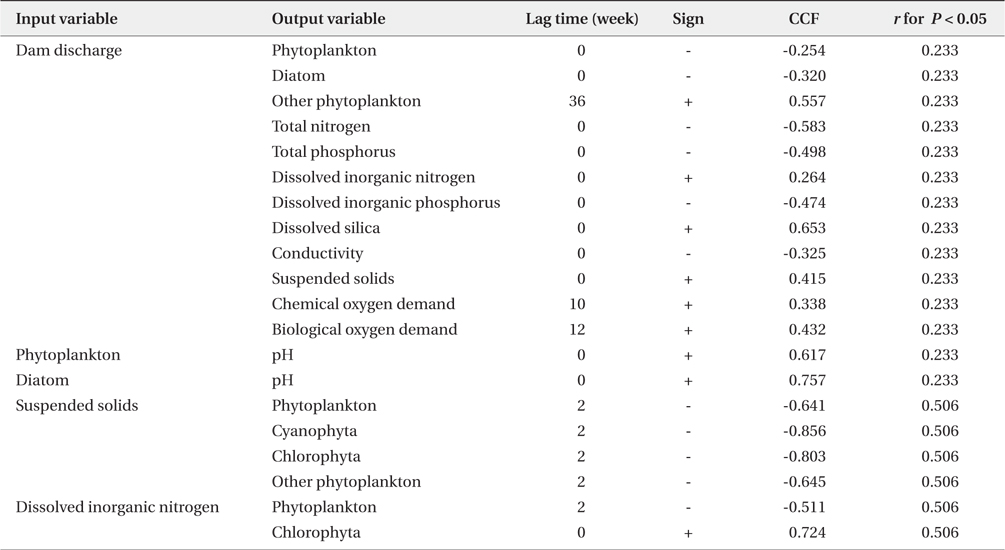
Significantly, dam discharge was correlated positively with precipitation and concentrations of SS (

Summary of significant cross-correlation between dam discharge and biotic/abiotic factors. Significant cross-correlation coefficients factor (CCF) is given as r and its sign (n = 51)
In the LHR, the density of phytoplankton during the dry season was approximately two times higher than that during the rainy season. Many reports of studies in channelled river systems have shown the importance of the control of the flow and amount of water by a dam for the increase (dry season) or decrease (rainy season) of phytoplankton abundance. For example, fluctuations in the biomass of
Eutrophication in an ecosystem causes phytoplankton abundance to increase, species diversity to decrease, and dominant biota to change. In particular, more species were present during the dry season, which may serve as an indicator of the strong eutrophication of a body of water (Mason 2002). Diatom blooms tend to occur in spring and autumn, whereas an admixture of Chlorophyta and cyanobacteria appears during summer (Gosselain et al. 1994). In the LHR, Chlorophyta and cyanobacteria cannot accumulate in blooms during summer because of the fast flow of the river due to high precipitation and discharge. As mentioned above, the Nakdong River exhibits frequently
Dam discharge had a direct influence on the water quality, such as levels of turbidity and nutrients; however, these effects are unusual and are unlikely to occur in most channeled rivers. The quantity of dam discharge, and the interval and frequency of discharge, are important for the control of water quality. When a large quantity of water was discharged into the LHR, the conductivity and the concentrations of TN, TP, and DIP decreased rapidly, whereas the concentrations of SS, DIN, and DSi increased immediately. Shapiro and Wright (1984) reported that the TN and TP concentrations in Round Lake in the USA increased in summer during the period of high rainfall. These increases may be associated with the accumulation of particulate nutrients, including manure, and/or aquatic organisms entering the lentic ecosystem. However, in the lotic system studied herein the concentrations of TN and TP were reduced rapidly during seasons of rainfall. Ha et al. (1998) found that the concentrations of TN and TP in the rainfall run-off were decreased rapidly in the Nakdong River. The increase in the concentrations of SS, DIN, and DSi might be due to upwelling from bottom sediments by the high-velocity flow or release from the land by rainfall. McKee et al. (2001) stated that the concentrations of nitrogen and phosphorus in the Richmond River of Australia varied seasonally, with greater proportions of inorganic nitrogen and phosphorus during the rainy season, whereas the minimum nutrient concentrations were found 2-3 months after flood discharge. These changes in factors are similar to the finding of Humborg et al. (1997), such that hydrolytic factors, including discharge and precipitation, are among the most important factors that influence fluctuations in nutrient levels. Thus, the variability in these concentrations usually parallels the strength of river flow that is associated with summer rainfall, with higher values during periods of high river discharge (Domingues et al. 2012).
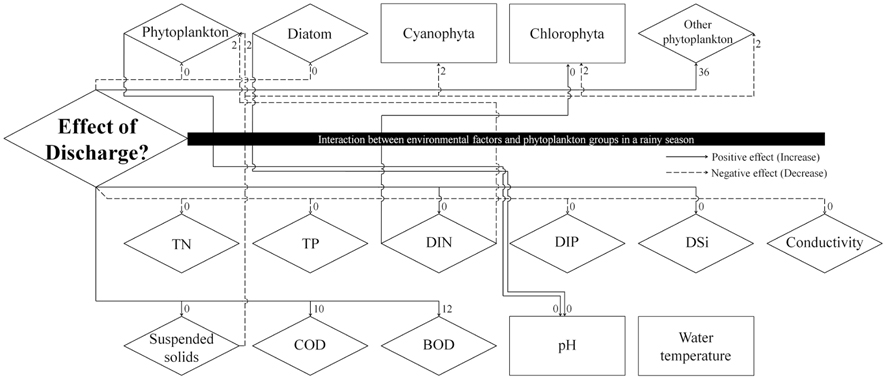
The time interval between a dam discharge and its effect on phytoplankton, environmental factors, and their interaction remains an important issue. Fig. 5, produced by a result of cross-correlation analysis (Table 2), shows the effect of dam discharge on phytoplankton communities and abiotic factors related to the river, as well as the interaction between phytoplankton and abiotic factors. The results show that dam discharge caused a rapid decrease in the total phytoplankton, diatom abundances, and concentrations of TN, TP, and DIP, but a rapid increase in the concentrations of SS, DIN, and DSi. On the whole, fluctuations in phytoplankton communities in the LHR were influenced much more by hydrodynamics than by the availability of nutrients. In relation to the interaction between phytoplankton communities and nutrients, DIN concentrations were only associated with a change in the abundance of Chlorophyta, which is a minor taxon that contributes little to the total phytoplankton abundance, in particular during the rainy season. Domingues et al. (2012) stated that diatoms abundance was correlated positively with nitrate concentration, which was in turn regulated by river flow. However, in our results, diatom assemblages were less abundant during the rainy season, even though the nitrate concentration increased during this period. Our results indicate that soluble nutrients may be taken up less effectively by phytoplankton in rivers with a rapid flow. When discharge from a dam occurs, phytoplankton abundance in the river decreases rapidly due to the short hydraulic retention time. In contrast, phytoplankton abundance in the river increased due to the long retention time (Dynesius and Nilsson 1994). For example, after the Columbia River in the USA was dammed, phytoplankton biomass increased due to the combined effects of reduced flow velocity, increased water retention time, and decreased vertical mixing intensity (Sullivan et al. 2001). A similar situation has been observed in some reservoirs and regulated rivers, as well as rapidly flushed impoundments (Søballe and Kimmel 1987).
The status of phytoplankton downstream of the Paldang Dam on the LHR can be categorized in terms of four key temporal periods that are related to changes in the water inflow as a result of dam discharge. First, towards the end of winter (dry season), small centric and pennate diatoms, as well as cyanobacteria, develop in response to increased nutrient availability, light intensity, and water temperature, as well as a long retention time. Second, when discharge from the dam occurs during summer, with its heavy rainfall, the crop of phytoplankton is swept away by the high-velocity flow. At the same time, concentrations of SS, DIN, and DSi are increased rapidly by run-off from the land. As a consequence, phytoplankton decreases in abundance rapidly. Third, after the rainy season, autumn phytoplankton crops start to accumulate. Among them,