There has been a rapid increase of the concern on the space radiation effect on pilots, crew and passengers at the commercial aircraft altitude (~ 10 km) recently. It is because domestic airline companies, Korean Air and Asiana Airlines have just begun operating the polar routes over the North Pole since 2006 and 2009 respectively. CARI-6 and CARI-6M are commonly used space radiation estimation programs which are provided officially by the U.S. federal aviation administration (FAA). In this paper, the route doses and the annual radiation doses for Korean pilots and cabin crew were estimated by using CARI-6M based on 2012 flight records. Also the modeling concept was developed for our own space radiation estimation program which is composed of GEANT4 and NRLMSIS00 models. The GEANT4 model is used to trace the incident particle transports in the atmosphere and the NRLMSIS00 model is used to get the background atmospheric densities of various neutral atoms at the aircraft altitude. Also presented are the results of simple integration tests of those models and the plan to include the space weather variations through the solar proton event (SPE) prediction model such as UMASEP and the galactic cosmic ray (GCR) prediction model such as Badhwar-O’Neill 2010.
It is known that the origins of the space radiation on the Earth consist of the following three; the galactic cosmic ray (GCR) from the deep space, the solar energetic particles (SEP) from the Sun, and the energetic protons in the Earth’s inner radiation belt. The space radiations are ionizing radiations that ionize the incident energetic particles into the atmosphere by interaction with atmospheric neutral atoms and produces the secondary particles causing radiation. Generally low energy particles are cut off by the Earth’s geomagnetic field, but relatively high energy particles (a few tens of MeV) penetrate into the atmosphere. Most of the current space radiation estimation programs consider just only the cosmic ray effects which are relatively stable so far. However large space weather events such as the solar proton events (SPEs) might increase the space radiation level comparable to GCR. Sometimes SPEs can increase the space radiation dose rates a few times more than the normal dose rates. For an accurate calculation of the space radiations, such temporal but large effects should be considered especially for the polar routes.
Korean airline companies have begun operating the polar routes since 2006. Stakeholders and even the public have started wondering how much radiation they are exposed to per flight. So the in-flight measurement experiments of space radiations were performed in 2009 for the safety of flight attendants and passengers (Hwang et al. 2010). Actually this paper is the execution report of the suggestions from the pre-study for the project of space radiation forecast model development in 2012 on the polar routes (Hwang & Shin 2012). In this paper, the progress of the design of the model to include the space weather effects into our own space radiation estimation program is reported and the estimation is performed for the route doses and the annual doses of pilots and crew using popular CARI-6M program based on 2012 flight records.
2. THE SPACE RADIATION ESTIMATION IN COMMERCIAL FLIGHTS USING CARI-6M
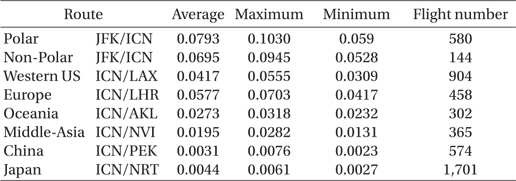
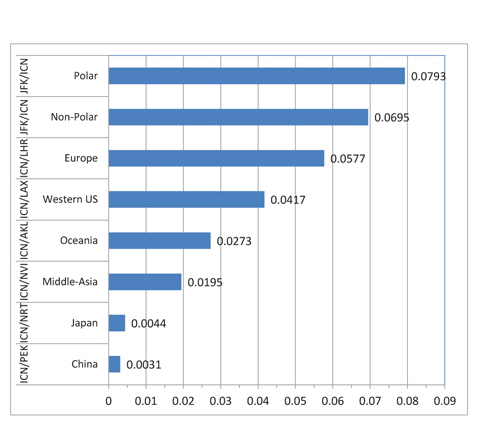
Prior to making the conceptual design of our own space radiation estimation program, all route doses were estimated for all international flights from Seoul/Incheon international airport. Fig. 1 shows the results of the route doses for all international flights from Seoul/Incheon airport using CARI-6M based on the flight records in 2012. As it is expected, the polar route shows the highest radiation exposure of 0.0793 mSv per flight on average. It is notable that non-polar route shows comparable but slightly lower radiation dose of 0.0695 mSv. Usually the polar route is optional only for the return flights from Eastern US of New York or JFK airport. For the flights from China or Japan, the radiation exposures are much smaller than those of the flights from US or Europe; in addition, the radiation exposure is less than 0.001 mSv for domestic flights. For an exact comparison, the averages, the minimum and the maximum radiation doses for each route and total flight numbers for each route are shown in Table 1. It is surprising that the maximum radiation dose of the polar route is larger than 0.1 mSv considering that the annual limit of radiation exposure dose for the public is just 1 mSv. In this case, the accumulated radiation dose from just ten polar route flights might exceed the annual limit of exposure dose.
[Table 1.] Average, maximum, minimum and flight numbers on routes (mSv, 2012).

Average, maximum, minimum and flight numbers on routes (mSv, 2012).
2.2 Comparison between pilots and cabin crew
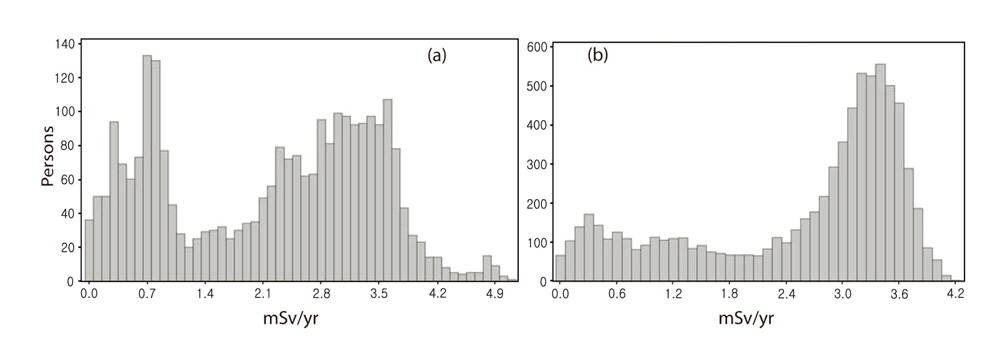
Fig. 2 shows the comparison of the annual radiation dose distributions between (a) pilots and (b) cabin crew based on 2012 flight records. Fig. 2a shows that there are outstanding two peaks for the pilots’ radiation exposure. One peak is located around 0.7 mSv and the other is located around 3.5 mSv, which are clearly caused by two branches of flights; domestic and international. Usually the annual radiation exposures of domestic flights are less than 1 mSv which is the annual dose limit for the public on the ground. But for the cabin crew, there is just one peak centered at about 3.3 mSv. It is found that annual radiation doses for both pilots and cabin crew are below the annual dose limits for the flight attendants in US (6 mSv) and Japan (5 mSv). Table 2 shows the more detailed information of the number of persons corresponding to each level of space radiation. It is noted that there were two pilots whose radiation doses are over 5 mSv. Table 3 shows the maximum values for each year during the last five years of 2008-2012 and there was the violation of the annual dose limit of 5 mSv in 2009 also.
[Table 2.] Annual radiation dose of pilots and cabin crew (mSv, 2012).
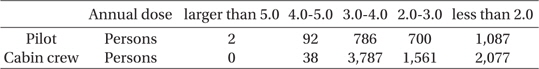
Annual radiation dose of pilots and cabin crew (mSv, 2012).
[Table 3.] Maximum annual radiation dose during recent five years (mSv/yr).
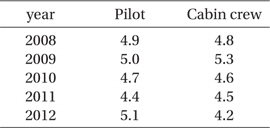
Maximum annual radiation dose during recent five years (mSv/yr).
3. DESIGN OF THE SPACE RADIATION CALCULATION PROGRAM
CARI-6 is the sixth major release of GCR dose calculation software developed by the FAA. The software is beneficial to the FAA and the public and is used as a tool for investigating health effects of ionizing radiation in the atmosphere by the scientists. It provides GCR dose estimates for past flights and also serves as a verified radiation monitoring tool to aid the aviation industry and the individuals in their radiation protection programs. CARI-6/6M uses the LUIN model for a radiation transport code. CARI-6 is based on the last major revision of the galactic cosmic radiation transport code LUIN (LUIN2000, released in 2000). The last minor variant of LUIN2000 (LUINNCRP) was delivered to the FAA in 2003 and the effective doses were reported as defined in National Council on Radiation Protection and Measurements Report 116 (NCRP 116). The LUINNCRP was revised to produce several dose outputs such as an ambient dose equivalent (
One of the primary shortcomings of LUIN is the use of so called “superposition approximation” for the atmospheric transport of heavy ions. In the superposition approximation, once the heavy ion enters the atmosphere it is transported as an equivalent collection of independent protons and neutrons with the same energy per nucleon as the original ion (e.g., an alpha particle with a kinetic energy of 10 GeV/nucleon would be transported as 2 free protons and 2 free neutrons each with 10 GeV kinetic energy).
CARI-7 which is under development concurrently, will not use LUIN as the primary transport code because of such shortcomings. Instead, doses will be calculated from the database of GCR atmospheric particle fluences calculated by using the general purpose Monte Carlo radiation transport program MCNPX 23 (or possibly MCNP6), developed at Los Alamos national laboratory (LANL) in the U.S. The advantage of this will be an avoidance of the superposition approximation treatment of hadronic showers used by LUIN. Unlike LUIN, the usage of MCNPX does not require this approximation.
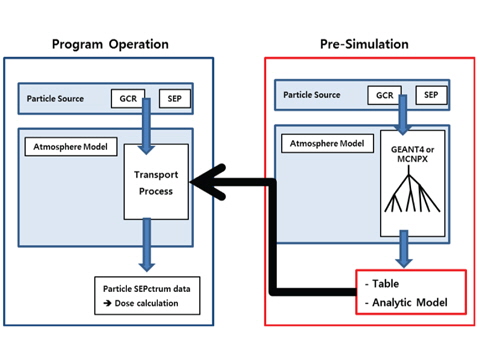
In this study, in order to avoid such shortcomings, it is decided to use Monte-Carlo code GEANT4. The GEANT4 is designed to handle practically almost all physical processes that a particle would undergo when passing through a material. Especially, at the aircraft altitude, neutrons are the majority species and are produced as the secondary particles of interactions between incident particles and atmospheric atoms, which could be well accounted for in the GEANT4 code. Relatively longer running time is the shortcoming of GEANT4, therefore, the pre-arranged simulations are constructed using all possible combinations of input values, and several Look-Up-Tables are generated in the end for real-time now-casting and forecasting of the space radiations. Fig. 3 shows the diagram of the space radiation estimation program.
The left box in Fig. 3 indicates the real time operation process of the model and the right box shows the prearranged simulations consisting of the following three different parts; (1) particle sources from GCR and SEP, (2) the atmospheric model producing the background neutral atom density profiles, and (3) the particle transport interacting with atmospheric neutral atoms. The results of such pre-simulations could be saved as a table matrix and an analytic formula.
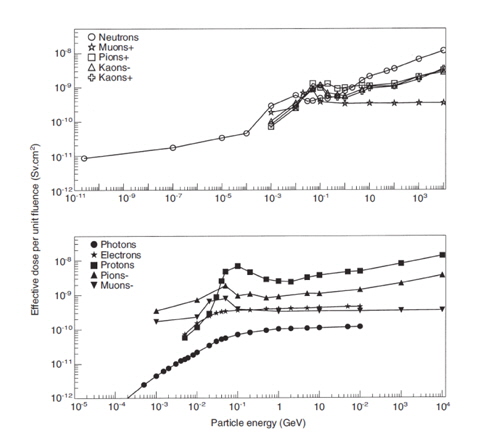
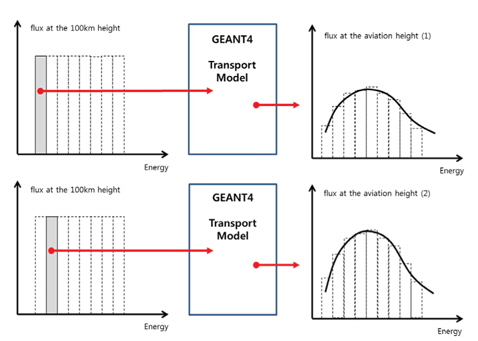
The pre-simulation consists of the following processes. The ambient volume of the atmosphere of ~ 100 km height is divided into 10 bins. It is assumed that particles in each bin have the same energy and the same population. One test particle in a bin might be simulated independently following its transport into the atmosphere of different altitudes, and the secondary particle fluence spectrum is produced to be used as a new input in the next step (Fig. 4). Final aircraft altitude radiation spectrum can be obtained by using the fluence-dose conversion constants provided by ICRP 103 (the latest version of ICRP) (ICRP 2007).
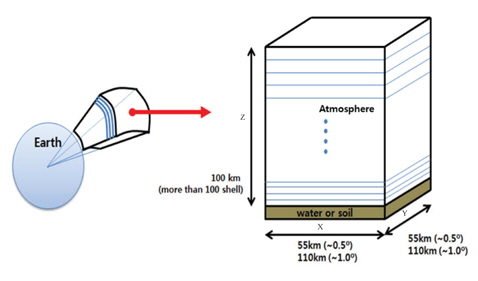
As a result of the repeated simulations with particles of various energies, the final particle spectra at the flight altitude would be able to be obtained as the data table. Likewise, the several species of particles (protons, neutrons and electrons etc.) and the altitude under the sea level (sea or land) are also considered in the pre-simulation. And finally, the data table that includes a variety of conditions can be configured. The pre-simulation geometry is shown in Fig. 5. Z-axis direction is vertical to the Earth’s surface ranging from 0 km to 100 km altitude and the basic simple geometry is assumed to be a rectangular parallelepiped. For X and Y-axis directions, the optional length of the 55 km or 110 km is used, which corresponds 0.5° and 1.0° each at the Earth’s surface when the Earth’s radius is 6378 km. The vertical height of 100 km is divided into 100 or more layers of air density in Z-axis direction, in addition, the height of each layer can be subdivided in more detail for specially sensitive layers. Each layer has a different atmospheric density and different composition ratio, which are from the output of NRLMSIS00 atmospheric model (Fig. 5).
3.2 Space radiation calculation
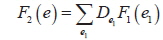
In the actual radiation dose calculation, the data table obtained from the pre- simulations is used to get the secondary particles’ spectrum in the flight height. During pre-simulation process, the arbitrary standardized particles are assumed as the primary particle sources, however, in the actual radiation dose calculation, GCR and SPE model would provide the primary particles’ spectra. By using GCR and SPE models’ spectra as the primary incident particles, the same transport process used to create the data table is applied to each energy-bin. Such process is summarized in the following formula.

Here
3.3 Integration test of GEANT4 and NRLMSIS00
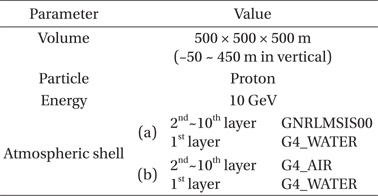
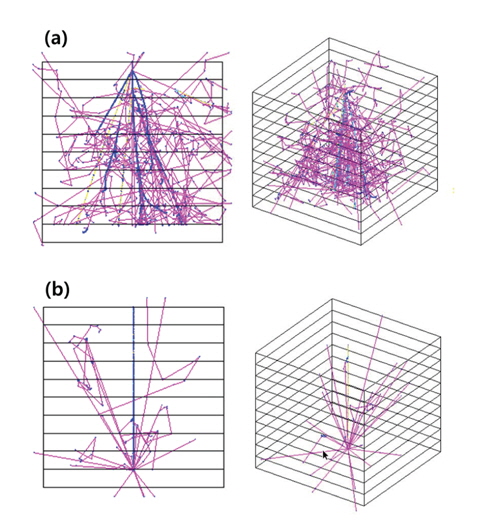
Using a simple geometry, the basic integration tests were performed between the GEANT4 and the NRLMSIS00. Although the real geometry is 100 km height box, in order to confirm that the interface between two huge programs works properly the test is performed using a simple 500 m height box. The box is divided into ten layers of equal spacing and all layers except the bottom layer are treated as a standard air (G4_AIR provided by GEANT4). The bottom layer is treated as G4_WATER to include the reflection from the sea surface. Table 4 summarizes the simulation parameters for GEANT4 and Fig. 7 shows the typical two types of trajectories of a 10 GeV proton incidence. Fig. 7a indicates the particle shower by a 10 GeV proton which passes through the air (G4_AIR profile) to generate the secondary particles (mostly neutron). The blue line indicates the original incident proton and the pink lines reflected in all directions indicate neutrons. The resulting particles have a wide range of energy values and energy dependent weighting factors are used for the final conversion into the radiation dose. Fig. 7b shows the weak response of the incident proton until reaching the bottom layer, the surface of the water. In this case, the secondary particles generated by the interaction with the air are only a few, but the secondary particles generated by the collision with the surface of the water are significant. Some of those secondary particles would go upward direction again and affect the radiation dose at the flight altitude.
[Table 4.] Simulation parameters for simple GEANT4 run.
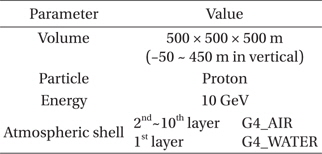
Simulation parameters for simple GEANT4 run.
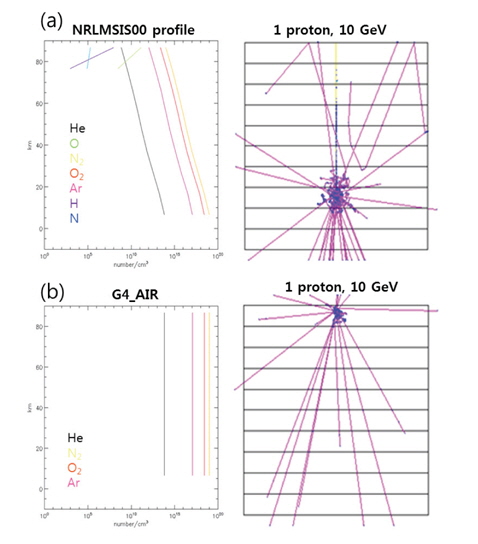
For more realistic simulation, the simple geometry was extended to 100 km in vertical direction and the background densities from NRLMSIS00 model were used. NRLMSIS00 basically produces the density profiles with He, O, N2, O2, Ar, H, and N in number/cm3 unit. Actually as the GEANT4 code itself provides a substance mix module which uses the mass density (g/cm3) and the mass ratio (fraction of mass), the output of NRLMSIS00 provided in unit of number/cm3 have to be preprocessed in advance to be used as GEANT4’s input. Simulation parameters and the typical output trajectories are shown in Table 5 and Fig. 8. Fig. 8a shows the case of using the atmospheric density profile of NRLMSIS00 and Fig. 8b shows the case of using G4_AIR profile. The bottom layer is treated as the water same as in Fig. 7.
[Table 5.] Simulation parameters for GEANT4 using different atmospheric densities profiles.

Simulation parameters for GEANT4 using different atmospheric densities profiles.
The left of the Fig. 8a shows the NRLMSIS00 density profile used and the right indicates the particle trajectory output result using the real atmospheric density’s height profile. It is interesting that there happens an explosive response and particle shower at the altitude of 10 - 20 km which is just the flying altitude. Those secondary particles, the byproduct of particle shower, might be the cause of space radiations at the aircraft altitude. Fig. 8b shows the results with the uniform density for entire altitude same as the surface, which is provided by GEANT4. There is a clear difference between two examples and it is obvious that the density profile is critical to get the exact space radiation doses depending on the height. When using the G4_AIR, because of high density of upper atmosphere, the incident proton cannot proceed into the atmosphere deeply and makes the particle shower at the top layer. Thus, it was found that the accurate atmospheric density profiles are the key to the accurate calculation of space radiation.
In this paper, the radiation doses for pilots and cabin crew were estimated by using CARI-6M program based on 2012 flight records. It was found that there are clear differences between annual radiation doses of pilots and cabin crew for the domestic and the international flights. Fortunately, there is no person over 6 mSv/yr, the annual dose limit in Korea. But it is noted that there are a few persons over 5 mSv/yr which is close to the annual dose limit suggesting that the monitoring and estimation program of the space radiation are required for the health and safety of flight attendants.
In order to develop our own space radiation estimation program, the design of the space radiation transport model into the atmosphere is established. 100 km height’s atmosphere is divided into 100 layers and the atmospheric densities of the layers are given by NRLMSIS00. Using this background density profile, GEANT4 calculate the incident particle transport from the top layer to the Earth’s surface. Through the simple integration test, it was found that the accurate atmospheric density profile is critical to finding the exact location of the particle shower which finally might cause the space radiation at the aircraft altitude. Long running time (~ few days) is a shortcoming of the GEANT4 code, especially compared to that of the deterministic code (~ few minutes) such as LUIN used in CARI-6/6M. Thus, several Look-Up-Table were generated through the pre-simulations using all possible combinations of input parameters to be able to run the model almost in real-time using the table matrix.
In the near future, we are planning to implement the space weather variation into our own space radiation transport model through the recently developed SPE prediction model such as UMASEP and the GCR prediction model such as Badhwar-O’Neill 2010.