The ionosphere is continuously observed with ionosondes in many parts of the world. Ionosondes transmit radio pulses with known frequencies in vertical direction, and receive the reflected waves from the ionosphere. Ionosondes utilize a sweep method, in which the frequency of transmitted radio waves rapidly changes from 1 to 30 MHz in a short period of time. Ionosondes are installed on the ground, and can basically make measurement up to the F2-layer, which has the maximum electron density. The highest reflected frequency, known as critical frequency, represents the electron density of the reflected layer, and sometimes the transmitted radio wave with the maximum sweep frequency may not reach to the F layer cannot be reflected if there exists a layer with higher electron density below.
The ionosonde observation produces ionograms as results. An ionogram is usually generated in 15 minute intervals, and is useful for understanding the vertical structure of the ionosphere. The x-axis of an ionogram represents the critical frequency of radio waves reflected from an ionosphere layer in units of MHz, and the y-axis indicates distance (or range) to the layer in units of km. Ionograms include information on the ionosonde model in operation and the analysis program used for the ionograms, in addition to the observatory name and the time information. In the first step, when ionograms record the frequency and reflection height using the analysis program, they present two distinctive traces from two types of waves: ordinary waves that have been unaffected by the Earth’s magnetic field and extraordinary waves that have been polarized due to the effect of the Earth’s magnetic field. Then the analysis program calculates the virtual heights using the pattern of the ordinary wave trace. In the case of the digisonde, the Automatic Real-Time Ionogram Scaler (ARTIST) program is used for the virtual height analysis. However, the virtual heights do not include the deceleration effect of radio waves due to electron density, and are not the actual heights of the reflection layers. Therefore, in the second step, the analysis program calculates the actual heights of each layer by accounting for the delay effect. The actual heights, corresponding to the critical frequencies of E-layer and F2-layer, are expressed as hmE and hmF2 (Reinisch 2009).
NmF2 is one of the ionospheric parameters in units of number of electrons per cm3, and represents the electron density of the F2-layer, which has the highest electron density in the ionosphere. NmF2 can be calculated using the following equation from the critical frequency (foF2) obtained from ionosondes (Piggott & Rawer 1972).
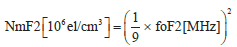
NmF2 is an important physical quantity for space weather forecasts or radio communication, and thus precise observation and accurate analysis are essential.
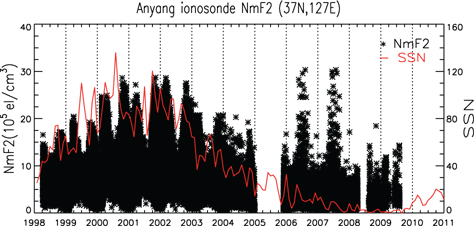
The ionosonde that was operated by the Anyang Radio Research Laboratory is a digisonde developed by the University of Massachusetts Lowell Center for Atmospheric Research (UMLCAR) in the United States. In Anyang station, the DGS-256 model was operated from 1998 to 2005, and the DPS-4 model was operated from 2005 to 2009. In 2010, the digisonde was moved to Icheon and upgraded to the DPS4D model, and the observation in Anyang was then ended. Fig. 1 shows the variations of NmF2 for the ionosphere over the Anyang region obtained by the Anyang ionosonde from 1998 through 2009, and the red line represents the changes in the number of sunspots. In general, ionospheric F-layer electron density at mid-latitudes shows a seasonal variation such as semi-annual anomaly, where it has higher values in vernal equinox/autumnal equinox than in summer/winter (Rishbeth 1998, Rishbeth & Muller-Wodarg 2006, Kim et al. 2011). As shown in the figure, the semi-annual anomaly in NmF2 was relatively distinct. However, in 2006 and 2007 which were near solar minimum, the NmF2 values abruptly increased to a great extent during the summer season (from May to September), unlike usual seasonal variations. As it occurred two years in a row, and the values increased up to the maximum values for solar maximum, this phenomenon is thought to be different from typical seasonal variations. Also, when the time for the abrupt increases of NmF2 and their duration time were examined, the phenomenon was found to have occurred quite sporadically. Therefore, it was regarded as unusual enhancements, and a study was performed to investigate the cause.
To investigate the cause of the unusual enhancements of NmF2 in the Anyang ionosonde data, we consider two hypotheses. The first hypothesis is the transient increase of electron density due to natural phenomena. If the electron density was transiently increased due to certain natural phenomena in the ionosphere, the increase would also have been recorded in GPS TEC data. Therefore, the variations of NmF2 in the Anyang ionosonde data were compared with both the Daejeon GPS TEC variations and the Jason satellite TEC variations. The Daejeon GPS TEC data were provided by the Space Geodesy Research Group, Korea Astronomy and Space Science Institute, and the dataset consisted of 30-second interval TEC’s in 2006 and 2007 when the unusual enhancements of NmF2 in the Anyang ionosonde data occurred and here we use the hourly average of the 30-second interval TECs. The variations of NmF2 in the Anyang ionosonde data were compared with the Daejeon GPS TEC variations for selected days on which the unusual enhancements of NmF2 occurred among the days when geomagnetic activity was quiet. In the case of Jason satellite TEC, the TEC variations were examined from solar maximum to solar minimum using the TEC data from 2002 to 2010. As the Jason satellite was operated at an altitude of about 1330 km, it can obtain TEC that is only relevant to the ionosphere, unlike TEC typically obtained from GPS at an altitude of 20,000 km. However, the Jason satellite data is limited to the ocean. Thus, to compare it with NmF2 of the Anyang ionosonde data, we designated a region that includes the Korean peninsula and the ocean on three sides, which corresponds to 30-45N latitude and 120-135E longitude.
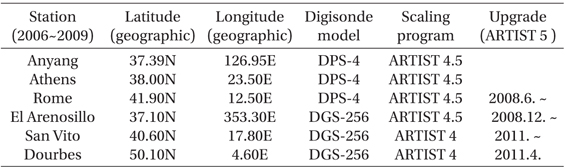
The second hypothesis for the unusual enhancements is the transient increase of NmF2 due to errors from instrumental problems of the Anyang ionosonde. The ionosonde used in Anyang in 2006 and 2007 was the digisonde DPS-4 model made by UMLCAR with an analysis program, ARTIST 4.5 version. For a consistent comparison we selected the data from the Athens, Rome, and El Arenosillo stataions located in the mid-latitudes, among the observatories using the same digisonde model and analysis program. For additional comparison, we chose the data from the San Vito and Dourbes stataions, which use a different digisonde model and analysis program (Table 1). NmF2’s for these stations were calculated from foF2’s acquired from the Space Physics Interactive Data Resource (SPIDR; http://spidr.ngdc.noaa.gov/spidr) operated by NGDC in the United States. The variations of NmF2 after 2008 when the program was upgraded to ARTIST 5 were also compared and analyzed. To investigate the detailed cause, we examined the structure of the ionosphere when the unusual enhancements occurred was, using the ionograms obtained from the ionosondes. For each analysis program version (ARTIST 4, ARTIST 4.5, and ARTIST 5), the ionograms were selected at the time when the unusual enhancements of NmF2 occurred on the days when geomagnetic activity was quiet, based on the data of the Digital Ionogram Data Base (DIDBase; http://ulcar.uml. edu/DIDBase/) operated by UMLCAR.
[Table 1.] A list of ionosonde stations and their scaling programs used in 2006~2009.

A list of ionosonde stations and their scaling programs used in 2006~2009.
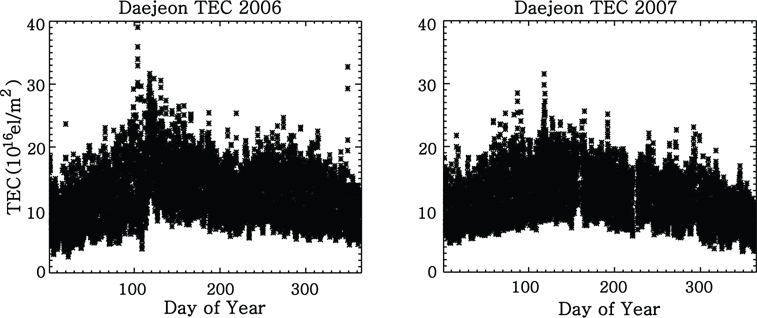
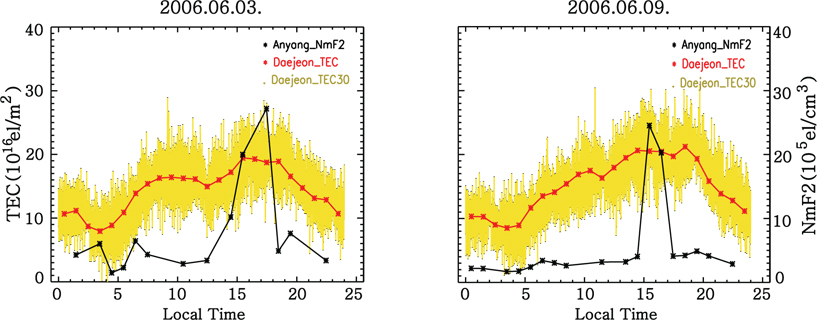
Fig. 2 shows the Daejeon GPS TEC variations for 2006 and 2007. Unlike Anyang NmF2 (Fig. 1) which increased sporadically during summer (from May through September), Daejeon GPS TEC did not show a large variation. Fig. 3 presents variations of Anyang NmF2 and Daejeon TEC on June 3 and June 9, 2006 when geomagnetic activity was quiet. The black dots represent the Anyang NmF2 values, and the yellow dots represent the 30-second interval Daejeon TEC values. The values that are the hourly averages of the 30-second interval Daejeon TEC values were shown in red dots and line. The peak of the Anyang NmF2 values was observed around 16:00 to 17:00 (LT), where the values increased by about 10 times and again returned to the original values within 3 to 4 hours. On the other hand, the Daejeon GPS TEC values did not show a sensitive variation. Especially, it was hard to find the association between NmF2 and GPS TEC, even when 30-second interval GPS TEC was examined.
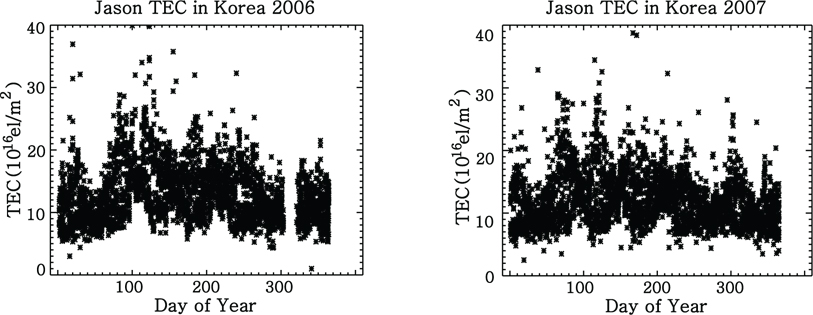
To investigate the phenomenon in more detail, it was also compared with TEC obtained from the Jason satellite (Fig. 4). As the altitude of the GPS satellite is 20,200 km, typical GPS TEC is total electron content including the plasmasphere. However, as the altitude of the Jason satellite is about 1330 km, it includes electron content that is only relevant to the ionosphere. Fig. 4 shows Jason TEC in 2006 and 2007 for the region of 30-45N latitude and 120-135E longitude, which corresponds to the Korean peninsula. In this figure, Jason TEC also showed a sporadically increasing trend, but it was not focused on the summer season, unlike Anyang NmF2 shown in Fig. 1. Accordingly, it is thought that they do not represent the same unusual enhancements. Therefore, the unusual enhancements of NmF2 are thought to be caused by a mechanical problem rather than natural phenomena, considering that Daejeon GPS TEC and Jason TEC did not show a particular increase.
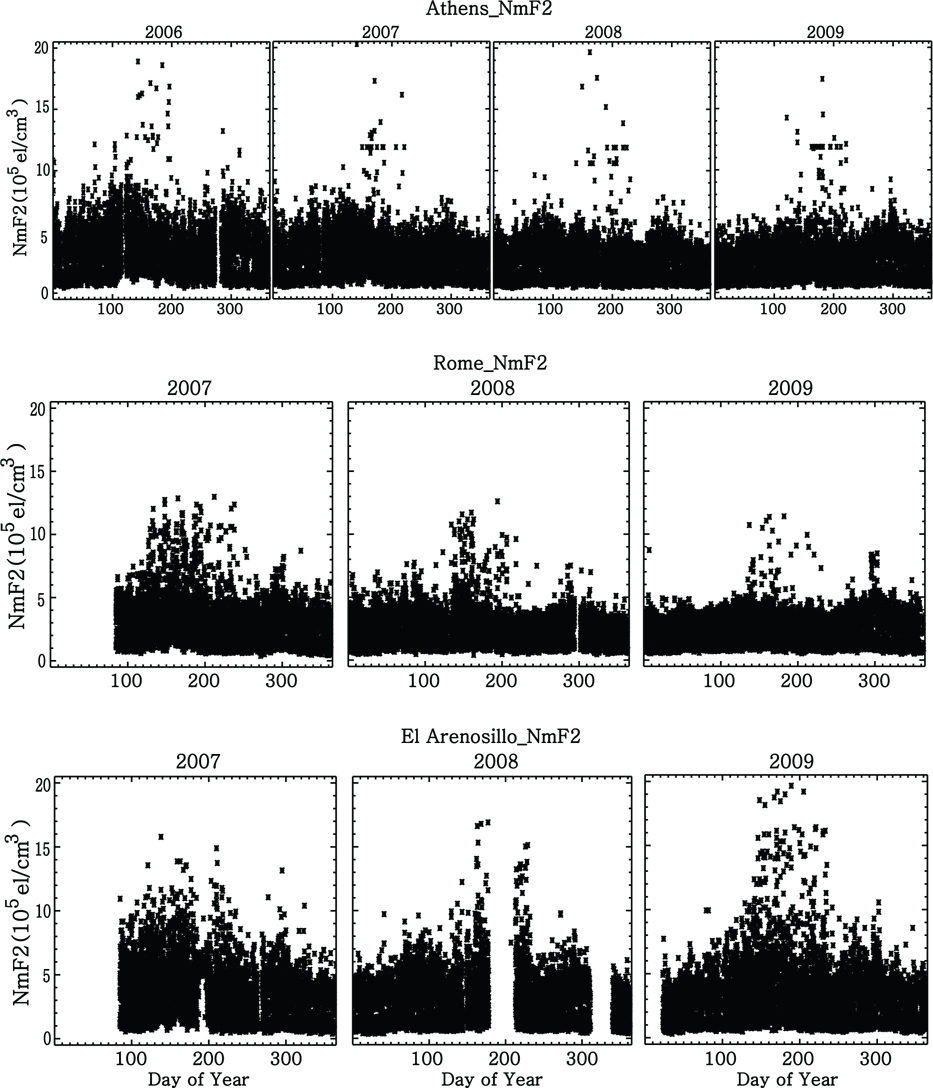
Fig. 5 shows the variations of NmF2 for each year calculated using the data obtained from the Athens, Rome, and El Arenosillo observatories. It was found that unusual enhancements occurred in which the values sporadically increased over twice the average values during the summer season, although the increased range and the number of occurrences were smaller than those of Anyang NmF2. For the Rome and El Arenosillo observatories, though the analysis programs were upgraded to ARTIST 5 in June 2008 and December 2008, respectively, the unusual enhancements of NmF2 occurred in the summer of 2009. However, as the accurate cause cannot be figured out just by the variations of NmF2, the ionogram for each observatory was analyzed to understand the structure of the ionosphere.
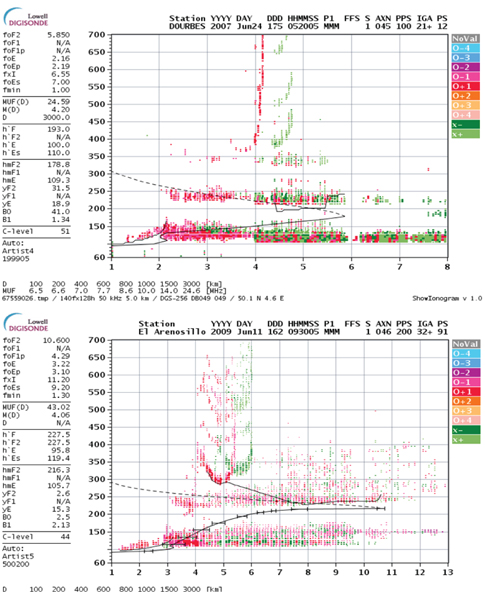
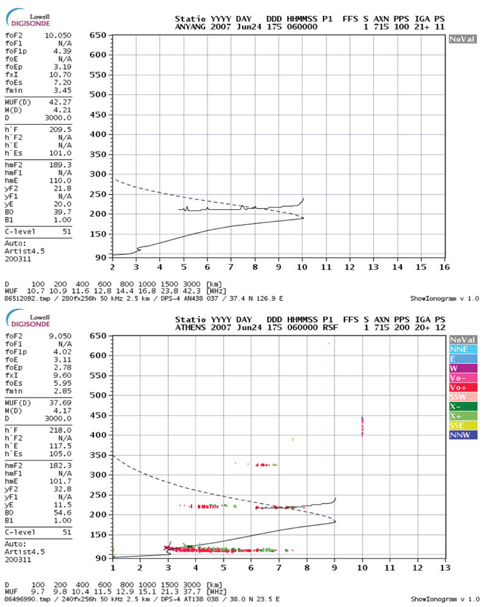
Fig. 6 shows the ionograms for the three observatories located in Europe on June 24, 2007 when the unusual enhancements of Anyang NmF2 occurred and geomagnetic activity was quiet. Unlike other observatories that provided the data at 15 minute intervals, the Anyang observatory only recorded the ionogram data at 1 hour intervals. Also, the Anyang ionogram does not have information on the actual reflected signals, and only includes the lines that represent the virtual heights (thin solid line) depending on the analysis of the reflected signal pattern in the first step, and the actual heights (thick solid line that is connected to dotted line above the critical frequency) calculated from the virtual heights considering the delay effect due to electron density in the second step. Therefore, the reflected signals, from which these height profiles have been extracted, are not known, and it cannot be verified whether the height profile extraction process has been properly carried out. In the Anyang ionogram shown in Fig. 6, the virtual height profile was irregular between 200 and 250 km, and this was very different from the structure that represents the F-layer in normal condition. This irregular structure of the virtual height profile was also observed in the Athens ionogram shown in Fig. 6. In this ionogram, the sporadic E-layer apparently occurred, based on the signal distribution of thin and wide frequency band at the height of the E-layer. The irregular structure of the reflected signals was similarly observed in the ionogram data from other stations used for this analysis, besides the Athens observatory. The highdensity sporadic E-layer was found to have occurred in all of these observatories.
The sporadic E-layer is a phenomenon in which the high-density thin plasma layer transiently occurs at the height of the E-layer. If the sporadic E-layer is formed, which has higher density than the F2-layer, the radio waves transmitted from an ionosonde cannot reach the F2-layer, and are reflected from the sporadic E-layer, which are again reflected from the Earth’s surface. Consequently, the first, second, and third sporadic-E echoes could be formed at high heights in the ionogram. The representative example is the ionogram of the Dourbes station shown in Fig. 7. In this ionogram, the first echo of the sporadic E-layer generally appears as if it has been reflected from the height of the F2- layer. Therefore, if the high-density sporadic E-layer occurs, the echoes of the sporadic E-layer, which are concomitantly observed, could induce considerable disturbance for the interpretation of the ionosonde observation data. The current analysis program has a disadvantage of perceiving the echoes of the sporadic E-layer observed at the height of the F2-layer as the trace of the F2-layer. In Fig. 6, this automated analysis program erroneously perceived the echoes of the sporadic E-layer as the F2-layer, and incorrectly calculated foF2 and hmF2 of the F2-layer.
Pezzopane & Scotto (2007) reported that when the highdensity sporadic E-layer occurred, the analysis program, Autoscala, did not calculate foF2 because the reflection trace of the F2-layer was uncertain due to the echoes of the sporadic E-layer, whereas the ARTIST 4.5 program calculated foF2 though the values were incorrect, which erroneously gave the results as if positive ionospheric disturbance occurred.
The Anyang ionogram shown in Fig. 6 does not include the reflected signals. However, it is thought that the sporadic E-layer occurred over the Anyang region at that moment considering that the shapes of the virtual height and actual height profiles were very similar to those for other observatories where the sporadic E-layer was observed. In other words, it is thought that the structure of the virtual heights had an unstable zigzag shape in the horizontal direction rather than a typical curved shape, due to the echoes of the sporadic E-layer, and that this is because the analysis program erroneously perceived the echoes of the sporadic E-layer as the reflected signals of the F2-layer and calculated the values incorrectly.
The unusual enhancements of Anyang NmF2 sporadically occurred during the summer season (Table 2). The cases, in which NmF2 was more than 15 × 105 el/cm3, occurred total 43 times in 2006 and total 38 times in 2007. The fact that they frequently occurred in June, July, and August is related with the seasonal characteristics of the sporadic E-layer, which frequently occurs during the summer season. The unusual enhancements of NmF2 mostly occurred in the daytime, and the sporadic E-layer also tends to occur in the daytime during the summer season (Smith 1958, Thomas & Smith 1959, Prasad et al. 2012).
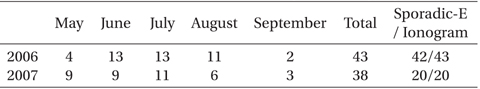
Monthly numbers of unusual enhancements of NmF2 (>15 × 105 el/cm3) and sporadic-E’s observed in ionograms at Anyang station.
The analysis of the ionograms of the time when the unusual NmF2 enhancements occurred indicated that the irregular virtual height line was equally observed similar to the ionogram shown in Fig. 6. A number of physical quantities of the ionosphere calculated using the analysis program were included in the upper left part of the ionograms. Among them, every critical frequency value of the sporadic E-layer (foEs) was found to be more than 6 to 7 MHz when the unusual NmF2 enhancements occurred. This indicates that the sporadic E-layer occurred at that moment, and the radio waves from the ionosonde did not penetrate up to the F2-layer because the electron density of the sporadic E-layer was higher than that of the F2-layer observed during the summer season at solar minimum. Table 2 summarizes the number of occurrences of the unusual NmF2 enhancements from May to September in 2006 and 2007, and the number of occurrences of the sporadic E-layer observed from the ionograms of the same time when the unusual NmF2 enhancements occurred. In 2006, for the 43 ionograms in which the unusual NmF2 enhancements occurred, the sporadic E-layer of more than 6 to 7 MHz was also observed in 42 ionograms, and in 2007, for all of the 20 ionograms that were available for comparison, the sporadic E-layer of more than 6 to 7 MHz was also observed. If the high electron density sporadic E-layer occurs, the analysis program, ARTIST 4.5, erroneously perceives the echoes of the sporadic E-layer as the trace of the F2-layer, and incorrectly calculates foF2. Thus, as the electron density of the sporadic E-layer increases, the errors of foF2 and NmF2 also increase. However, this problem of the analysis program is not limited to ARTIST 4.5. As shown in Fig. 7, the Dourbes observatories using ARTIST 4 also incorrectly calculated foF2 when the high-density sporadic E-layer occurred. In the observatories using ARTIST 5, which is the latest version, the same problem was found. In the case of ARTIST 5, this problem has been largely improved, and the number of problem occurrences has been considerably decreased. However, the erroneous interpretation of the sporadic E-layer shown in the ionogram of the El Arenosillo observatory suggests that further improvement needs to be made.
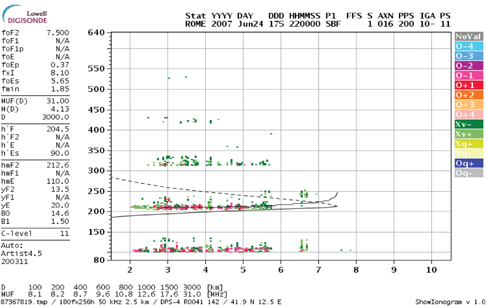
The analysis programs developed after ARTIST 4 express the reliability of a number of parameters calculated during the analysis of each ionogram, as the confidence level (C-level) index, where 11 represents the highest reliability and 55 represents the lowest reliability. In other words, the C-level index shows low reliability when the trace of each layer is uncertain due to radio disturbance or noise, and this indicates that the calculated parameters are not accurate. Therefore, in obtaining ionosonde data, it is important to check the C-level index, which is relevant to the reliability of the data. However, in Fig. 6, the C-level index mostly indicated low reliability (55) when the foF2 values were incorrectly calculated due to the sporadic E-layer. However, as in Fig. 8, the C-level index occasionally indicates the highest reliability (11) despite that the analysis program made the similar error due to the sporadic E-layer. In other words, as the reliability index from the analysis program cannot be fully relied upon, care should be taken in selecting the parameters provided by ionosondes, and this problem needs to be improved in the future.
In this study, the cause for the unusual enhancements of NmF2 in the Anyang ionosonde data in 2006 and 2007 was investigated. To search for the cause for the unusual enhancements of NmF2, we examined the GPS TEC values measured in Daejeon and the Jason satellite TEC values around the Korean peninsula, but could not find noticeable enhancements. Since NmF2 values are calculated from the critical frequency of the F2-layer (foF2) in the ionograms that are produced by ionosondes, we then analyzed the ionograms from the Anyang, Athens, Rome, and El Arenosillo stations during the NmF2 enhancement events. The analysis results indicated that the NmF2 enhancements were observed when the sporadic E-layer occurred, and they were found to be errors that happened when the automated analysis program erroneously perceived the echoes of the sporadic E-layer as the F2-layer. In addition, the fact that the unusual enhancements of NmF2 were recorded mostly during summer is consistent with the seasonal characteristics of a sporadic E-layer, which frequently occurs during summer. This error of the automated analysis program was also observed in ARTIST 4 and the latest version, ARTIST 5 as well as ARTIST 4.5 used in Anyang. For studies using long-term ionosonde data of foF2 values that were automatically calculated by the automated analysis program, it cannot be determined whether or not these values are errors due to a sporadic E-layer. Although the ARTIST analysis program provides the C-level index that hints the reliability of the calculated values, this index is rather unstable so that large scale ionosonde data may be still contaminated with erroneous foF2’s even after screening with this index.
The Anyang ionosonde has provided 1-hour interval ionograms, rather than 15-minute interval ionograms, and the ionograms only recorded the results from the automated analysis program without traces of reflected signals, which limits the utilization of the data. For the Icheon and Jeju ionosondes that are currently in operation, the observation data need to be managed so that this problem will not happen in the future. Since ionospheric parameters obtained from ionograms are essential for analyzing longterm trend of ionosphere or making empirical models, the reliability should be increased by identifying and removing the erroneous foF2 values due to a sporadic E-layer. For this purpose we suggest to establish a new index flagging the effect of a sporadic E-layer, in addition to the C-level index currently provided by the ARTIST analysis program.