Since the operation of the King Sejong Station (KSS) started in Antarctic Peninsula in 1989, there have been continuous efforts to perform the observation for the upper atmosphere. The observations during the initial period of the station include Fabry-Perot Interferometer (FPI) and Michelson Interferometer for the mesosphere and thermosphere, which are no longer in operation. In 2002, in collaboration with York University, Canada, the Spectral Airglow Temperature Imager (SATI) was installed to observe the temperature in the mesosphere and lower thermosphere (MLT) region and it has still been producing the mesopause temperature data until present. The observation was extended by installing the meteor radar in 2007 to observe the neutral winds and temperature in the MLT region during the day and night in collaboration with Chungnam National University. We also installed the all sky camera in 2008 to observe the wave structures in the MLT region. All these observations are utilized to study on the physical characteristics of the MLT region and also on the wave phenomena such as the tide and gravity wave in the upper atmosphere over KSS that is well known for the strong gravity wave activity. In this article, brief introductions for the currently operating instruments at KSS will be presented with their applications for the study of the upper atmosphere.
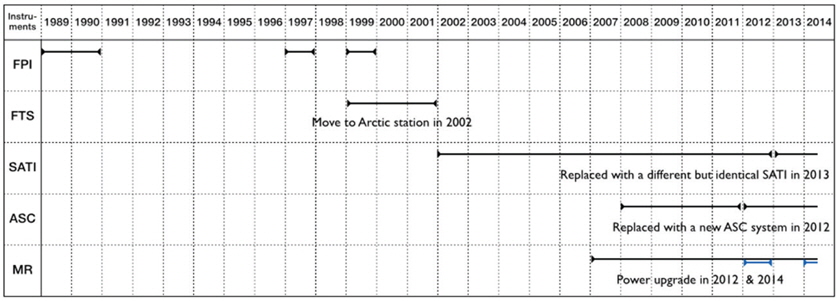
In early 1989 when King Sejong Station (KSS) started the operation in Barton Peninsula, King George Island, Antarctica (62.22°S, 58.78°W), a Fabry-Perot Interferometer (FPI) was installed to observe the thermosphere for the first time in Korea. The cloudy weather at KSS may not be ideal for the optical observation for the upper atmosphere. On the other hand, there is no contamination from brighter aurora emissions due to the location of low magnetic latitude (52.29°S in Geomagnetic latitude calculated from IGRF-11). The FPI had been operated until it stopped functioning at the end of 1990’s and the data were utilized for the study of the thermospheric temperature variations with solar and magnetic activities (Chung et al. 1998, 2000, Won et al. 1996). To continue the observation for the upper atmosphere, a Michelson Interferometer (or called Fourier Transform Spectrometer: FTS) was installed at the KSS in 1999. This instrument specifically observed the mesosphere and lower thermosphere (MLT) region by measuring the airglow emissions from OH molecule (Meinel band) at around 87km altitude. The observed data had been analyzed to derive the atmospheric temperature of the altitude region and used to study dynamical wave structures such as the gravity, planetary, and tidal waves (Won et al. 1999, 2001a, b). This instrument however moved to the northern polar region when Korean Arctic Dasan station opened in Ny-Alesund, Svalbard, Norway in 2002, and it was replaced by the Spectral Airglow Temperature Imager (SATI) that was installed at KSS in 2002 in collaboration with York University, Canada. Table 1 shows the operation periods of the ground-based instruments for the upper atmosphere at the KSS. Note that the optical instruments operate only during dark period, which excludes the summer period of November, December, January, and February. The meteor radar however continuously operates year round.
[Table 1.] Operation periods of the ground-based instruments at KSS.

Operation periods of the ground-based instruments at KSS.
In addition to these instruments, we installed the all sky camera (ASC) and meteor radar to expand the capability of our observations for the upper atmosphere. It has been well known that the gravity wave activity is noticeably strong near the tip of the Antarctic Peninsula (John & Kumar 2013, Park et al. 2014). To investigate the gravity wave activity around King Sejong Station, any single instrument alone may not be capable of observing the gravity wave activity for all local times or all seasons. The optical instruments work only during the nighttime while the meteor radar runs for 24 hours per day all year round. However, the mesopause temperature from the meteor radar is only a secondary parameter derived from the measurement of meteor decay times and therefore it needs to be validated by comparing with other direct observations for temperature such as SATI temperature measurement. The ASC can further provide the two-dimensional structure of the gravity wave over the KSS. In this article, these instruments will be briefly introduced with their applications for the study on the upper atmosphere around the KSS.
2. SPECTRAL AIRGLOW TEMPERATURE IMAGER
A Spectral Airglow Temperature Imager (SATI) was built at the Space Instrumentation Laboratory in the Center for Research Earth and Space Science (CRESS), York University, Canada and installed at King Sejong Station in February 2002. It was continually operated since then and producing the temperature data only during the moonless nighttime for about 10 years until it failed to work due to the filter wheel problem at the end of 2012. The SATI was replaced by another SATI instrument, which is identical to the KSS SATI and had been operated at Resolute Bay, Canada (74.69°N, 265.1°E) from 2001 to 2009. This Resolute SATI, having a problem with CCD camera, was moved to KSS in the 2012- 2013 summer season and installed with a CCD from the KSS SATI to continue the observation.
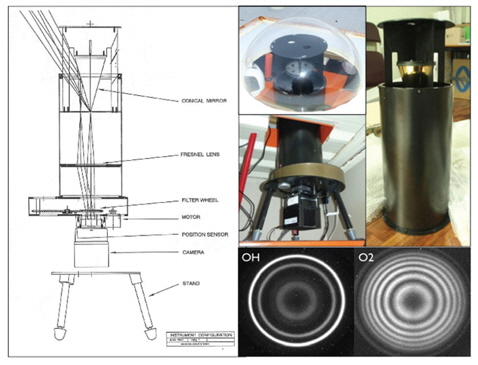
The SATI is a spatial scanning Fabry-Perot spectrometer, measuring the column emission rate for selected rotational lines of O2 and OH airglow emissions centered at about 94 and 87 km altitudes, respectively. The measurements can be used to infer the rotational temperature from the line ratios (Cho & Shepherd 2006, Shepherd et al. 2010). The instrument consists of a conical mirror, Fresnel lens, a CCD detector, and narrow-band interference filters for the O2 and OH emissions as shown in Fig. 1. It measures the images with the exposure time of 120 seconds for each emission, which gives about 4 minutes for two airglow layers. The SATI operates only for dark sky condition according to the solar and lunar zenith angles. At KSS, the operation period is about 8 months from March to October with the exclusion of the full moon period. The instrument error of the relative temperature measurements for both emissions is approximately 1.7 K with about 2% error for the emission rate (Cho & Shepherd 2006, Sargoytchev et al. 2004). The right bottom panels of Fig. 1 show the observed interference images for OH (left) and O2 (right) airglow emissions.
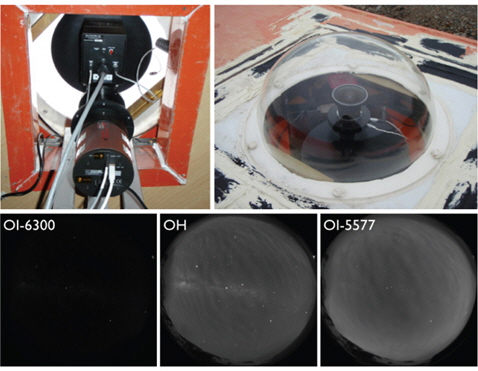
All Sky Camera (ASC) has been operated at KSS since 2008 to investigate gravity waves in the MLT from the airglow emissions with four different wavelengths of O2, OH (Meinel band) and O (630,0 nm and 557.7 nm). The observed airglow images are able to capture the two-dimensional structure of the gravity waves in the altitude regions of about 80 ~ 250 km. This camera system had been operated at Mt. Bohyun, Korea for about 5 years from 2001 to 2005 for the study of the mesospheric gravity waves (Chung et al. 2007, Kim et al. 2010a) but it was moved to KSS in 2007 and reinstalled during the summer season of 2007- 2008. This instrument was successfully operated for about 4 years and replaced by a new ASC system to continue the observation but with three filters (557.7 nm, 630,0 nm for O airglow emissions and Meinel band from OH emission), instead of four filters in the old system. The Meinel band filter has a wide-band of 720-910 nm notched at 865 nm.
The optical system of the KSS ASC includes the appropriate lenses to form an all-sky telecentric image near the 3-inch diameter filter plane, and to re-image achromatically onto the CCD chip. All internal doublet achromatic and singlet lenses have been custom-ground and AR coated by Keo Scientific’s lens grinding facility for optimum performance. The primary (front) lens in this 3-inch system is a 24mm/F4.0 medium-format achromatic fisheye lens. The final lens in front of the CCD is the renowned ultra-fast f/0.95 Canon 50 mm Rangefinder compound objective. The full 180° field of view image circle is approximately inscribed within the 13.3 mm × 13.3 mm CCD, with corners rendered dark. Filters of bandwidths as narrow as 20Å may be mounted in the filter wheel. The optical system is custom designed for use with a “half-inch” type CCD. The imager is currently equipped with a back-illuminated
The new KSS ASC measures airglow emissions from the altitude regions of about 87 km (OH), 96 km (OI 5577 nm), and 240 km (OI 6300 nm) and therefore it is able to observe the gravity wave phenomena in those altitude regions. The bottom panels of Fig. 2 show the airglow images measured by the KSS ASC. Note that the images from the mesopause region (OI-5577 and OH) show the wave pattern due to the gravity waves while the image from the thermosphere (OI-6300) do not show any wave pattern, which indicates that the gravity waves generated below the mesopause are dissipated and absorbed in the upper atmosphere before they reach the thermosphere. The accumulated ASC data are under the analysis to be utilized for the study of the gravity wave and their effects on the upper atmosphere with other observations at KSS.
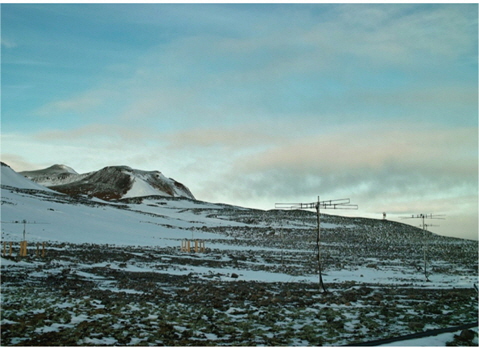
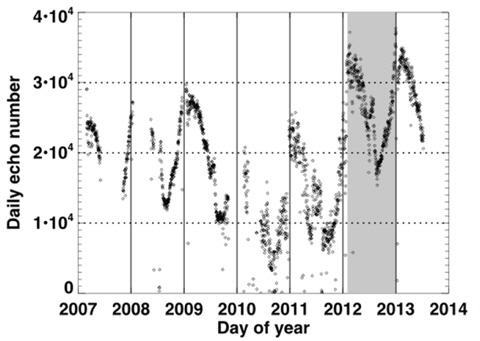
Optical observations are mostly limited to clear moonless night. In order to expand the capability of our observations for the upper atmosphere, meteor radar was installed at KSS in March 2007 by the Space Science Laboratory at Chugnam National University (Prof. Yong Ha Kim) in collaboration with KOPRI as shown in Fig. 3. The instrument supplied by ATRAD is an interferometric radar, which consists of a cross folded dipole transmitting antenna and 5 receiving antennas arranged along two perpendicular directions with spacing of 2 λ and 2.5 λ to minimize mutual antenna coupling as designed by Hocking (1997). The KSS meteor radar operates at 33.2 MHz with an initial peak power of 8 kW to receive meteor echoes back-scattered from the underdense meteor trails. In 2012, the peak power was upgraded to 12 kW, which enhanced the maximum number of received echoes by about 50% from about 23000 to about 35000 in summer as can be seen in Fig. 4. Note that at this point, the background noise level was also significantly reduced to contribute to the enhancement of the received echo number. However, one of the PA modules was failed to work in the beginning of 2013 and the radar operated with 8 kW during the year 2013 until the repaired PA module was installed back to the system to produce a full 12 kW peak power at the end of the year. Fig. 4 shows the daily echo number versus day of year during the period of operation from 2007 to 2013. The shaded area for 2012 in the figure indicates the radar operation with the peak power of 12 kW, which shows significant increase of the detected meteor echoes in comparison with the previous years with 8 kW. It should be noted that the received echo number shows strong seasonal variation: maximum near the early March equinox (or late summer solstice) and minimum near the early September equinox (or late winter solstice). The difference of the echo number is as large as about 100%, being greater during summer-fall season than during winter-spring. The seasonal variation is caused by the relative position of the Earth’s rotation axis to the plane of the Earth’s orbit around the Sun in which most of solar bodies including meteoroids are orbiting.
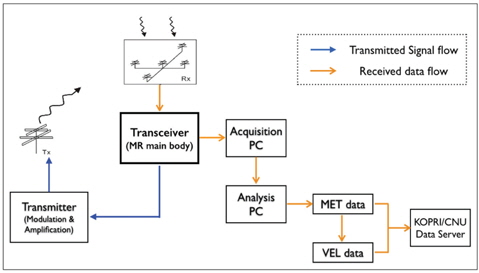
The meteor radar continuously observes the meteor echoes in the altitude region of about 70 to 110 km for 24 hours a day, regardless of weather conditions, in contrast to ground-based optical instruments such as SATI and ASC that work only at clear moonless night. A radio signal transmitted from the transmitting antenna is scattered from a meteor plasma trail and the returning signal is received simultaneously by 5 receiving antennas with a range resolution of 1.8 km. Fig. 5 shows the schematic diagram for the overall flows of signal and data in the meteor radar system. Interferometric analysis of the received echo signals allows one to determine the location of meteors in the sky. The angular resolution of the signals is generally known to be less than 2°. The configuration of antenna array and information on the VHF meteor radar system with data analysis are described in detail by Jones et al. (1998) and Holdsworth et al. (2004, 2008) including the criteria applied for determining whether the backscattered signal is generated by the underdense meteor trails or not.
In the next section, we will introduce a few applications of these instruments at KSS for the study of the upper atmosphere, in particular, the mesosphere and lower thermosphere.
Temperatures and emission rates of O2 (0−1) and OH (6−2) airglows have been measured with SATI at King Sejong station, Antarctica during the period of 2002−2003. A Lomb-Scargle spectral analysis of the data shows that the oscillations with 4- and 6-h periods were dominant during 21 and 13 nights out of 67 analyzed nights, respectively, to the confidence level of 99%. The phases of the 6-h oscillation are determined to be 2.2 ± 1.3 h in fall (March−May) and −0.5 ± 0.9 h in winter (June−August). The phases of the 4-h oscillation are scattered in the range of 1.3 ± 0.9 h throughout both seasons. The 6-h oscillations with nearly constant phases may be interpreted as zonally symmetric non-migrating tides since migrating tides, except for high order modes, are known to have very weak amplitudes at high latitudes according to the classical tidal theory. The detected oscillations may also be explained with high order modes of migrating tides whose amplitudes are significant at high latitudes as our site. However, the observed temperature peak leads the intensity peak for most cases, as predicted by theoretical models for zonally symmetric tides. On May 8 and 25, 2003, there were coherent 6- and 4-h oscillations in both O2 and OH temperatures, which allows us to estimate the vertical wavelength of the oscillations, being 32 ± 10 km and 47 ± 31 for 6- and 4-h oscillations, respectively. Although the estimated vertical wavelengths are consistent with high order tides, their statistical significance may not be sufficient for any conclusive remark. This observation seems to support tidal origin for the 6- and 4-h oscillations. For the 4-h oscillation with almost a random phase in time, it may have an interference with other sources such as gravity waves. For details of this study, please refer to Chung et al. 2006.
The mesospheric wind data from the KSS VHF meteor radar were analyzed for the period of April 2007 to July 2009 to investigate the gravity wave activity in the mesopause region over KSS, Antarctica, which is known for strong gravity wave activity (Baumgaertner & McDonald 2007, Vincent et al. 2007, Park et al. 2014). The mean zonal wind generally shows the dominant eastward flow at 80–100 km altitude with a large annual variation. It reverses to a westward flow during summer (November and December) at about 80 km altitude, showing the strong jet as high as −55 ms-1. During summer, the westward wind shows conspicuous features such as strong vertical wind shear in the altitude region of 80–95 km and wind reversal from the westward to the eastward above the mesopause region. For the meridional winds, there is a relatively large equatorward wind at 80–100 km during summer, which can reach as large as 20 ms-1 at 90 km altitude in December. The peak of equatorward winds occurs at about 90 km altitude where the zonal wind shear is strongest, probably due to the interaction between GWs and zonal winds. The seasonal behaviors of mean winds over KSS agree well with the meteor radar observations at the British Rothera station that is located nearby in the Antarctic Peninsula.
The semidiurnal tide is found to be the strongest among all the tidal components near the mesopause region over KSS. The properties of monthly averaged semidiurnal tides are generally in good agreement with the prediction of GSWM02 except for the amplitudes at above the altitude of 95 km. Strong semidiurnal-tidal activity occurs during March to October. There is a clear 3-h phase difference between the zonal and meridional components, implying that the tide propagates upward with a circular polarized structure at all heights and in all seasons. The seasonal variation of semidiurnal tide generally resembles that of the wind variance, which supports the inter-relationship between the tide and GWs as reported in previous observations and theoretical predictions (Vincent & Fritts 1987, Espy et al. 2004, Mayr et al. 2005a, 2005b, also see Beldon & Mitchell 2010).
The vertical profiles of the estimated wind variances show an increasing trend with height in all seasons, except for summer when the variance decreases with height especially at lower altitudes (82–90 km). The strength of wind variances at KSS is significantly larger than that in the Rothera station above the mesopause regions (~88 km) from May through September. Aura MLS satellite observations show significantly larger stratospheric temperature variances over KSS than those over the Rothera station during August and September. The global scale satellite observations for the GW activity in the lower atmosphere, for example, from CHAMP and COSMIC satellites also indicate that the maximum temperature variance and momentum flux due to GW occur over the tips of Antarctic Peninsula and South America during winter (Park et al. 2014). Therefore we conclude that the observed large wind variances at KSS are caused by the very effective atmospheric conditions via atmospheric gravity waves near the Antarctic vortex (Lee et al. 2013b).
5.3. Mesospheric temperature estimation from the decay time of meteor trails
Meteors entering the earth’s atmosphere can reveal various aspects of the upper atmospheric parameters, such as the neutral winds and temperature, through the interactions with dense air molecules, especially in the altitude region between 70 and 110 km, where most meteors ablate. Once the meteor trails are formed via frictional heating with air atoms and molecules, it begins to dissipate by several processes such as the ambipolar diffusion, the eddy diffusion, the recombination processes, and the chemical interactions with major neutral species in the upper atmosphere. The information of the dissipation or decay process of meteor trails can be utilized to derive the mesospheric temperature (Hocking 1999, Hocking et al. 2004), in addition to the horizontal components of the neutral wind that is the main observational parameter and determined from the radial velocities of meteor echoes (Holdsworth et al. 2004, Lee et al. 2013a). However, it was found that the meteor decay time (i.e. the diffusion coefficient) is dependent not only on the air density along the passage of meteor trails, but also on the strength of the meteor echoes (Kim et al. 2010b). In other words, the altitude variations of decay time are consistent with the ambipolar diffusion theory only for weak meteors in which the plasma density within meteor trails are small. For strong meteors with high plasma density, the altitude variation of decay time is strongly deviated from the ambipolar diffusion theory. This implies that only the decay times of weak meteors should be applied for the temperature estimation (Kim et al. 2012). The further analysis of the observed data showed that the altitude variations of meteor decay time are strongly influenced not only by the background neutral atmospheric density but also by the three-body attachment of meteor trail electrons to neutral atmospheric molecules ( Lee et al. 2013a).
Neutral temperatures near the mesopause region were estimated from the decay times of the meteor echoes observed by VHF meteor radar during the period covering 2007 to 2009 at King Sejong Station, Antarctica. The estimated temperatures were compared with other simultaneous temperature measurements from the spectral airglow temperature imager (SATI) for the period of March through October 2007 and from the SABER (the sounding of the atmosphere using broadband emission radiometry) instrument onboard the TIMED (the thermosphere ionosphere mesosphere energetics and dynamics) satellite for the period of 2007 through 2009 (Kim et al. 2010b, 2012). While previous studies have used all meteor echoes to determine the slope from a height profile of log inverse decay times for temperature estimation, Kim et al. 2012 have divided meteor echoes into weak and strong groups of underdense meteor trails, depending on the strength of the estimated relative electron line density within meteor trails. They found that the slopes from the strong group are inappropriate for temperature estimation because the decay times of strong meteors are scattered too much to determine the proper slope of the height distribution, whereas the slopes of the height distribution of the weak group relatively well represent the variation of decay times with height. Thus only the slopes from the weak meteor group are utilized to estimate the mesospheric temperature. The meteorestimated temperatures, representing the region around the altitude of about 91 km, are slightly lower on average by 2.1 K than simultaneously observed SATI OH (6–2) rotational temperatures during the winter period (March– October). However, the monthly mean temperatures are in good agreement with SABER temperatures within a mean difference of 4.8 K throughout the year.
The ground-based observations for the mesosphere and lower thermosphere (MLT) region have been performed at KSS since the operation of the station started at the end of 1980’s. The initial observations for the MLT region were performed by using FPI and Michelson Interferometer during 1990’s, which was utilized for the study on the temperature variations and dynamical wave structures such as gravity wave, planetary wave, and tide (Chung et al. 2000, Won et al. 1996, 1999, 2001a, b). The observations were followed by SATI in 2002, meteor radar in 2007, and ASC in 2008. These three instruments are continually collecting data to monitor the neutral winds, the neutral temperature, and airglow images in the MLT region until present. The collected data have been utilized for the studies on the gravity wave activity near KSS, the physical characteristics in the MLT region such as the temperature and wind structures (Kim et al. 2010b, Kim et al. 2012, Lee et al. 2013a, 2013b, also see Park et al. 2014). The ground-based observations for the upper atmosphere at the KSS will be continued and enhanced by adding the observations for the thermosphere and ionosphere in the near future. The collected data will be utilized for the long-term study on the upper atmosphere such as the gravity wave activity and the lower and upper atmosphere coupling.