


To identify seasonal and latitudinal variations of F2 layer during magnetic storm, we examine the change of daily averages of foF2 observed at Kokubunji and Hobart during high (2000~2002) and low (2006~2008) solar activity intervals. It is found that geomagnetic activity has a different effect on the ionospheric F2-layer electron density variation for different seasons and different latitudes. We, thus, investigate how the change of geomagnetic activity affects the ionospheric F2-layer electron density with season and latitude. For this purpose, two magnetic storms occurred in equinox (31 March 2001) and solstice (20 November 2003) seasons are selected. Then we investigate foF2, which are observed at Kokubunji, Townsville, Brisbane, Canberra and Hobart, Dst index, Ap index, and AE index for the two magnetic storm periods. These observatories have similar geomagnetic longitude, but have different latitude. Furthermore, we investigate the relation between the foF2 and the [O]/[N2] ratio and TEC variations during 19-22 November 2003 magnetic storm period. As a result, we find that the latitudinal variations of [O]/[N2] ratio and TEC are closely related with the latitudinal variation of foF2. Therefore, we conclude that the seasonal and latitudinal variations of foF2 during magnetic storm are caused by the seasonal and latitudinal variations of mean meridional circulation of the thermosphere, particularly upwelling and downwelling of neutral atmosphere during magnetic storm.
According to Rishbeth & Mendillo (2001), the F-layer electron density could vary depending on the changes in solar ionizing radiation, solar wind and geomagnetic activity, neutral atmosphere, and electrodynamics. Thus, the F2-layer electron density shows variations with various periods. Especially, Park et al. (2010) suggested that during the high solar activity interval (2000~2002), geomagnetic activity affected the semi-annual variations of the midlatitude F2-layer. During magnetic storms, the changes in the circulation and composition of the thermosphere could also affect the ionospheric electron density.
According to Fuller-Rowell et al. (1997), during magnetic storms, the upper thermosphere experiences various changes due to the energy influx from the magnetosphere. First, the ionospheric electron density increases due to the increase of auroral particle precipitation, and accordingly, the neutral atmosphere accumulates direct heat. Also, the increased auroral particle precipitation redistributes the high-latitude plasma and causes Joule heating by strengthening the electric conductivity and electric field of the polar ionosphere (e.g., Sojka & Schunk 1983, Prölss et al. 1991). In addition, the ionized region widens into polar caps, and the neutral wind of the thermosphere experiences thermal expansion due to the increases of the velocity and the temperature caused by the strengthened ion drag. Then this changes the composition and density of the neutral atmosphere at an altitude plane (e.g., Prölss 1980, Maeda et al. 1989, Crowley et al. 1996).
The F2-layer mostly consists of O+ ions. The production rate of O+ ions (or electrons) is proportional to the density of O, whereas the loss rate is proportional to the density of N2. Therefore, the F2-layer electron density can be determined by the [O]/[N2] ratio, where the F2-layer electron density increases as the [O]/[N2] ratio increases (e.g., Richmond & Lu 2000). During magnetic storms, the changes in the mean meridional circulation of the thermosphere due to the heating of the polar upper atmosphere (especially the additional upwelling or downwelling of the neutral atmosphere depending on latitude) change the [O]/[N2] ratio of the neutral atmosphere at the ionospheric altitude. In other words, if the air with abundant nitrogen molecules flows into high altitudes due to the upwelling of the neutral atmosphere, the [O]/[N2] ratio decreases due to the relative increase in the density of N2 at the ionospheric altitude. As a result, the recombination rate of electrons increases, and the F2-layer electron density decreases. On the other hand, the downwelling of the neutral atmosphere induces the opposite phenomenon.
As mentioned above, the changes in geomagnetic activity could affect the latitudinal circulation of the thermosphere, especially the upwelling and downwelling of the neutral atmosphere, and this affects the F2-layer electron density by changing the [O]/[N2] ratio of the neutral atmosphere at the ionospheric altitude. As the circulation of the thermosphere varies depending on season, geomagnetic activity could have different effects on the seasonal and latitudinal variations of the F2-layer electron density. Therefore, in this paper, magnetic storms were first classified into the spring/ autumnal equinoxes and the summer/winter solstices, and the latitudinal variations of the F2-layer electron density were investigated in relation to the seasonal magnetic storms. Also, the relation between these results and the [O]/ [N2] ratios observed from the TIMED/GUVI satellite was examined. In addition, the variations of the ionospheric total electron content (TEC) during the same period were examined. This study is expected to provide an opportunity to directly investigate the seasonal and latitudinal variations of the F2-layer electron density due to the changes in the circulation and composition of the thermosphere during magnetic storms, based on observation.
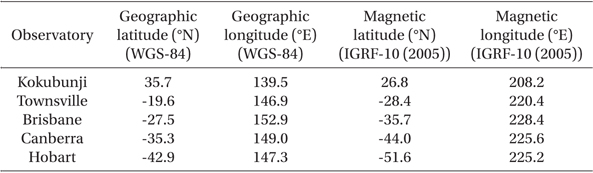
To examine the latitudinal variations of the F2-layer electron density, the foF2 observed at the ionosonde in Kokubunji, Japan (http://wdc.nict.go.jp/IONO/HP 2009/ISDJ/index-E.html) and the foF2 observed at the ionosondes in Townsville, Brisbane, Canberra, and Hobart, Australia (http://www.ips.gov.au/World_Data_Centre/1/3) were used. These observatories have similar geomagnetic longitude, but have different latitude. Table 1 summarizes the geographic and geomagnetic locations of each observatory. foF2 is a critical frequency that is reflected from the F2-layer, and it is proportional to the square root of the electron density. Thus, the variations of the F2-layer electron density could be investigated using foF2.
[Table 1.] The coordinates of the ionosonde observatories.

The coordinates of the ionosonde observatories.
Also, the AE index and Dst index, which are provided by the World Data Center for Geomagnetism, Kyoto University, Japan (http://wdc.kugi.kyoto-u.ac.jp/index.html), and the Ap index, which is provided by the OMNI Web (http:// omniweb.gsfc.nasa.gov/form/dx1.html) were used. During magnetic storms, the influx of energy and momentum into the thermosphere causes a lot of changes in the composition and circulation of the thermosphere (Roble 1987). To study this phenomenon, the [O]/[N2] ratio that is provided from the TIMED/GUVI satellite was used. In addition, to investigate the variations of the ionospheric total electron content during magnetic storms, a composite GPS TEC map was used.
3.1 Mid- and high-latitude foF2 variations depending on solar activity
Using the variations of the F10.7 index between 1997 and 2008, Park et al. (2010) classified 2000~2002 as the high solar activity interval, and 2006~2008 as the low solar activity interval. Fig. 1 shows the variations of the daily averages of foF2 in Kokubunji and Hobart during the high and low solar activity intervals, which were classified by Park et al. (2010). In Fig. 1, regardless of the solar activity, the daily average of foF2 in Hobart at a geomagnetic latitude of 51.6°S was lower than that in Kokubunji at 26.8°N, in all seasons. This is thought to be because of the latitudinal differences in the degree of ionospheric ionization by the Sun.
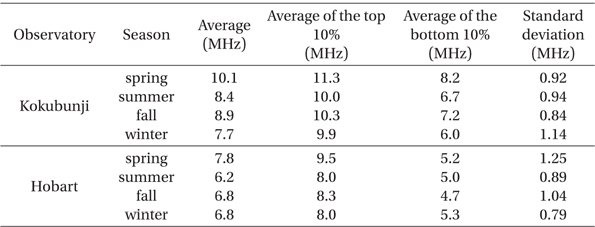
As shown in Table 2, during the high solar activity interval, distinct semi-annual variations were observed in Kokubunji, where the seasonal averages of the daily average of foF2 showed the maximum values in spring (March and April) and fall (September and October) rather than in summer (May, June, July, and August) and winter (January, February, November, and December). Also, the seasonal averages of the daily average of foF2 in Hobart showed semiannual variations although they were less distinct than the variations in Kokubunji for the same period. On the other hand, during the low solar activity interval, the seasonal averages of the daily average of foF2 in Kokubunji had slightly higher values in spring (5.3 MHz) and fall (4.8 MHz) than in summer (5.1 MHz) and winter (4.3 MHz). However, the seasonal averages in Hobart were 4.0 MHz in spring, 3.3 MHz in summer, 3.6 MHz in fall, and 4.3 MHz in winter, where the semi-annual variations of the daily average of foF2 were not observed.
[Table 2.] The daily averages of foF2 during the high solar activity in Kokubunji and Hobart.

The daily averages of foF2 during the high solar activity in Kokubunji and Hobart.
As shown in Fig. 2, the Lomb-Scargle period analysis of the daily average of foF2 in the two regions during the two intervals also supported the above results (e.g., Lomb 1976, Scargle 1982). During the high solar activity intaerval, the semi-annual variations of the foF2 in Hobart were less distinct than those in Kokubunji, and during the low solar activity intaerval, the Lomb spectral power was even below a significance level. The variations of the foF2 are affected by geomagnetic activity, and this indicates that geomagnetic activity has different effects on the variations of the F2-layer electron density depending on latitude.
In addition, as shown in Table 2, during the high solar activity intaerval, the averages of the top 10% and the bottom 10% of the daily average of foF2 in Kokubunji were also high in spring and fall, showing the semi-annual variations. On the other hand, for Hobart, the average of the top 10% of the daily average of foF2 was slightly higher in spring and fall, while the average of the bottom 10% was rather lower in spring and fall than in winter and summer, respectively.
As shown in Table 2, the seasonal standard deviations in Hobart were also higher in spring and fall than in summer and winter. This is contrary to Kokubunji, where the seasonal standard deviations were lower in spring and fall than in summer and winter. In other words, during the high solar activity intaerval, for the bottom 10% values of the daily average of foF2 in Hobart in spring and fall, not only the values were lower than other seasons, but also the standard deviations were higher in spring and fall than in summer and winter. This indicates that geomagnetic activity has different effects on the variations of the F2-layer electron density depending on season. In summary, it was found that geomagnetic activity had different effects on the variations of the F2-layer electron density depending on season and latitude. Therefore, in this paper, magnetic storm periods were classified into the spring/autumnal equinoxes and the summer/winter solstices, and the latitudinal variations of the F2-layer electron density were investigated in relation to each seasonal magnetic storm.
3.2 Latitudinal variations of the foF2 in relation to the seasonal magnetic storms
Park & Ahn (2009) predicted the Dst index using 60 monotonously developing magnetic storms between 1998 and 2006. Especially, in the present study, the 60 monotonously developing magnetic storms of Park & Ahn (2009) were classified into the spring/autumnal equinoxes (March~April and September~October) and the summer/winter solstices (May~August and November~February). Then a representative magnetic storm, where distinct latitudinal variations of the foF2 could be observed, was selected for each season, and the results were shown in Figs. 3 and 4.
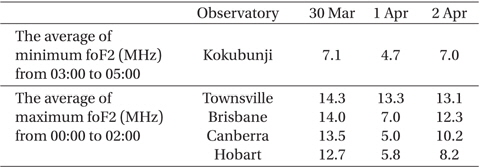
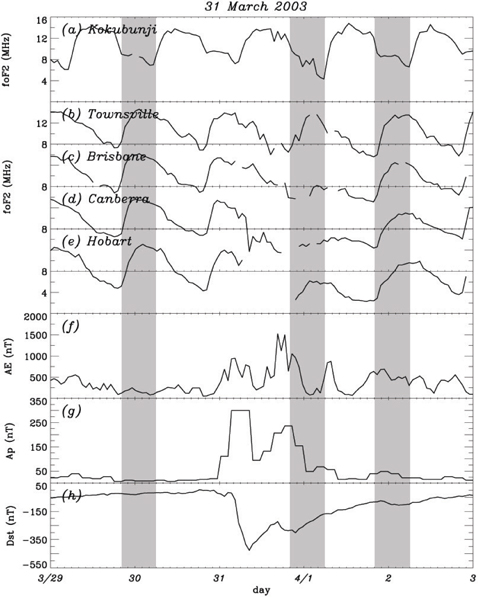
Fig. 3 shows the latitudinal variations of the foF2, the AE index, the Ap index, and the Dst index from March 29 to April 3, 2001. The dynamic pressure effect of the solar wind has been removed from the Dst index (Burton et al. 1975). In Figs. 3b-e, the vertical scale is 0 ≤ foF2 (MHz) ≤ 16, and the vertical scale is overlapped by 8 MHz. From left to right, the dark parts in the figure represent the 20:00~06:00 time intervals of two days before the magnetic storm, the day on which the magnetic storm occurred, and one day after the magnetic storm. The magnetic storm occurred on March 31, 2001, and the minimum Dst index value was -425 nT at around 08:00 on this day. During the recovery phase, the Dst index increased and again decreased to -302 nT, and then recovered to its original state. The Ap index showed maximum values of 300 nT and 236 nT when the Dst index showed the minimum value, and during this period, the AE index also showed maximum values of about 930~950 nT and 1400~1550 nT.
Because of this energy influx from the magnetosphere, the latitudinal variations of the foF2 were also observed after a reaction time of several hours. As shown in Table 3, on April 1, from 03:00 to 05:00, the average of the minimum foF2 values in Kokubunji decreased compared to the value of March 30, which was one day before the magnetic storm. Then it again recovered to its original level on April 2, which was two days after the magnetic storm. In addition, on April 1, from 00:00 to 02:00, the averages of the maximum foF2 values in Townsville, Brisbane, Canberra, and Hobart also decreased compared to the values of one day before the magnetic storm. Then they also recovered two days after the magnetic storm. On the day on which the magnetic storm occurred, the average foF2 values in Kokubunji (03:00~05:00) and Townsville (00:00~02:00) that are located at 26.8°N and 28.4°S decreased by 2.4 MHz and 1.0 MHz, respectively, compared to the values of two days before the magnetic storm, while the average foF2 values in Brisbane (00:00~02:00), Canberra (00:00~02:00), and Hobart (00:00~02:00) that are located at a geomagnetic latitude of 35~52°S decreased by 7.0 MHz, 8.5 MHz, and 6.9 MHz, respectively, which were larger than those in Kokubunji and Townsville.
[Table 3.] The averages of minimum and maximum foF2 during March 30 - April 3, 2001.
The averages of minimum and maximum foF2 during March 30 - April 3, 2001.
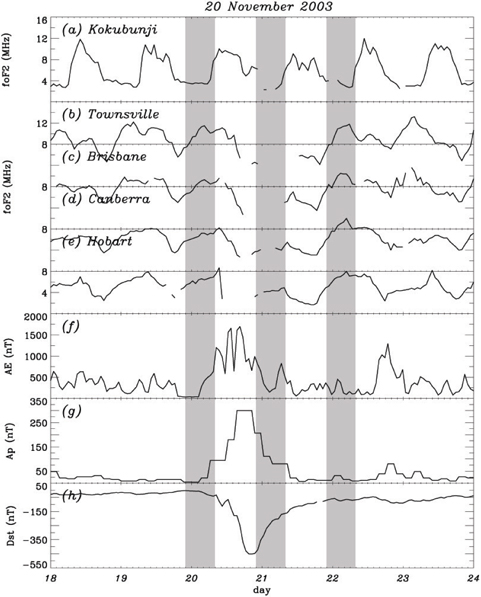
Fig. 4 shows the latitudinal variations of the foF2, the AE index, the Ap index, and the Dst index from November 18-23, 2003, which were presented in a similar way to Fig. 3. From left to right, the dark parts in the figure represent the 22:00~08:00 time intervals of one day before the magnetic storm, the day on which the magnetic storm occurred, and one day after the magnetic storm. The magnetic storm occurred on November 20, and the minimum Dst index value was -451 nT at around 21:00 on this day. At this moment, the Ap index also showed a maximum value of 300 nT. During the main phase, the AE index also showed a maximum value of about 1100~1700 nT.
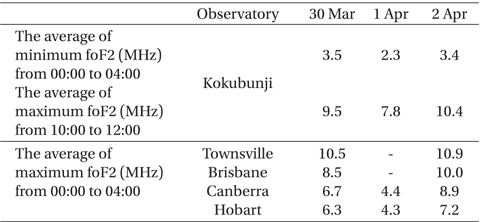
As shown in Table 4, on November 21, from 00:00 to 04:00, the average of the minimum foF2 values in Kokubunji decreased by 1.2 MHz compared to the value of one day before the magnetic storm. Then it again recovered to its original level one day after the magnetic storm. In addition, on November 21, from 10:00 to 12:00, the average of the maximum foF2 values in Kokubunji also decreased by 1.7 MHz compared to the value of one day before the magnetic storm. Then it recovered one day after the magnetic storm. As stated above, it was found that the F2-layer electron density in Kokubunji decreased due to the energy influx from the thermosphere during the magnetic storms. As shown in Table 4, the averages of the maximum foF2 values in Townsville (00:00~04:00) and Brisbane (00:00~04:00) one day before the magnetic storm were 10.5 MHz and 8.5 MHz, respectively. After the magnetic storm main phase, the averages of the maximum foF2 values in these regions (00:00~04:00) on November 21 cannot be quantitatively analyzed due to the data loss, but it is expected to have been decreased, based on the data before and after the lost data. In the magnetic storm recovery phase, the averages of the maximum foF2 values in Townsville (00:00~04:00) and Brisbane (00:00~04:00) on November 22 were 10.9 MHz and 10.0 MHz, respectively, indicating that the F2-layer electron density recovered to its previous level. Also, the averages of the maximum foF2 values (00:00~04:00) decreased by 2.3 MHz and 2.0 MHz, respectively, compared to the values of one day before the magnetic storm. Then they again recovered on November 22, which was the magnetic storm recovery phase.
[Table 4.] The averages of minimum and maximum foF2 during November 20-22, 2003.
The averages of minimum and maximum foF2 during November 20-22, 2003.
During magnetic storms, the heating of the polar upper atmosphere induces the changes in the seasonal mean meridional circulation of the thermosphere, especially the upwelling and downwelling of the neutral atmosphere. This changes the F2-layer electron density by changing the [O]/ [N2] ratio of the neutral atmosphere depending on latitude. Therefore, the effects of the changes in the composition and circulation of the thermosphere on the variations of the F2-layer electron density during the magnetic storms were investigated by examining the relation between the [O]/[N2] ratio of the neutral atmosphere, which had been observed from the TIMED/GUVI satellite during the magnetic storms shown in Figs. 3 and 4, and the latitudinal variations of the foF2.
The TIMED/GUVI satellite has been monitoring the dynamics in the 60~180 km altitude, which belongs to the mesosphere and the lower thermosphere. During magnetic storms, this region experiences changes due to the energy influx from the magnetosphere. Unfortunately, the TIMED/ GUVI satellite started the observation in January 2002. Thus, among the above two magnetic storms, the observed values could be obtained only for the magnetic storm that occurred in 2003, and the results are shown in Fig. 5b. In Fig. 5, it should be noted that the time increases from right to left.
On the day on which the magnetic storm occurred, the [O]/[N2] ratio in Kokubunji that is located at a geographic latitude of 35.7°N decreased compared to the ratio of one day before the magnetic storm. Then it recovered one day after the magnetic storm. In addition, on the day on which the magnetic storm occurred, the [O]/[N2] ratios in Townsville, Brisbane, Canberra, and Hobart also decreased compared to the ratio of one day before the magnetic storm. Then it also recovered one day after the magnetic storm. As stated above, the changes of the observed [O]/[N2] ratio shown in Fig. 5b were closely related with the observed variations of the foF2 shown in Figs. 4a-e. As the [O]/[N2] ratio increases, the production rate of electrons increases while the loss rate decreases, and the F2-layer electron density increases. Therefore, it was found that the changes of the [O]/[N2] ratio due to the changes in the circulation and composition of the thermosphere during the magnetic storm had a large effect on the latitudinal variations of the foF2.
November corresponds to the winter solstice, and at this moment, the mean meridional circulation is expected in the thermosphere, by which upwelling occurs in the Southern Hemisphere (summer hemisphere), and the air moves to the Northern Hemisphere (winter hemisphere) where downwelling occurs. As a result, on November 19 that was before the magnetic storm shown in Fig. 5b, the [O]/[N2] ratio was low in the high latitudes of the Southern Hemisphere, while it was high in the high latitudes of the Northern Hemisphere. The changes in the circulation and composition of the thermosphere occurred due to the heating of the polar upper atmosphere during the magnetic storm, which could be identified by the changes of the AE index shown in Fig. 4f (Brinkman et al. 1992). In the high latitudes, the additional upwelling of the neutral atmosphere was induced at the polar regions of both hemispheres due to the heating of the upper atmosphere. Thus, the air rich in the molecular constituents N2 and O2decreased the [O]/[N2] ratios in the high latitudes of the Southern and Northern Hemispheres, and this could be identified on November 20, at around 20:00 shown in Fig. 5b.
Also, the upwelling of the neutral atmosphere in the high latitudes forms the wind that moves toward the equator by changing the wind that moves toward the pole of the Northern Hemisphere. This wind meets the wind from the summer hemisphere, and undergoes downwelling in the mid- and low latitudes of the Northern Hemisphere (Brinkman et al. 1992). As a result, the influx of the air with relatively high density of O could increase the production rate of electrons. Thus, it was found that the [O]/[N2] ratio increased in the mid-latitudes of the Northern Hemisphere during the main phase shown in Fig. 5b. This became more distinct after the occurrence of the minimum Dst index value. Unfortunately, the observatory was not located in this region, and the above phenomenon could not be observed in the variations of the foF2 shown in Figs. 4a-e. However, it was found that the ionospheric total electron content significantly increased in the mid-latitudes of the Northern Hemisphere, based on the variations of the TEC shown in Fig. 5c.
According to Fuller-Rowell et al. (1996) and Field et al. (1998), if the heating of the upper atmosphere is sufficiently strong and lasts for a long time, the air with abundant molecules that upwelled from the high latitudes of the summer hemisphere could move down to the mid-latitudes of the summer hemisphere. Therefore, it was found that on November 21, from 00:00 to 04:00, the [O]/[N2] ratio decreased in the mid-latitudes of the Southern Hemisphere shown in Fig. 5b. It is thought that the foF2 shown in Figs. 4b-e and the TEC shown in Fig. 5c also decreased accordingly. On November 22, from 00:00 to 04:00, which was one day after the magnetic storm, the disturbance of the thermosphere due to the magnetic storm almost recovered, and the [O]/[N2] ratio, the foF2, and the TEC also recovered to their original levels.
For the high (2000~2002) and low (2006~2008) solar activity intervals, the variations of the daily average of foF2 in Kokubunji at a geomagnetic latitude of 26.8°N and Hobart at 51.6°S were investigated. The results indicated that for both the high and low solar activity, the semi-annual variations of the foF2 in Kokubunji were more distinct than those in Hobart. Also, during the high solar activity intaerval, the seasonal standard deviations of the daily averages of foF2 in spring and fall, when geomagnetic activity is enhanced, were lower than those in summer and winter at Kokubunji, and higher than those in summer and winter at Hobart. This indicates that geomagnetic activity had different effects on the variations of the F2-layer electron density depending on season and latitude. Therefore, during magnetic storms, the seasonal and latitudinal variations of the daily average of foF2 were examined.
In this study, the 60 monotonously developing magnetic storms of Park & Ahn (2009) were classified into the spring/ autumnal equinoxes (March~April and September~October) and the summer/winter solstices (May~August and November~February), and a representative magnetic storm, where distinct latitudinal variations of the foF2 could be observed, was selected for each season (March 31, 2001 and November 20, 2003). During each magnetic storm, the variations of the daily average of foF2, the AE index, the Ap index, and the Dst index in Kokubunji, Townsville, Brisbane, Canberra, and Hobart, which have similar geomagnetic longitude but have different latitude, were investigated. Also, the relation between these results and the [O]/[N2] ratios of the neutral atmosphere observed from the TIMED/GUVI satellite was examined. In addition, the variations of the ionospheric total electron content were examined using a composite GPS TEC map.
Due to the magnetic storm that occurred on March 31, 2001, the average foF2 values in Kokubunji (03:00~05:00) and Townsville (00:00~02:00) decreased by 2.4 MHz and 1.0 MHz, respectively, compared to the values of two days before the magnetic storm. Also, the average foF2 values in Brisbane (00:00~02:00), Canberra (00:00~02:00), and Hobart (00:00~02:00) that are located at a latitude of 35~52°S decreased by 7.0 MHz, 8.5 MHz, and 6.9 MHz, respectively, which were larger than those in Kokubunji and Townsville. Due to the magnetic storm that occurred on November 20, 2003, the average foF2 values in Kokubunji (00:00~04:00), Canberra (00:00~04:00), and Hobart (00:00~04:00) decreased by 1.2 MHz, 2.3 MHz, and 2.0 MHz, respectively, compared to the values of one day before the magnetic storm. The average foF2 values in Townsville (00:00~04:00) and Brisbane (00:00~04:00) cannot be quantitatively analyzed due to the data loss of the day on which the magnetic storm occurred, but it is expected to have been decreased, based on the composite GPS TEC data. During this period, the [O]/[N2] ratios of the neutral atmosphere observed from the TIMED/GUVI satellite and the foF2 values also showed similar variations.
November corresponds to the winter solstice, and at this moment, the mean meridional circulation occurs in the thermosphere, by which upwelling occurs in the summer hemisphere (Southern Hemisphere), and the air moves to the winter hemisphere (Northern Hemisphere) where downwelling occurs. During the magnetic storms, the upwelling of the neutral atmosphere was induced at the high latitudes of both hemispheres due to the heating of the polar upper atmosphere. Thus, the influx of the air with relatively abundant N2 and O2 into the ionospheric altitude decreased the [O]/[N2] ratios in the high latitudes of the Southern and Northern Hemispheres, and it is thought that the daily averages of foF2 in Canberra and Hobart that are located at the high latitudes decreased accordingly. According to Fuller-Rowell et al. (1996) and Field et al. (1998), if the heating of the upper atmosphere is sufficiently strong and lasts for a long time, the air with abundant molecules that upwelled from the high latitudes of the summer hemisphere could move down to the mid-latitudes of the summer hemisphere. Thus, on November 21, from 00:00 to 04:00, the [O]/[N2] ratio decreased in the mid-latitudes of the Southern Hemisphere, and it is thought that the TEC in Townsville and Brisbane decreased accordingly.
March corresponds to the spring/autumnal equinoxes, and at this moment, the mean meridional circulation occurs in the thermosphere, by which upwelling occurs at the Equator, and the air moves to both polar regions where downwelling occurs. If the air, which upwelled from the high latitudes due to the heating of the polar upper atmosphere during magnetic storms, descends on the mid-latitudes of the Southern and Northern Hemispheres, the mid-latitude F2-layer electron density could increase due to the increase in the density of O at the ionospheric altitude. However, the observation indicated that during the magnetic storm on March 31, 2001, the average daily foF2 in Kokubunji and Townsville that are located at the mid-latitudes rather decreased slightly, although the amount of decrease was smaller than that at the high latitudes. As shown above, the ionospheric electron density could be affected by various factors such as the upwelling and downwelling of the neutral atmosphere, the changes of the wind that moves toward the Equator or the Pole, and the changes in the electrodynamics. Therefore, comprehensive observation of the abovementioned factors is required to accurately interpret the variations of the ionospheric electron density.

![The variations of the daily averages of foF2 during high (2000~2002) and low (2006~2008) solar activity intervals in Kokubunji [(a), (c)] and Hobart [(b), (d)].](http://oak.go.kr/repository/journal/13655/OJOOBS_2013_v30n4_231_f001.jpg)
![The Lomb-Scargle periodogram analysis of the daily averages of foF2 during the high and low solar activities intervals in Kokubunji [(a), (c)] and Hobart [(b), (d)]. The horizontal dashed line denotes 99% of significance level in the periodogram analysis and the vertical dotted line denotes the semi-annual period in each of the figures.](http://oak.go.kr/repository/journal/13655/OJOOBS_2013_v30n4_231_f002.jpg)


![Comparison of the thermospheric and ionospheric disturbances during the storm on 20 November 2003. (a) Dst index, (b) [O]/[N2] ratio observed from TIMED/GUVI near noon, and (c) Composite GPS TEC map at 1200 LT.](http://oak.go.kr/repository/journal/13655/OJOOBS_2013_v30n4_231_f005.jpg)


