There was a research on the prolongation of solar cycle 23 by the solar cyclic variation of solar, interplanetary geomagnetic parameters by
The recent solar minimum of solar cycle 23/24 has been discussed in the area of space physics including solar physics as an example of the grand minimum in solar activity. As the change of official onset time of solar cycle 24 has been made by the US Solar Cycle 24 Prediction Panel, the low solar activity was issued more. Especially, Oh & Kim (2013) have mentioned the preceding studies of low solar activity such as solar wind, total solar irradiance associated with the Earth’s climate, and the variation of oceanic temperature. Most of the studies explained the status of the solar cycle 23/24 minimum by comparison with the past grand minimum of Maunder or Dalton minimum. Oh & Kim (2013) also introduced the solar cyclic variation of ten solar, interplanetary geomagnetic (SIG) parameters and their remarkable decrease at the solar cycle 23/24 minimum.
Sunspot has been observed with records of for more than 400 years. The solar cyclic variation of total solar irradiance has been correlated with the sunspot number. However, Oh & Kim (2013) have suggested that the cyclic variation of sunspot number couldn’t explain the variation of total solar irradiance any more. Thus, the approach by the frequency of sunspot appearance on the solar disk and the length of solar cycle is introduced to explain the solar activity instead of the sunspot number. This study analyzes the characteristic of solar cycle such as spotless days near the solar minimum and the length of solar cycle. The characteristics of preceding solar cycle are examined to predict the activity of the following solar cycle.
The flare index (FI) was introduced first by Kleczek (1952). He defined FI as the product of the intensity scale of importance and the duration in minutes. Recently, several studies showed the hemispheric variation (Deng et al. 2013, Feng et al. 2013) and the phase relationships with other solar activity parameters (Gao et al. 2014) using FI. Deng et al. (2013) showed the phase shift of FI between northern and southern hemispheres. They also showed that the activity of flares in the northern hemisphere leads that in the southern hemisphere. Feng et al. (2013) obtained the similar results with Deng et al. (2013). They showed the phase difference (about 6-7 months) of FI between two hemispheres. They also suggested that the activity of flares in the northern hemisphere precedes that in the southern hemisphere. Gao et al. (2014) showed that the activity cycle of FI leads that of sunspot area and coronal mass ejection (CME)-energy. The activity cycle of CME-energy shows the different lag time by the latitudes. The solar magnetic polarity reverses every two solar cycles and the leading sunspot has the same magnetic polarity with the polar magnetic field. That is, if the polar magnetic field is positive in the northern hemisphere, the leading sunspot should have the positive magnetic polarity. On the contrary, the leading sunspot in the southern hemisphere has the negative magnetic polarity opposite to the northern hemisphere. In this study, the hemispheric variation of FI is also examined by the interval that the leading sunspot has the same magnetic polarity from maximum to maximum.
Using the daily and smoothed monthly sunspot number supplied by Solar Data Services of National Geophysical Data Center (http://www.ngdc.noaa.gov/stp/) we have analyzed the characteristics of each solar cycle. Because the daily sunspot number has been recorded since 1818, we have analyzed the spotless days for the periods of 18 solar cycles from 1818 to 2008. Spotless days are the sum of five years around each solar minimum year. The minimum and maximum sunspot numbers in a solar cycle are determined by smoothed monthly sunspot number. They were examined for whole solar cycles and the maximum of solar cycle 24 is set to June 2013. We also use the monthly FI (1976-2010) produced by Kandilli Observatory at Bogazici University. To compare the hemispheric variation, we have divided the analyzed period into four periods which the leading sunspots have the same magnetic polarity, such as from solar maximum to solar maximum.
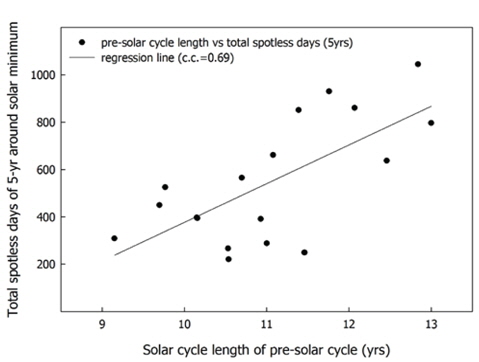
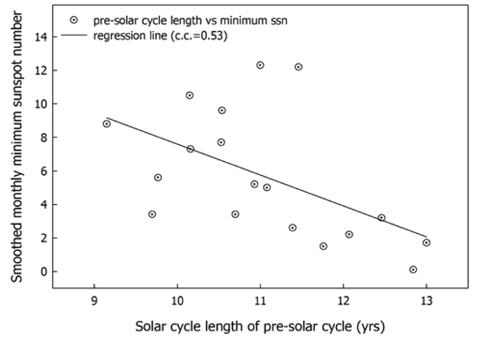
Fig. 1 shows the comparison between the length of preceding solar cycle and spotless days. Spotless days are the sum of 5-year period near each solar minimum. For instance, we compare the length of solar cycle 23 and the sum of spotless days for five years (2006-2010) near the solar minimum at the onset of solar cycle 24. The values of solar cycle length in Fig. 1 are obtained from Fig. 4 of Oh & Kim (2013). According to Fig. 1, as the preceding solar cycle lengthens, the frequency of sunspot appearance gets low at solar minimum period. Oh & Kim (2013) suggested that there might exist a relationship between the length of solar cycle and the degree of solar activity through the analysis of SIG parameters. Fig. 2 shows the plot of the preceding solar cycle length and smoothed monthly minimum sunspot number for the same period in Fig. 1. The minimum sunspot number does not seem to be influenced significantly by the declining solar activity according to Fig. 2. When the length of solar cycle gets longer, the sunspot number gets decreased at the year of new solar cycle onset. However, the length of solar cycle versus spotless days shows better correlation coefficient than the minimum sunspot number. Therefore, the spotless days are more significant as an index of the declining solar activity.
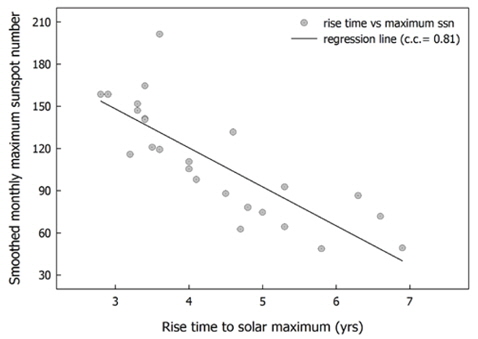
Fig. 3 presents the comparison between the rise time to solar maximum and the smoothed monthly maximum sunspot number. The analyzed periods are 25 solar cycles from April 1750 of solar maximum (The official solar cycle begins at February 1755.) to June 2013. The solar maximum at solar cycle 24 is determined to be June 2013 at which the smoothed monthly sunspot number is the maximum up to the present. As the rise time to the solar maximum gets shorter, the sunspot number increases at the solar maximum. The correlation coefficient between two factors is 0.81, which shows two factors are well correlated.
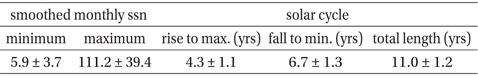
Additionally, Table 1 displays the mean values of minimum and maximum sunspot numbers, and length of solar cycle for 24 solar cycles. Generally, it is well known that the fall time to the solar minimum is longer than the rise time to the solar maximum. As shown in Fig. 3, when the rise time to the solar maximum gets longer, the sunspot number at solar maximum may get decreased. In other words, as the rise time to the solar maximum or the fall time to the solar minimum gets longer, the length of solar cycle gets longer.
[Table 1.] Means of smoothed monthly sunspot number and length of solar cycle.

Means of smoothed monthly sunspot number and length of solar cycle.
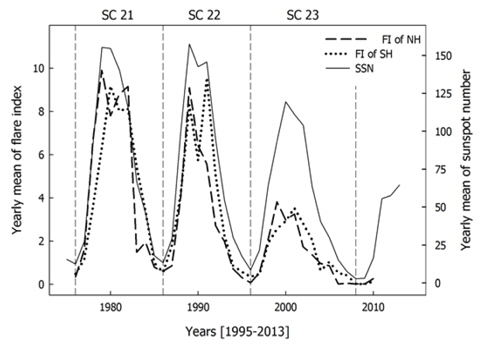
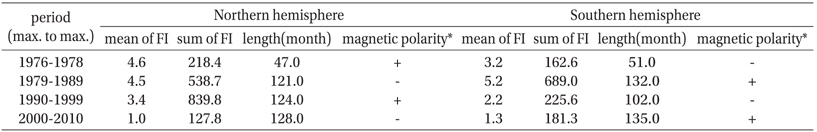
Fig. 4 shows the comparison between yearly FI in northern and southern hemispheres and yearly sunspot number. Before solar cycle 23, FI shows the similar trend with the sunspot number. However, the decrease of FI is greater than that of the sunspot number. It seems like the relationship between total solar irradiance and sunspot number as mentioned above. At each solar maximum, the peak of FI in the northern hemisphere precedes that in the southern hemisphere. When the solar cycle reaches the solar maximum, the flares are more active in the northern hemisphere. When the solar cycle goes over the solar maximum and gets to the decline phase, the flares are more active in the southern hemisphere. These results are consistent with those by Deng et al. (2013) and Feng et al. (2013). In this study, the analyzed periods are divided into four periods from the solar maximum to the solar maximum. These periods are classified by the magnetic polarity of leading sunspots. According to this classification, the activity of flares showed interesting results. It was found that the FI is larger in the hemisphere where the leading sunspots have the positive polarity than in the hemisphere where the leading sunspots have the negative polarity. This tendency can be found in Table 2. On the other hand, the solar cycle disregarding the magnetic polarity has no significant difference in northern and southern hemispheres as shown in Table 3.
[Table 2.] Mean of Flare index (FI) in each hemisphere for the period of maximum to maximum.

Mean of Flare index (FI) in each hemisphere for the period of maximum to maximum.
[Table 3.] Mean of Flare index (FI) in each hemisphere for the period of minimum to minimum.
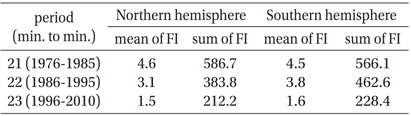
Mean of Flare index (FI) in each hemisphere for the period of minimum to minimum.
This study analyzed the spotless days for the period of five years near the solar minimum, the length of solar cycle and the rise time to the solar maximum as the characteristics of solar cycle. We have examined the predictability of solar activity by the characteristics of preceding solar cycle. We have also analyzed the hemispheric variation of FI for the period in the same magnetic polarity of leading sunspots using monthly FI.
As a result, when the preceding length of solar cycle gets longer, the frequency of sunspot appearance decreases, that is, the spotless days increase. Also, it is shown that the shorter rise time to the solar maximum is highly correlated with the increase of sunspots at the solar maximum. Therefore, the appearance frequency of spotless days and the length of solar cycle are more significant than general sunspot number as an index of the declining solar activity. When the grand minimum in solar activity such as Dalton minimum begins, the length of solar cycle gets longer after the shorter cycle. At solar cycles 22 and 23, the similar trend appeared. A new index to explain the degree of solar activity is needed to prepare the change of solar activity at the advent of the sign for an onset of the grand minimum.
Such as the SIG parameters shown in Oh & Kim (2013), the level of FI gets lower in solar cycle 23 than the preceding solar cycles. The maximum activity of flares appears at the solar maximum in the northern hemisphere and at the decline phase in the southern hemisphere. Thus, the activity of flares in the northern hemispheres leads that in the southern hemisphere. It is also shown that FI is larger in the hemisphere with leading sunspots in positive polarity than in the hemisphere with leading sunspots in negative polarity. The results of FI suggest that the magnetic polarity has to be considered in the analysis of flares such as the flare site at the solar maximum and at the decline phase. It can be also considered in the interpretation on the solar cycle, for instance, the period from solar maximum to solar maximum that has the same magnetic polarity.