The Immersion Grating Infrared Spectrometer (IGRINS) is a near-infrared wide-band high-resolution spectrograph jointly developed by the Korea Astronomy and Space Science Institute and the University of Texas at Austin. IGRINS employs three HAWAII-2RG Focal Plane Array (H2RG FPA) detectors. We present the design and fabrication of the detector mount for the H2RG detector. The detector mount consists of a detector housing, an ASIC housing, a Field Flattener Lens (FFL) mount, and a support base frame. The detector and the ASIC housing should be kept at 65 K and the support base frame at 130 K. Therefore they are thermally isolated by the support made of GFRP material. The detector mount is designed so that it has features of fine adjusting the position of the detector surface in the optical axis and of fine adjusting yaw and pitch angles in order to utilize as an optical system alignment compensator. We optimized the structural stability and thermal characteristics of the mount design using computer-aided 3D modeling and finite element analysis. Based on the structural and thermal analysis, the designed detector mount meets an optical stability tolerance and system thermal requirements. Actual detector mount fabricated based on the design has been installed into the IGRINS cryostat and successfully passed a vacuum test and a cold test.
IGRINS is a near-infrared wide-band high-resolution spectrograph jointly developed by the Korea Astronomy and Space Science Institute and the University Texas at Austin (Yuk et al. 2010). The instrument owes its compact size to the use of a silicon immersion grating as an echelle grating, and can observe the whole H-band and K-band at one time with high resolution (R=40,000) by using a cross-dispersion method. Therefore it is expected to achieve significant scientific results in the study of the formation of stars and planets.
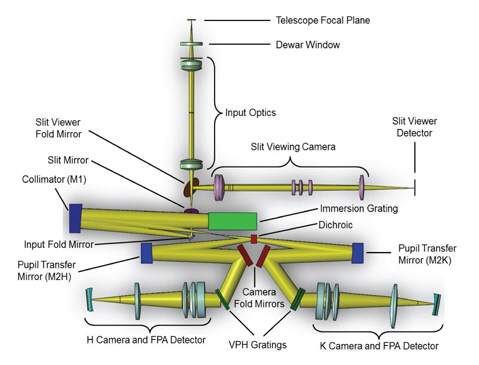
IGRINS consists of four primary modules: a calibration unit (not shown), input relay optics, a slit-viewing camera and H-band and K-band spectrometers. The spectrometer includes an immersion grating, and a separate Volume Phase Holographic (VPH) grating, camera and detector, for the H and K-bands. The optical system of IGRINS employs a silicon immersion grating as an echelle grating. The immersion grating enables the compact design of the instrument and its large continuous spectral grasp (Jaffe et al. 1998, Marsh et al. 2007, Tokunaga et al. 2008).
The path of incoming light into IGRINS as shown in Fig. 1 is described in the followings. The incident star lights through the telescope reach the slit mirror through the input relay optics. The lights reflected at the slit mirror are reflected once again at the slit viewer fold mirror and pass the slitviewing camera and are converted into electric signal in the detector. The lights passed through slit are reflected at the input fold mirror and are collimated at the collimator (M1) and are dispersed by the immersion grating. The lights from the immersion grating arrive at the collimator (M1) again and are reflected to reach the dichroic. The dichroic reflects the H-band lights and passes the K-band lights. The H-band lights reflected at the dichroic pass through the pupil transfer mirror (M2H) and the camera fold mirror to reach the VPH-H grating. The dispersed lights by the immersion grating are focused to become white pupil in the VPH grating (Schroeder 2000) and are cross-dispersed again to split 2-dimensionally. Two-dimensionally split light pass through the H-camera and arrive at the paired detector to be converted into electric signal. Meanwhile, the K-band lights transmitted without reflection at the dichroic surface pass through the pupil transmitter mirror (M2K) and the camera fold mirror to reach the VPH-K grating and are crossdispersed to pass K-camera to be detected in the detector in a similar fashion with the H-band lights (Jaffe 2011).
IGRINS uses three sets of HAWAII-2RG (H2RG) focal plane array (FPA) detectors manufactured by Teledyne Technologies Inc. The detector sets include the SIDECAR ASIC package. In concrete, the FPA detector connects to the one end of the SIDECAR ASIC board through a short flex cable, and the other end of the SIDECAR ASIC board connects to JADE2 card through long flex cable.
We describe here the design, structural analysis, and thermal analysis for the IGRINS detector mount for mechanically mounting the FPA detector and SIDECAR ASIC.
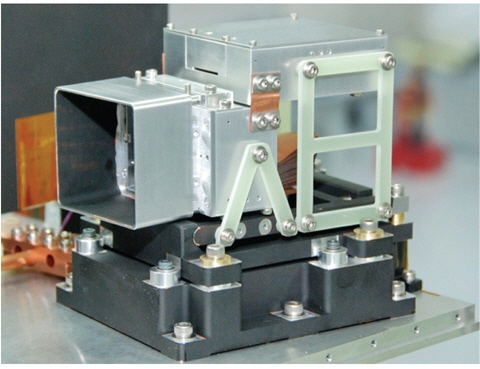
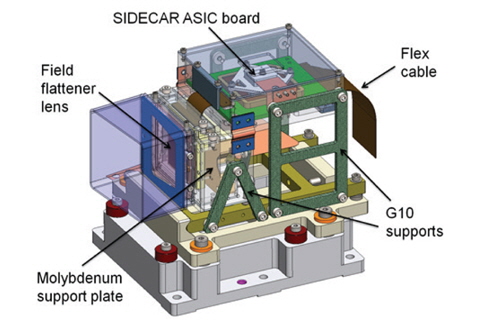
Fig. 2 demonstrates 3-dimensional model of a detailed design for detector mount, and Fig. 3 shows the actual detector mount installed on optical bench. The detector mount consists of baffle, FFL (Field Flattener Lens) mount, detector housing, ASIC housing, and support base. Table 1 lists the dimension, mass, and the materials of the detector housing, the ASIC housing and molybdenum support plate, respectively. The detailed description of each component is given in this section.
[Table 1.] Physical specification of the main parts of the detector mount.
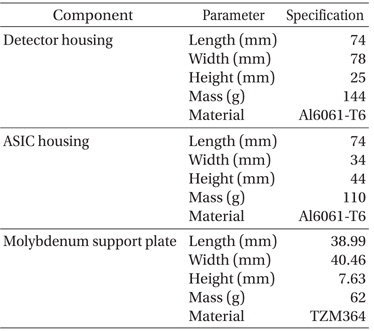
Physical specification of the main parts of the detector mount.
2.1 Field Flattener Lens Mount
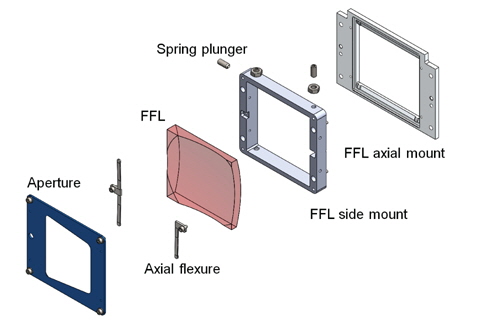
FFL is positioned just in front of the FPA detector, and adjusts the focal length of the 2-dimensionally dispersed light incident on the detector surface after passing through the camera barrel to match the planar surface of the detector. The FFL is made from INFRASIL 301. A FFL-H adjusting the lights from the H-band camera barrel is inclined 3.9 degrees with respect to the detector surface, and a FFL-K is inclined 6.6 degrees with respect to the detector surface (Barnes 2009). FFL is held in structure with a conventional six-point kinematic mount. (Moore et al. 2009), and aligned to the detector surface within tolerance. As shown in Fig. 4, it is designed so that the FFL is held in the FFL mount by pressing it with axial flexures against 3 hard contact points formed on a FFL axial mount, and pressing it with spring plungers against 3 hard contact points formed on a FFL side mount. Total forces exerted on the lens at each of contact points amounts to be 3G (3 times of gravitational force) due to adjustment of width, length and thickness of the flexures, respectively (Avallone et al. 2007, Stahlberger 2010). The material of the FFL mount is aluminum 6061-T6. The inner surface of a baffle connected to the FFL mount is coated with infrared absorption paint (Z306) to reduce stray light.
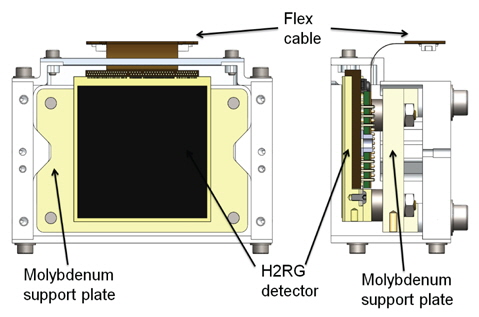
Fig. 5 shows the internal structure of the detector housing. Left panel is a front view of the detector housing and right panel is its side view. H2RG detector with the short flex cable straight up is secured to the molybdenum support plate with nuts. H2RG detector is fixed to a base structure made of molybdenum alloy (TZM364), and has three legs made of invar material which is extruded from the base structure. Thus, in order to reduce the stress applied to the detector when it is cooled down cryogenic, the support plate is made using the same molybdenum alloy (TZM364) as the base structure, and three holes into which the three legs are inserted are a slip fit hole, a slotted hole, and an oversized hole, respectively.
As shown in Fig. 5, both sides of the molybdenum support plate are cut to a concave portion. Detector housing base made of aluminum 6061-T6 has convex projections extruded from its both inner sides. The concave portions of the molybdenum support plate is fit to the convex projections of the detector housing base and then is fixed with screws from the back of the detector housing base with spacers sandwiched between the plate and its back. Because CTE (coefficient of thermal expansion) of the aluminum is greater than molybdenum, when the detector housing is cooled down to 65 K, the detector housing base is more contracted than the support plate. This contraction help the projections of the detector housing base fit to the concave portions of the support plate, thus the center of the H2RG detector is aligned with optical axis. Therefore, in order to reduce the stress exerted on the concave portions by the convex projections when it is cooled cryogenic, a tiny gap between the convex projections and the convex projections is placed at room temperature of 300 K. Requirements for factor of safety is set to be approximately 3. According to the SolidWorks® structural analysis results, when the gap is 60 μm, the cooling from 300 K to 65 K causes principal stress of 326.7 MPa to the molybdenum plate. Because the yield strength of the molybdenum is 860 MPa, safety factor approaches to 3, this implies the structure of the support plate is safe when the pressure due to thermal contraction of the detector housing is applied to the support plate. When the gap is 80 μm, principal stress of 36 kPa is developed. But too much gap would cause no contact between the plate and the detector housing base. As a result, it may cause a problem in alignment of detector to the optical axis. Therefore, 60 μm gap and ±10 μm fabrication tolerance have been determined on the basis of the results of structural analysis.
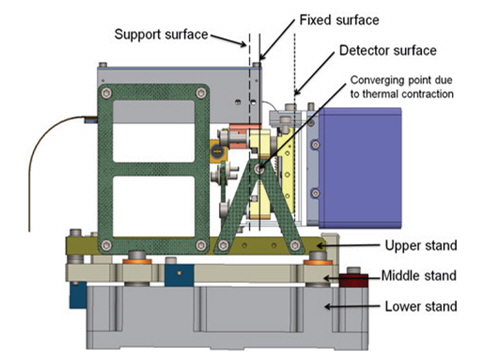
Let us look into the positional changes of the detector surface in the optical axis direction due to the cooling from 300 K to 65 K. Fig. 6 shows the side view of the 3-dimensional detector mount model which is depicted in Fig. 2. The side of the detector housing is treated transparently so that the internal structure of the detector housing can be seen.
As shown in Fig. 6, the detector housing connects to the upper stand of the support base frame through a triangular G10 support made of insulator material. A detector surface (dotted line), a fixed surface (solid line), and a support surface (broken line) are indicated in Fig. 6. The detector surface is where the spectrums are formed in the H2RG detector. The fixed surface is a virtual plane normal to the optical axis that passes the contact points of the triangular G10 support which support the side of the detector housing. The support surface is the interface that the molybdenum support plate is in contact with the aluminum spacer.
Table 2 shows the relative distance of the detector surface from the fixed surface which is set as origin. When the detector mount is at 300 K, the detector surface is away from the fixed surface by 17.16 mm. If the detector housing cools down to 65 K, the fixed surface moves toward the support surface due to the contraction of aluminum between the support surface and the fixed surface.
[Table 2.] Coordinate values labeled by setting the supporting surface as an origin. (mm in units)
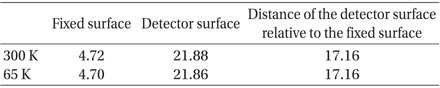
Coordinate values labeled by setting the supporting surface as an origin. (mm in units)
Since the integrated linear thermal expansion coefficient of aluminum alloy is 4.2×10⁻³, the calculated displacement is about 0.02 mm (see Table 2). Also, the detector surface moves toward the support surface due to the contraction of molybdenum between the detector surface and the support surface. Since the integrated linear thermal expansion coefficient of molybdenum alloy (TZM364) is 9.3×10⁻⁴, the displacement is about 0.02 mm (see Table 3). Thus, the distance between the fixed surface and the detector surface is 17.16 mm when the detector housing is at the temperature of 65 K. It shows that the relative position of detector surface against the fixed surface does not change by cooling down to very low temperature (65 K) from 300 K (Marquardt et al., 2000). It has an advantage to make the image surface formed by optical system align with the detector surface easily.
[Table 3.] Physical properties of materials constituting the detector mount.
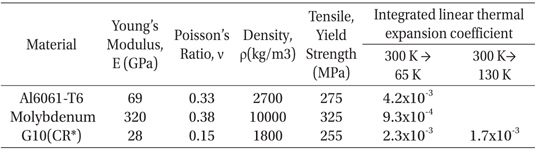
Physical properties of materials constituting the detector mount.
Next, let us look into the positional changes of the detector surface in the horizontal direction. As we can see from Fig. 2, because the detector mount has left/right symmetry, amount of the thermal contraction also has left/ right symmetry. Thus, center of the detector surface remains unchanged even though temperature of the detector surface changes.
Next, the displacements of the detector surface in the vertical direction are investigated when it cools down to very low temperatures. As depicted in Fig. 6, the detector housing is supported on the upper stand of the base frame by the tri-angular G10 support. On the contrary, the camera barrel is made up of aluminum largely. Therefore, when it cools down cryogenic, the elevation difference of center of the detector surface and the optical axis of camera barrel coincides with the difference in the amount of contraction of G10 support in the vertical direction and the corresponding amount of contraction of aluminum of equal length.
The height of G10 support in the vertical direction is 34 mm. While the temperature of G10 support at the upper supporting point of detector housing is 65 K, the temperature of G10 support at the lower supporting point is 130 K. Therefore, in order to calculate the amount of contraction of G10 support, the integrated linear thermal expansion coefficient of 2.0×10⁻³ at 100 K which corresponds to the average temperature of two temperatures is used (see Table 3). Since the amount of contraction of aluminum is 112 μm and that of G10 support is 68 μm, the difference is calculated to be 44 μm. It means that the height of the centerline of detector surface is elevated by 44 μm than the optical axis of the camera barrel. Because the difference in elevation is small enough which corresponds to 2 pixels of detector surface array, the impact on the imaging performance is negligible. Thus, the difference is neglected in the design of the detector mount.
Regarding the assembly of the detector mount, the height of the center of the detector surface is fit within fabrication tolerance of a dowel pin (±10 μm) by using the dowel pin to the locating plate which is placed between the side of the detector housing and the upper stand of the base frame. Also, the height between a lower stand and a middle stand constituting the base frame and the height of the pin hole formed in the side of the upper stand are fabricated within tolerance (±10 μm).
As can be seen from the 3-dimensional model of the detector mount, the SIDECAR ASIC board sits within the ASIC housing which is attached to the upper stand through a rectangular G10 support. A 20 mm flex cable coming out of the top surface of the detector housing connects to the one end of the ASIC board. In order to reduce the overall space occupied by the detector mount, it is designed so that the detector is perpendicular to the ASIC board. The other end of the ASIC board connects to a JADE2 card through long flex cable at the bottom of the ASIC housing. The SIDECAR ASIC board is placed inside chamber and the JADE2 card is outside chamber, thus the long flex cable has to pass through the wall of the chamber to connect the SIDECAR ASIC board and the JADE2 card. To this end, it is designed so that the vacuum inside the chamber is kept by providing a vacuum wall-through structure in the bottom of the chamber and by sticking the long flex cable to the vacuum wall-through structure with epoxy resin so as to penetrate it.
The support base frame is a three-piece assembly fabricated from aluminum 6061-T6 (see Fig. 6). The lower stand is fixed at a precise location on the optical bench with the dowel pins. The middle stand is fixed to the lower stand with screws, and screw holes are oversized slots. Thus, by using three bumpers and adjusting the size of each bumper, the middle stand can be shifted in either horizontal direction (Wilson 2010, Wilson et al. 2010). As a result, the detector housing which is supported to the upper stand with the G10 support can be shifted precisely along or horizontally across the optical axis so that the detector mount can serve as an alignment compensator. In concrete, by adjusting the bumper’s diameter finely in precision of ±10 μm, the focus of the detector surface can be controlled in the optical axis direction, and by separately adjusting the bumper’s diameter, the yaw angle of the detector surface also can be controlled finely.
Next, let us explore the structural relation between the middle and the upper stands. The front end of the middle stand has an projection part formed upward, and recesses having a cross-section of a right triangle is formed to the projection part (see Fig. 2 and 6). The front end of the upper stand having a cross-section of semicircular shape is tangential contacted to the recesses of the middle stand, and the upper stand is supported over the middle stand by inserting supporter shim ring between back end of the middle stand and back end of the upper stand. Thus, pitch angle of the detector surface can be adjusted by changing thickness of the supporter shim ring finely in precision of ±10 μm.
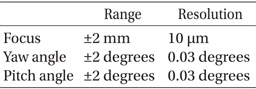
As mentioned above, the present detector mount is designed so that the focusing, yaw angle, and pitch angle of the detector surface can be adjusted finely by changing the thickness of the bumper and supporter shim ring precisely, thus meets the mechanical requirements which are summarized in Table 4. This means that the present detector mount can be served as an alignment compensator.
[Table 4.] Mechanical requirements for the detector mount.

Mechanical requirements for the detector mount.
3. STRUCTURE ANALYSIS AND STABILITY TOLERANCE
Optical tolerances can be divided into a pre-assembly tolerance and a post-assembly tolerance in general. Pre-assembly tolerance is required to install optical components to the accurate positions which are determined by the optical design. The fabrication tolerance and the alignment tolerance of the IGRINS optical tolerances correspond to the pre-assembly tolerance. Post-assembly tolerance is required to be met with respect to the bending and the deformation caused by the gravity or internal moving mechanism during the operation stage of the equipment. The component stability tolerance and the alignment stability tolerance correspond to the post-assembly tolerance (Rukdee et al. 2012).
It is not necessary to consider the fabrication tolerance of optical components in the design of mechanical mount. However, based on the alignment tolerance imposed on the optical components, the fabrication tolerance and the alignment tolerance of the mechanical mount are determined. The alignment tolerance of a mechanical mount can be satisfied by adopting the precision-machined locating pin approach. Therefore, the post-assembly tolerance is of primary interest for the structural analysis rather than the pre-assembly tolerance, an optical system mount should be designed to satisfy the optical component stability tolerance and the alignment stability tolerance.
3.1 Gravitational Flexure and Alignment stability tolerance.
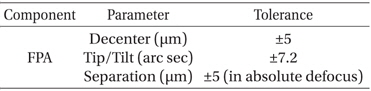
The IGRINS will be mounted at the Cassegrain focal plane of 2.7 m HJST of the McDonald Observatory and moves together with the telescope while observing. Thus, the gravitational direction applied to the instrument varies with altitude change of the telescope, consequently the gravitational deflections of the mechanical mount structure also change. The tolerance analysis results of the optical design requires the gravitational deflections of the instrument structure to be smaller than the alignment stability tolerance during one-hour exposure or maximum 15° altitude change. In the case of IGRINS design, the component stability tolerance to the detector surface is allocated, but it is estimated that the present mount design could meet enough it, thus the structural analysis to that have not been performed (cf. Park et al. 2012). The alignment stability tolerance for FPA (detector surface) is summarized in Table 5.
[Table 5.] Alignment stability tolerances of the FPA (Jaffe 2011).

Alignment stability tolerances of the FPA (Jaffe 2011).
SolidWorks® Simulation Premium 2013 was used in order to perform the simulation of finite element method in regard to the deformation of the mechanical mount structure due to gravity.
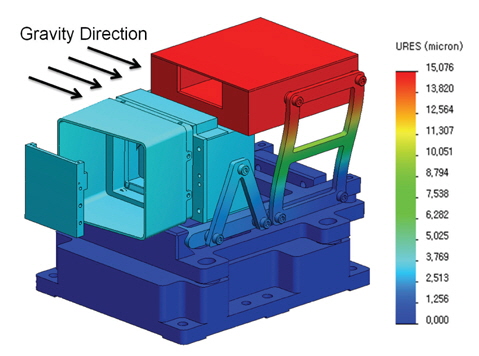
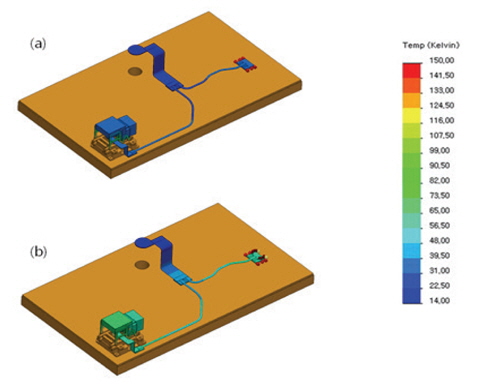
Fig. 7 shows the deformation of the detector mount structure by the gravity of 1G acting in the right-hand direction for 3 gravity direction shown in Table 6. While the displacement of FPA is 4 μm, it meets the decenter stability tolerance.
[Table 6.] Gravitational flexure with directional change.

Gravitational flexure with directional change.
The maximum tip/tilt is calculated to be 2.4 arc second by the gravity of 1G acting in the vertical direction to the FPA satisfying the tip/tilt alignment stability tolerance. Also, the separation of 1 μm meets the separation stability tolerance satisfactorily. As shown in Figure 8, the relative displacement of G10 support is to be 15 μm. Therefore, considering the amount of thermal contraction due to cryogenic cooling, it is necessary to investigate Factor of Safety of the G10 support.
[Fig. 8.] Distributions of the displacement and the factor of safety in the rectangular G10 support.
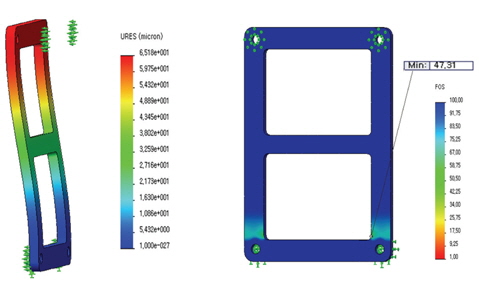
As can be seen in Fig. 7, the rectangular G10 support which supports the ASIC housing is displaced by maximum of 15 μm by the gravity acting in the parallel direction of FPA. In addition to this, the amount of thermal contraction of G10 support is calculated to be 50 μm due to the cryogenic cooling. Thus, it is necessary to look into the distribution of the factor of safety when the displacement of the rectangular G10 support is to a maximum 65 μm.
Fig. 8 shows the results of finite element analysis of the displacement and the factor of safety when the rectangular G10 support displaces by 65 μm. The perimeter of the screw hole of the lower part of G10 support is geometrically fixed as a boundary condition and the reference configuration condition is imposed on the perimeter of screw hole of the uppermost part. Since the minimum value of the factor of safety of rectangular G10 support is 47 at the minimum, it means that the rectangular G10 support is safe for the deformation by gravity and thermal contraction. When the same stress analysis is applied to the V-shaped G10 support, it was calculated that the minimum factor of safety was 10, indicating that it is also structurally safe for the gravity and the thermal contraction similar to the rectangular support.
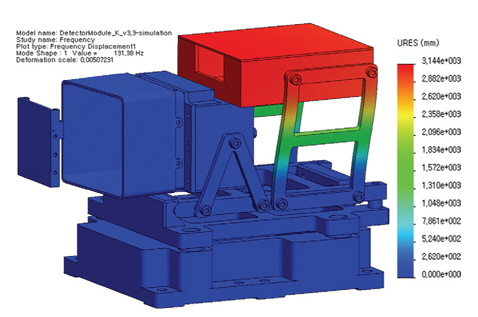
Dynamic instability usually occurs by the resonance frequency of the mechanical support structure. Thus, in addition to the bending by the gravity, the resonance frequency of the detector mount structure should also be analyzed. Fig. 9 shows the result of resonance frequency analysis by finite element analysis. The first mode resonance frequency is 131 Hz where ASIC housing oscillates laterally. The result of resonance frequency strongly depends on the parameters of the modulus of elasticity and the Poisson’s ratio of the G10 material used in the calculation. The modulus of elasticity used in this calculation is 28 GPa and the Poisson’s ratio is 0.15 for cryogenic G10 (CR) (Hastings & Montgomery 1993, Stahlberger 2010). Meanwhile, applying the modulus of elasticity of 19 GPa and the Poisson’s ration of 0.30 (Ravi-Chandra & Satapathy 2007), based on the general G10 physical property, the first modal frequency is calculated to be 93 Hz. It is known that the resonance frequencies of external vibrations by the freight transport are about 10~20 Hz and the resonance frequency of the earthquake can be up to 50 Hz. Therefore, in order to avoid resonance, the first modal resonance frequency should exceed the possible resonance frequency of the external vibration. According to the results of current structural analysis, the first modal resonance frequency of the detector mount is over 90 Hz, thus, there is no possibility of resonance by the external vibration.
In this section, the static temperature distribution and transient temperature distribution of the detector mount are investigated through FEA thermal calculation method. Simplified thermal analysis model and the boundary conditions are described and the results of calculation are described and analyzed.
4.1 Thermal model and boundary conditions
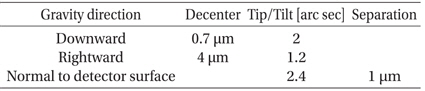
Fig. 10 depicts the thermal analysis model and the boundary conditions in order to obtain the static temperature distribution. The H-band detector mount which is installed on the left side of the optical bench is connected thermally to the cold finger through a copper bar passing through the junction. Although it is not depicted in Fig. 10, the 2nd cooling terminal of M1050 cooler manufactured by Helix Technology is thermally connected to the cold finger. Originally, the K-band detector mount and the slit viewing detector camera (SVC) are thermally connected to the K-station, those are not included in the thermal analysis directly for the sake of convenience.
Since these detector mounts transfer the radiant energy received from the radiation shield and the optical bench to the cold finger through the station in thermal equilibrium, whole simulation effect could be obtained by supplying heat corresponding to the radiation energy and heat conduction energy to the station. The boundary conditions for the simulation are described as follows. The temperature of the radiation shield and the optical bench, 130 K; the temperature of cold finger, 14 K; the emissivity of the surface of optical bench, 0.1; the emissivity of internal wall painted with black paint of radiation shield, 0.9 (LORD Corporation 2004); the emissivity of the surface of the detector mount, 0.05. Considering the amount of heat transferred to the K-band detector mount and the junction of SVC detector mount (K-station) by the thermal radiation of 130 K, 0.4 W per hour is given. 0.2 W per hour is given as the amount heat supplied during the operation of ASIC board. Since the inflow of heat into K-station is twice the amount of heat into H-station and the length of copper bar connecting K-station is half the length of copper bar connecting H-station, consequently, the fact that the steady state temperatures of two stations are the same each other is used for another boundary condition.
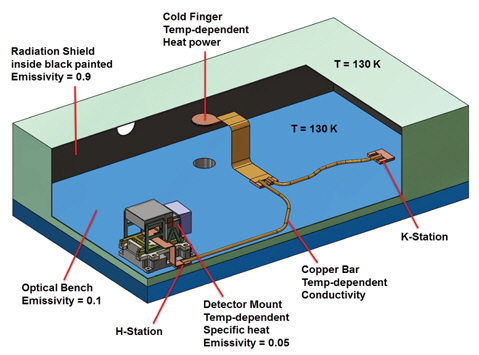
Fig. 11 shows the temperature distribution of the detector mount in thermal equilibrium condition obtained through the simulation. Fig. 11a indicates the temperature distribution of detector mount in thermal equilibrium without adding additional heat and with the power supply of ASIC board turned off. The detector temperature that meets the prescribed boundary conditions is about 40 K. Also, the FPA temperature and the temperature around the detector housing agree each other within 0.1 K of difference. This means that it is not necessary to attach a temperature sensor directly onto FPA since the temperature of detector can be estimated to a high level of accuracy using the temperature of the detector housing. The same result was obtained from the cooling down experiment using a test Dewar.
Fig. 11b shows the temperature distribution of detector mount in thermal equilibrium with adding 0.1 W output from thermal resistance heater and with the power supply of ASIC board turned on. The detector temperature is calculated to be about 65 K, in this case.
In order to meet the temperature requirement of Table 7, a thermal resistance heater to heat up the detector housing and the cold strap to control the temperature are installed to the back panel of the detector housing. Also, installing the temperature sensor around the heater to monitor the temperature, a temperature control closed loop is constructed. Although it is possible to design a system where the temperatures of the detector housing and the ASIC housing are controlled independently, the system design would be complicated to install the thermal resistance heater, the temperature sensor, and the cold strap independently. In the present design of the detector mount model, the detector housing and the ASIC housing are thermally connected through a cold strap and the temperatures of both housing are controlled at the same time.
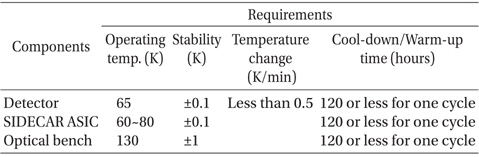
[Table 7.] Thermal requirements for IGRINS.

Thermal requirements for IGRINS.
According to the results of cooling test using the actual IGRINS cryostat, the temperature of the detector housing showed a stability of 65 ± 0.01 K. Also, the temperature of ASIC housing is stabilized at 0.6 K higher than that of the detector housing. Therefore, it was confirmed that the current design met the temperature requirements satisfactorily.
4.2 Transient Thermal Behavior of the Detector Mount
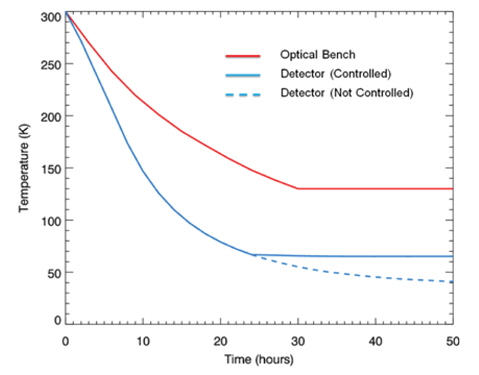
In order to examine the temperature variation of detector mount as a function of elapsed time, a simulation was performed. After the temperature variation of the optical bench as a function of elapsed time (Oh et al. 2011) was fed into the thermal analysis model depicted in Fig. 10 and the final equilibrium temperature of the cold finger of the cooler was set to 14 K (Helix Technology Corporation 2002), the trend of temperature variation in the detector mount was simulated. Fig. 12 shows the results. The cooling time of detector housing to 65 K is about 25 hours and the cooling rate of maximum slope in the temperature curve is 0.25 K/min. Thus, these results meet the system cooling performance requirements which specify that a cycle of cooling down and warm up should be completed within 120 hours and cooling rate below 0.5 K/min.
The present manuscript has addressed in detail design and structural and thermal analysis of successful mount to three sets of H2RG SIDECAR ASIC detector constituting particular infrared high resolution spectrometer IGRINS which employs an innovative optical component, namely immersion grating.
First, in order to utilize the detector mount as an optical system alignment compensator, it has been designed so that the detector surface can be shifted in longitudinal and horizontal directions by finely adjusting the thickness of three bumpers, the yaw angle of the detector surface is finely adjustable by separately manufacturing the thickness of each bumper, and the pitch angle of the detector surface is finely adjustable by changing the thickness of the support shim ring.
Second, differences in deflections with the gravitational direction have been explored with FEM to look into the structural stability of the detector mount. Maximum deflection is caused by the gravity in the horizontal direction, but that is just decenter of 4 μm from the center of the detector surface. Thus, our design meets the alignment stability tolerance with respect to the gravity in any directions. The structural stability of the G10 support against the thermal contraction of aluminum material also has been explored. Because safety factor (FOS) is greater than 10 with respect to maximum deflection of the G10 support, it has been verified that the present detector mount design is safe enough against thermal shock. Resonance frequency analysis to the overall structure of the detector mount has yielded 1st mode resonance frequency higher than 100 Hz, so this means that the present mount design has a sufficiently rigid structure.
Third, in order to explore if the present mount design meets thermal requirement, 3-dimensional simplified thermal analysis model has been constructed, and then FEM thermal analysis with time has been performed. It takes about 25 hours to reach 65 K which is operation target temperature of the detector mount, and the cooling rate that temperature falls at early most rapid cooling interval represents gradient of about 0.25 K/min. Therefore, total cooling time of suitable level and sufficiently slow cooling rate satisfy well all thermal conditions required to IGRINS detector system.