Many aquaculture businesses are intent not only on maximizing productivity and profitability, but also accomplishing this using environmentally responsible practices. Efficient use of energy (e.g., pumping of water) and natural resources (surrounding environment, ambient water supply, and waste streams) are key elements in this approach. Land-based recirculating aquaculture systems facilitate greater control over culture water and waste discharge than flow-through systems (Blancheton et al. 2009). Though the surrounding environment may be enhanced by moderate volumes of aquaculture discharge (White et al. 2011), the trend toward larger land-based facilities (e.g., 1,000 metric tons finfish production per year) and the associated effluent waste may pose a risk of local eutrophication. Alternatively, integration of seaweed and land-based marine finfish culture can convert these nutrients to a usable product. Previous investigations into land-based seaweed integration have included Gracilaria sp. alongside Atlantic salmon (Troell et al. 1999); Chondrus crispus Stackhouse, Palmaria palmata (Linnaeus) Weber & Mohr, and Gracilaria bursa-pastoris (S. G. Gmelin) P. C. Silva with turbot and sea bass (Matos et al. 2006). Commercial application of seaweed-halibut integration has been previously documented only by this research group. Earlier small-scale experiments conducted in the lab established baseline effects of temperature and high nutrient levels on cultivation of P. palmata (Corey et al. 2012, 2013). Subsequent small-scale studies in halibut effluent on-site at Scotian Halibut Ltd. investigated appropriate stocking density for cultivation, though tank size was not representative of commercial application (Kim et al. 2013). Yet another level of experimentation sought to decrease the operating costs of land-based seaweed cultivation by means of interrupted aeration (Caines et al. 2014).
Palmaria palmata is an edible seaweed with actual and potential economic value (D. Bennett, Sea 2U Foods Inc. personal communication). Palmaria has long been consumed in Eastern Canada and the United States, and its antioxidant properties may provide health benefits (Cornish and Garbary 2010). This alga accumulated N and P in tissue when exposed to high-nutrient seawater (Corey et al. 2012, 2013), even when growth was limited by other environmental factors (Martínez and Rico 2002). In addition, P. palmata grew well between 6 and 14°C (Morgan and Simpson 1981a, 1981b), similar to Atlantic halibut.
Atlantic halibut [Hippoglossus hippoglossus (Linnaeus 1758)] are native to the Atlantic coast of Canada and thrive at water temperatures of 10-14°C (Hallaråker et al. 1995, Jonassen et al. 2000). Aquaculture of halibut in Atlantic Canada is small, with a total production of around 50 t in 2010, approximately 50% of which was produced in land-based farms (B. Blanchard, Scotian Halibut Ltd. personal communication).
For this study, integration of Palmaria palmata and Atlantic halibut was established within a land-based recirculating aquaculture facility for one year to evaluate the growth and nutrient uptake characteristics of the seaweed in a commercial application. This study was essential to compare the bioremediation capacity of P. palmata under both lab and small-scale applied conditions toward development of a model for land-based integrated aquaculture.
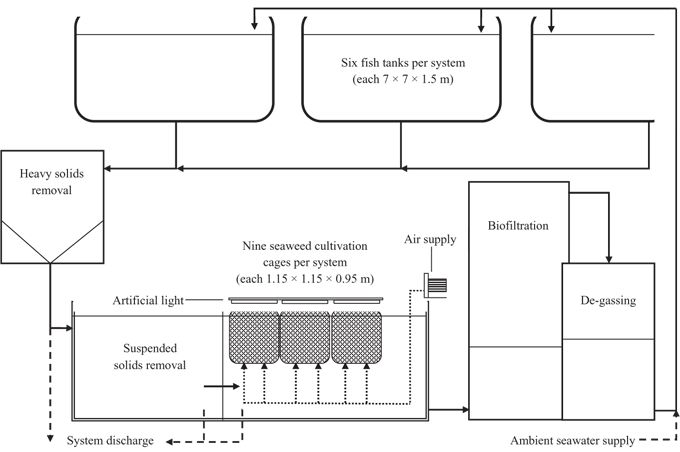
Palmaria palmata was collected in June 2009 from natural populations in the low-intertidal zone of the Bay of Fundy, at Point Prim, Digby County, Nova Scotia (44°41′29.0″ N, 65°47′12.0″ W), where it is commercially harvested (Garbary et al. 2012). Algal material was placed in mesh cages in recirculating aquaculture systems at the land-based Atlantic halibut nursery site of Scotian Halibut Ltd., Wood’s Harbour, Nova Scotia (43°31′2.2″ N, 65°44′16.0″ W). Three independent seaweed culturing tanks were established, two mid-stream of an Atlantic halibut recirculating system (Fig. 1) and the third (Ambient) receiving filtered (50-80 μm) seawater only. Data were collected from November 2009 until October 2010.
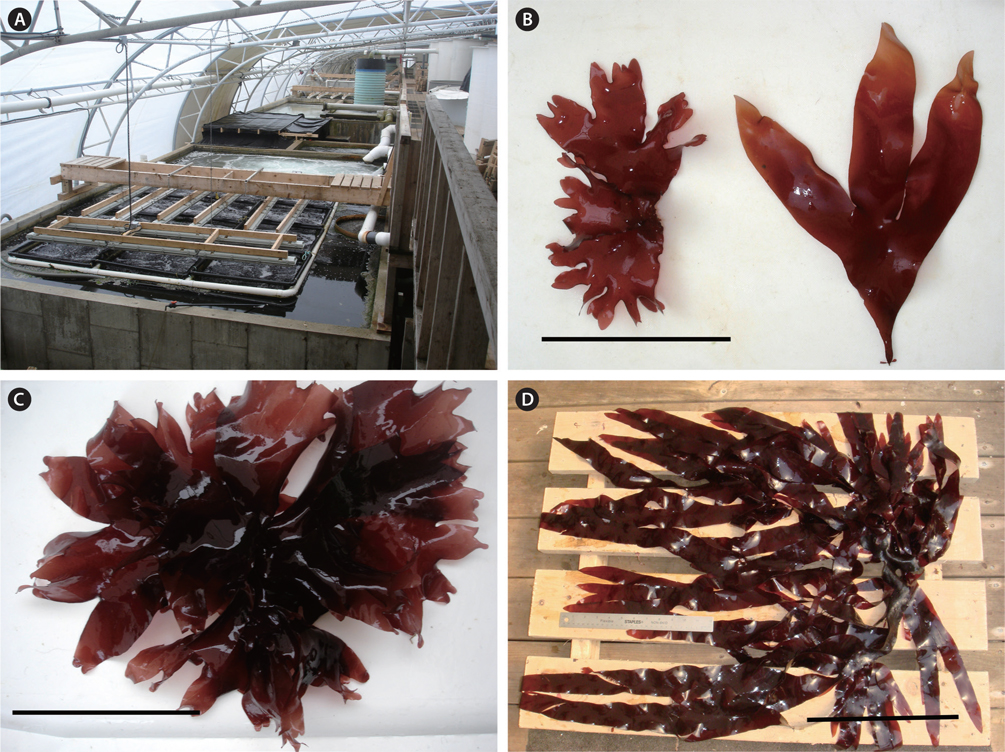
Total volume of each indoor commercial aquaculture system was approximately 500 m3 with a holding capacity of 6-8 t of Atlantic halibut. Solids filtration was accomplished by a swirl separator for removal of heavy waste, followed by diffused air flotation for removal of suspended solids. The seaweed was held in cages that were 0.95 m deep with a surface area of 1.32 m2 and volume of 1.25 m3 constructed of extruded plastic mesh (7 × 7 mm mesh size; Vexar, DuPont, Toronto, Canada). The cages were suspended at the water surface within the waste water collection sump (4.9 × 5.7 × 1.65 m deep) of the recirculating systems (Fig. 2). Nine of these cages were used in each of the three culture systems.
To keep the seaweed in suspension, air was supplied beneath each cage using four regenerative blowers each of 4-4.5 hp. Air was delivered continuously via two pipes about 0.6 m apart with 1.2 mm diameter holes with 5 cm spacing. Air was supplied beneath the cages continuously such that two rows of air bubbles, approximately 0.6 m apart rose through the cages. Light was supplied by natural sunlight through a translucent tarp structure, supplemented with 32 W, 5,000 K white T8 fluorescent lamps (six bulbs per cage; Philips, Somerset, NJ, USA). The minimum and maximum irradiance at the water surface, was 100 and 1,460 μmol photons m-2 s-1, respectively (Li-193SA spherical sensor, Li-Cor, Lincoln, NE, USA). A 16 : 8 L : D photoperiod was maintained throughout the year using the fluorescent lamps controlled by an automatic timer. Salinity was 29 to 31 psu over the study period.
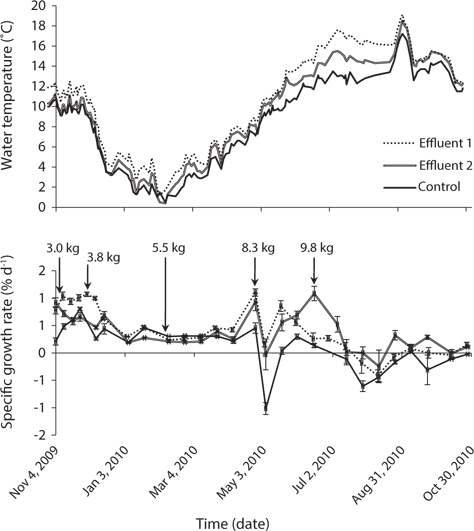
Water temperature ranged from 0.4°C in February, 2010 to 19.1°C in September, 2010 (Fig. 3). Temperature of Effluent 1 was about 1°C higher than Effluent 2 most of the year, increasing to about 2°C during June to August due to differences in water exchange rates between the systems. The rate of seawater inflow was governed according to fish biomass and feed loading of the system. The temperature of the control system ranged from 0.5°C in February and 17.2°C in September, and was on average 1.4°C cooler than the two effluent systems. The difference was greatest during June to August when water temperature of the control system was up to 3.6°C cooler than the effluent systems. The primary site of thermal losses and gains was carbon dioxide de-gassing by spilling over dispersal plates to maximize water surface exposed to the air within the effluent systems.
Mean pH of Effluent 1 and 2 systems was similar, 7.5 and 7.4 respectively, both ranging from 7.0 to 8.0. Control system pH was 8.0 on average (range 7.7-8.5).
Total nitrogen concentrations in all systems varied with season. From January to March, when water temperatures were sub-optimal for culture of Atlantic halibut, the appetite of the fish was low. This resulted in total nitrogen concentrations as low as 19 μM (standard error [SE], ±5.0) and 13 μM (±1.4) in Effluent 1 and 2, respectively. From May to October, when feeding rates were increased, mean total nitrogen concentrations were 126 (±24.4) and 166 μM (±27.8) for Effluent 1 and 2, respectively. Mean total nitrogen value of the control system was 18 μM (±4.4) between January and April, and 12 μM (±1.2) from May to October. Nitrate concentration as a proportion of total nitrogen averaged 81 to 88% for all three systems, originating from both nitrate in the natural environment, and the bacterial nitrification of ammonium excreted by the fish. Phosphorus concentration ranged from 2.6 μM (±0.03) in February to 17.7 μM in August PO43+ and 0.3 μM (±0.02) in March to 15.9 μM (±4.60) in October PO43+ for Effluent 1 and 2, respectively. Phosphate in the control system ranged from 0.2 μM (±0.08) in October to 5.5 μM (±2.82) in January PO43+. Mean nitrogen : phosphorus ratio in the water was 19.8 (±2.1), 23.4 (±1.7), and 24.9 μM (±2.2) for Effluent 1, Effluent 2, and control, respectively.
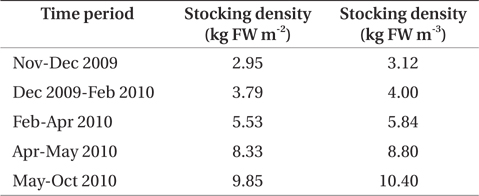
Palmaria palmata was stocked into each cage at an initial biomass of 3.0 kg fresh weight (FW) m-2 in November 2009. The biomass in each cage was measured bi-weekly. FW was obtained after removal of excess water by spinning in a domestic washing machine (drum diameter 53 cm and depth 35 cm; Maytag, Benton Harbor, MI, USA). Seaweed biomass in each cage was restored to initial stocking density at each weighing by removal of whole fronds or addition of materials from plants held on reserve in the same halibut system. Samples were taken for dry weight (DW) at each biomass survey. Surplus seaweed material was stored in a separate culture vessel receiving aquaculture effluent. As material was available, the stocking density of the cages was increased at intervals of three weeks to three months to a maximum biomass of 9.8 kg FW m-2 in May 2010 (Table 1). This was done in an attempt to observe differential nutrient concentrations of the water between inlet and outlet of the seaweed tank.
DW and moisture content were determined by drying tissue samples to constant weight at 60°C. Using the biomass data collected bi-weekly, specific growth rate (SGR, expressed as % d-1) was calculated using the following equation:
, where FW1 and FW2 are the fresh weights at days T1 and T2, respectively. Productivity was measured as overall biomass increase in each cage between samplings.
Water samples were collected at 08:00, 14:00, and 20:00 the day following each biomass survey. Nitrate and nitrite concentration was determined by the nitrite cadmium reduction method (Jones 1984). The NH4+ concentrations were analyzed using the method of Liddicoat et al. (1975). Percent unionized ammonia was determined at different temperatures, pH, and salinities using the following equation (Bower and Bidwell 1978):
% Un-ionized ammonia = 100 [1 + antilog (pKa8(T ) - pH)] , in which, pKa8(T ) = pKa8(T = 298°K) + 0.0324 (298 - T°K)
Total ammonia nitrogen (TAN) was calculated using the tables in Bower and Bidwell (1978). The sum of nitrate, nitrite and TAN was considered as total nitrogen. Phosphate concentration was determined following Parsons et al. (1984). Availability of each nutrient was calculated as the mean of the three samples collected for any particular sample day.
Dried tissues were ground to powder with an MM301 ball mill (Retsch, Newtown, PA, USA), and then analyzed for total tissue N and carbon (C) using a CNS-1000 Carbon, Sulphur and Nitrogen Analyzer (Leco, St. Joseph, MI, USA). Total tissue N and C were determined for each biomass survey. N removal was calculated using the following equation after Kim et al. (2007):
, where Bt and Tissue Nt are biomass and tissue N at day t, while B0 and Tissue N0 are biomass and tissue N at day 0. The same calculation was used for C removal, substituting Tissue C for Tissue N.
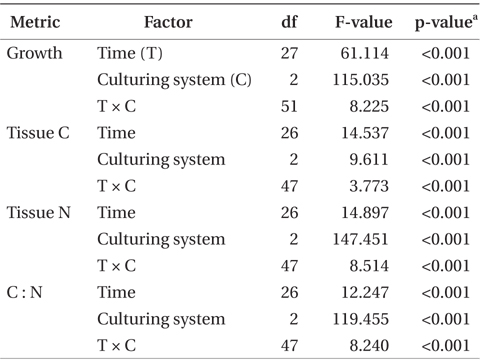
SGR, tissue nitrogen and carbon, and C : N ratio were examined as functions of the fixed factors time and culturing system using two-way ANOVA. Productivity was calculated based on the biomass increase per cage. Therefore, productivity was not statistically compared because the initial stocking density was increased as time progressed, affecting the productivity. C and N removal were not compared statistically since these were calculated values based on productivity and tissue C and N contents. Data were checked for homogeneity of variance prior to analysis. All data sets met this assumption. Post hoc analysis using Tukey’s honest significant difference test was used to make pairwise comparisons of treatment means when ANOVA indicated a significant treatment effect. All analyses were conducted using IBM SPSS Statistics version 20 (IBM Inc., Armonk, NY, USA).
Growth rate of P. palmata varied with season (Fig. 3). The effect of time, system, and the combination of these two factors on growth was highly significant (p < 0.001) (Table 2). Growth rate in Effluent system 1 was highest at the end of April with 1.10% d-1 at 8.1 to 8.5°C. Growth was most vigorous at this point, older tissues were generating new plantlets at all margins, and a single plant had length up to 80 cm on 31 May 2010 (Fig. 2). At this time, the biomass was increased to 8.3 kg FW m-2. During June 2010, the combination of higher stocking density (9.8 kg FW m-2) and high temperature (>14°C) in Effluent 1 was associated with a significant decline in growth rate. A similar pattern was observed in Effluent 2. Highest growth rates of 1.08% d-1 occurred in June, immediately followed by a decrease in growth rate associated with the effluent warming to 14°C.
In the control system, growth rate was highest, 0.81% d-1, at around 10°C in November (Fig. 3). Growth rate was steady at about 0.3% d-1 from mid-December until the end of April, during which time temperature ranged from 0.5 to 9°C. When cage biomass was increased to 8.3 kg FW m-2 in April, growth rate decreased to a minimum of -1.10% d-1 over two weeks. Thereafter, during May-June, seaweed recovered to positive growth until biomass increased again to 9.8 kg FW m-2. Growth rate then declined to 0% d-1 in early July when temperature reached 13.5°C and remained at or below zero growth until the end of the experiment in October. Leading up to biomass increases to 8.3 and 9.8 kg FW m-2, the growth rate in both Effluent systems was 100% higher than that of the control. Moreover, growth in the control system was consistently lower than in either Effluent system from late-April until the end of the study.
Incidence of epiphytes on P. palmata was very low in all systems throughout the study. Seaweed in both Effluent systems maintained a deep red-purple colour and pliable texture throughout the experiment. By comparison, seaweed in the control system became paler in the middle to end of summer and into the fall, and the texture of these plants was similar to that of paper. In addition, plants in the control system developed perforations throughout the entire blade, possibly a result of disease.
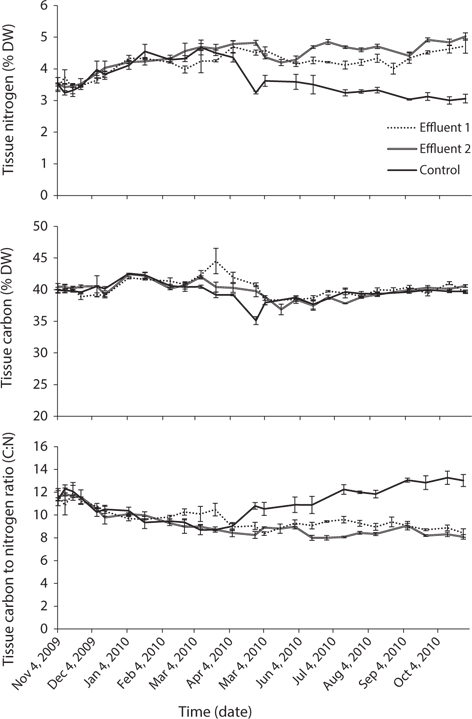
Seawater source (i.e., control or effluent), time, and the interaction of these two factors had an effect on tissue nitrogen content (p < 0.001) (Table 2, Fig. 4). Mean tissue nitrogen of P. palmata cultured in Effluent 1 and 2 were 4.2 and 4.4% DW, respectively, compared to 3.7% DW in the control. Tissue carbon content was also affected by time, system, and the combination of these two factors (p < 0.001) (Table 2). Accordingly, mean tissue carbon of 40.2, 39.9, and 39.6% DW occurred in Effluent 1, Effluent 2, and control, respectively. C : N ratios for Effluent 1 and 2 ranged from 8.4 to 11.9, and from 8.0 to 11.8, respectively, through the growing season. Control C : N ratio tended to be higher than those in Effluent 1 and 2 (8.7-13.2; p < 0.001).
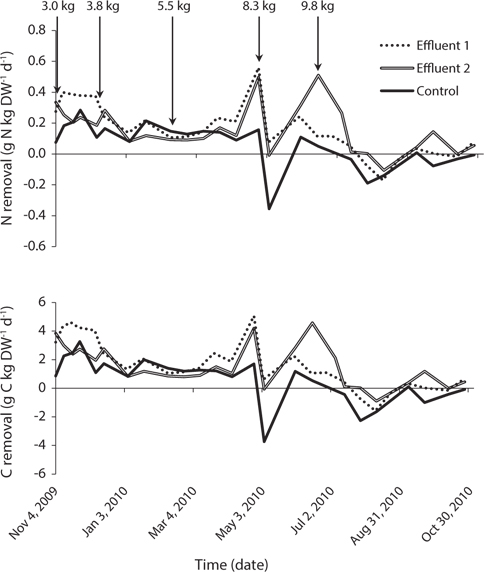
Nitrogen and carbon removal followed the same general pattern as growth rate (Fig. 5). Total nitrogen removal within each system remained stable from the start of the study in November 2009 until late-March 2010, ranging between 0.12-0.40, 0.09-0.34, and 0.08-0.28 g N kg DW-1d-1 in Effluent 1, Effluent 2, and control, respectively. Consistent total carbon removal was observed over the same time period with ranges of 1.05-4.61, 0.81-3.85, and 0.83- 3.27 g C kg DW-1 d-1 for Effluent 1, Effluent 2, and control, respectively.
Both nitrogen and carbon removal increased sharply near the end of April when water temperature was around 8°C in all systems, corresponding to a similar spike in growth rate. Nitrogen and carbon removal decreased following a biomass increase to 8.3 kg FW m-2, but subsequently increased in June as growth rate improved highest nitrogen removal rates of 0.56, 0.51, and 0.28 g N kg DW-1 d-1 for Effluent 1, Effluent 2, and control occurred in April, June, and November, respectively. Corresponding carbon removal during these same months was 5.06, 4.57, and 3.27 g C kg DW-1 d-1 for Effluent 1, Effluent 2, and control, respectively.
Nitrogen removal during winter, at mean seaweed system biomass of 52.5 kg, removed 1.1% of nitrogen released by feeding and fish metabolism in Effluent 1 (Table 3). The same result for Effluent 2 was 0.7%. During the same period, carbon removal was 4.7 and 2.6% of that produced by the fish in Effluent 1 and 2, respectively. Nitrogen and carbon removal efficiencies were lower during summer months for both systems. On average, both nitrogen and carbon removal were six times more efficient from November to April than during summer months (Tables 4 & 5).
Clearly, P. palmata is not suitable for bioremediation during summer in Nova Scotia, but may be useful in nitrogen or, in particular, carbon removal during winter. By estimating mean finfish biomass for two seasonal periods of the experiment, it is possible to predict seaweed biomass required for bioremediation of the effluent from a given biomass of finfish. In experiments of stocking density with P. palmata, Kim et al. (2013) achieved growth rates of 1.0 and 0.5% d-1 at 6 and 16°C, respectively. Similar growth rate occurred in the current study from November to April. For removal of 50% of the nitrogen produced by 100 t of halibut during winter, at stocking densities of the current study and growth rate 0.5 to 1.0% d-1, 29,000 to 38,000 m2 of cultivation area for P. palmata would be required (Table 4). A 100 t land-based halibut farm has a tank surface area of at least 3,000 m2 (Scotian Halibut Ltd., CanAqua Ltd. personal observation). Therefore, seaweed cultivation area would be in the range of ten times larger than halibut cultivation area for just 50% nitrogen mitigation. According to data obtained for Gracilaria + Chondrus in a cascade system with turbot and seabass, 8,200 m2 of seaweed cultivation area were required for 50% removal of 54.0 kg N d-1 at 17 to 21°C (Matos et al. 2006). For removal of nutrients produced by 100 t of sea bass, 15,000 m2 of high rate algal pond using Ulva, Enteromorpha, and Cladophora spp. were required when temperatures were 16 to 26.5°C (Pagand et al. 2000). The biomass of P. palmata required for 50% nitrogen removal approaches a 1.5 : 1 ratio seaweed : finfish. Haglund and Pedersèn (1993), in co-cultivation of Gracilaria tenuistipitata C. F. Chang & B. M. Xia and rainbow trout came to a similar conclusion of 1 : 1 seaweed : finfish biomass for efficient removal of inorganic nitrogen and phosphorus while maintaining high growth rates. Yet another example was reported by Abreu et al. (2011) in which 4,500 m2 of G. vermiculophylla (Ohmi) Papenfuss were required for 50% removal of the nitrogen produced by 100 t of fish.
Seaweed cultivation area required for 50% carbon removal is 24 to 28% of the area required for the same removal of nitrogen (Table 5). The extent of integrated seaweed cultivation, then, may depend on the desired objectives. Carbon occurs in equilibrium as carbon dioxide (CO2), carbonate (CO32-), and bicarbonate (HCO3-) (Lobban and Harrison 1996), with CO2 readily dissociating to HCO3- at pH 7.8-8.2. Algal growth removes CO2 into organic matter by means of photosynthesis (Barsanti and Gualtieri 2006), though P. palmata is able to use carbon as both HCO3- and CO2 (Kübler and Raven 1995). Thus, carbon removal as a function of productivity and tissue carbon is a valid estimate of total carbon dioxide removal.
Few studies have considered the carbon removal potential of seaweed species in seaweed-fish integration. In 2007, seaweed mariculture reached 1.4 million t in China, representing an estimated 0.34 million t of carbon removed from the marine coastal environment by seaweed harvesting (Tang et al. 2011). Investigating carbon dioxide fixation by microalgae in a photobioreactor, Otsuki (2001) found carbon removal rates of 13.75 g C m-2 d-1. Highest carbon removal rates in the current study were 8.00 and 10.94 g C m-2 d-1 for Effluent 1 and 2, respectively, similar to 11 g C removal m-2 d-1 by Gracilaria vermiculophylla in effluent of turbot, sea bass, and Senegalese sole aquaculture (Abreu et al. 2011). Marine algal species in cultivation have tissue carbon contents ranging from 20 to 41% DW (Kim et al. 2008, Tang et al. 2011), lower than that of P. palmata integrated with halibut. In samples of P. palmata from the wild, tissue carbon contents were 40 to 43% DW during summer (13.5-20°C) and 43 to 45% DW during winter (12-16°C) (Martínez and Rico 2002). Tissue carbon of this study was likely higher than in P. palmata cultured in the lab under continuous aeration (Corey et al. 2013).
Growth of P. palmata in the current study was highly dependent on season. From previous work, growth of this species is optimal between 6 and 10°C (Corey et al. 2012) and stocking density up to 6.0 kg m-2 (Kim et al. 2013). In the present study, the growth of Palmaria decreased when the temperature was high, above 14°C. It is also clear that productivity was compromised with biomass increase to 8.3 kg FW m-2 or more. Therefore, during periods when environmental conditions were favourable (e.g., April-May) growth was hindered by a recovery period of as much as one month.
Matos et al. (2006) reported a yield of 40.2 g DW m-2 d-1 at 17-21°C for P. palmata. The highest yield in the current study was 28.4 g DW m-2 d-1 during the first two weeks of June 2010. This level of productivity, however, occurred at a stocking density of 5.5 kg m-2, while that of Matos et al. (2006) was accomplished at 3 kg m-2, although the latter also cultivated at temperatures otherwise believed to be too warm for health of P. palmata (Corey et al. 2012, S. O’Leary, NRC personal communication). Morgan and Simpson (1981b) reported growth rates of 7% d-1 under fluorescent light and 6-14°C water temperature, much greater than the highest growth rate of 1.1% d-1 in the current study. Growth rates in the range of 6% d-1 have been achieved by this research team under highly-controlled conditions in the lab (Corey et al. 2012). Morgan and Simpson (1981b) cultivated 50 g FW of apical segments at a stocking density of 1 kg FW m-2. At these stocking densities, P. palmata has grown at 7% d-1 in halibut effluent and 5°C, declining dramatically to 1% d-1 at 10 kg m-2 (Kim et al. 2013). Further to this, Morgan and Simpson (1981b) utilized apical plant sections, likely contributing to improved nutrient uptake, whereas the current study made use of whole thalli. Younger tissues typically have higher rates of nutrient uptake, due to faster growth and greater proportion of cells in direct contact with the medium than older plant segments (Hafting 1999, Kim et al. 2007). These values for growth rates in experimental conditions compare favourably for those found in nature of 4% d-1 in actual commercial harvests on Digby Neck, Nova Scotia (Lukeman et al. 2012).
Nitrogen removal by P. palmata associated with Atlantic halibut during winter was considerably lower than that of P. palmata and C. crispus in a cascade system (Matos et al. 2006). At 17-21°C, these rhodophytes removed 1.35 g N m-2 d-1 while the highest nitrogen removal in the current study was 0.22 g N m-2 d-1. However, the biomass of C. crispus was more than double that of P. palmata, adding to system productivity at these warmer temperatures. Productivity of P. palmata declines dramatically above 14°C, and ceases at temperatures exceeding 20°C (Matos et al. 2006). Nitrogen removal may have been greater if more nitrogen had been available as ammonium. On average, 80% of the available nitrogen was in the form of nitrate in the recirculating halibut culture systems. Nitrogen uptake can be as much as 50% faster in P. palmata when 80% of nitrogen is present as ammonium instead of nitrate (Corey et al. 2013). Morgan and Simpson (1981a) concluded that ammonium was taken up three times faster than nitrate. The biofiltration equipment of the systems used in this study was originally sized for a maximum of 10 t of finfish biomass per system. Normal biomass is currently around 5 t. This reduction in nutrient load results in greater proportion of the ammonium being oxidized to nitrate with each pass of the water.
Given the 1.5 : 1 seaweed : finfish ratio for 50% nitrogen removal in the current study, the challenge remains to reduce the surface area required for algal cultivation. Kim et al. (2013) determined that nitrogen removal by P. palmata was most efficient when stocked at 2 kg m-2, greatly increasing the massive cultivation area required for effluent bioremediation. As previously discussed, use of younger plant tissues may contribute to greater efficiencies and reduced cultivation area. In order to accomplish this, ready access to seedstock would be required. Location of the seaweed cultivation component prior to ammonia nitrification within the recirculating treatment stream may also improve uptake rates (Corey et al. 2013). Strategic integration of multiple species and cascading tank designs as in Matos et al. (2006) may also be the appropriate application since P. palmata has greater value ($1.00 kg-1 FW) (Wanda van Tassel, Fundy Dulse Ltd. personal communication) and potential versatility as fodder for certain commercially valuable marine heterotrophs such as abalone (Demetropoulos and Langdon 2004) than, for example, C. crispus which has potentially greater bioremediation potential (Kim et al. 2013), but lower value ($0.42 kg-1 FW) (Wayne Nickerson, Irish moss harvester personal communication). Use of multiple species may help offset the poorer bioremediation efficiencies of P. palmata during summer. These strategies in combination would considerably reduce the surface area required for cultivation, and help make seaweed bioremediation more economically feasible.


