The presence of heavy metals in surface waters and in wastewater is becoming a severe environmental problem. Furthermore, because of their non-degradability, they can accumulate in the food chain, thereby presenting a significant danger to human health. Lead poisoning in humans causes severe damage not only to the kidney and liver, but also to the nervous and reproductive systems. Lead is among the common global pollutants arising from increasing industrialization, and is recognized as a longstanding environment contaminant. It is generated in wastewater by various industries such as manufacturing of ceramics, paints, acid batteries, and glass. The problems connected with lead ion pollution can be abated by processes such as ion exchange, electrode deposition, biological process, chemical precipitation, liquid membrane extraction, and activated carbon (AC) adsorption [1].
ACs are unique and versatile adsorbents because of their extended surface area, microporous structure, universal adsorption effect, high adsorption capacity, high degree of surface reactivity, ease of use for the treatment of wastewater, and economical feasibility. ACs consists of carbon (87-97%), but also contains such elements as hydrogen, oxygen, sulfur, and nitrogen as well as various compounds either originating from the raw material or generated during their manufacture. ACs are produced from a solid carbonaceous material that is rich in carbon but low in inorganic content. Rice, which is cultivated in more than 75 countries in the world, is an essential food for over half the world’s population. The worldwide annual rice husk (RH) harvest is about 80 million tones and over 97% of this is generated in developing countries [2]. RH is of little commercial value and because of its high silicon dioxide content it is not useful to feed either humans or animals [3]. The manufacture process of ACs includes physical and chemical methods. AC produced by physical activation is obtained after two steps: the first is carbonization, so-called pyrolysis of a carbonaceous material at high temperature (500-1000℃) in an inert atmosphere to eliminate the maximum amount of oxygen and hydrogen elements. The second is thermal activation at the same temperature in the presence of an oxidizing gas such as water, carbon dioxide or both [4]. Chemical activation involves impregnation of the raw materials with chemicals such as H3PO4, KOH, NaOH, or ZnCl2. These chemicals are dehydrating agents that can influence the pyrolytic decomposition and retard the formation of tars during the carbonization process, thereby increasing the yield of AC [5]. The chemical activation process normally takes place at temperature lower than that used in the physical activation process, possibly reducing energy costs in the production of ACs [6]. Chemical activation with sodium hydroxide or potassium hydroxide gives highly porous ACs with consequently high surface areas. Many researchers [7-11] have recently studied the preparation of ACs with sodium hydroxide and potassium hydroxide starting with different precursors, and produced ACS with surface areas ranging between1475 and 2875 m2/g, total pore volume of about 0.84-2.18 mL/g, and pore radius around 1.382 nm.
The aim of this work is to prepare highly porous ACs using NaOH from hydrofluoric acid leached RH followed by characterization of the prepared ACs using different techniques and modification of the AC surface chemistry using HNO3 and H2O2 as oxidizing agents. The efficiency of adsorbents in the removal of lead ions as contaminants in an aqueous medium was studied. The effects of adsorbent dosage, temperature, pH, initial lead concentration, and time were studied. Kinetic and thermodynamic studies were also carried out.
All the primary chemicals used in this study were of analytical grade. Lead(II) nitrate salt with 99.99% purity was obtained from Sigma-Aldrich Company. Distilled water was utilized throughout the experiments for solution preparation and glassware cleaning.
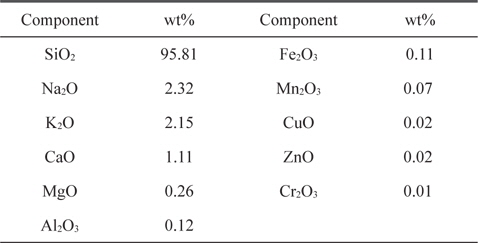
RH from a rice mill at Damanhour City (Egypt) was used as raw material. RH was first washed with distilled water to remove dust and other adhering impurities, and then dried at 110℃ overnight. The dried product was ground and sieved to different sizes, but the present study focused on a size fraction of 0.3-0.5 mm. The RH used contained about 22 wt% lignin, 42 wt% cellulose, and 20 wt% hemicelluloses. The moisture content of the as-received RH was determined to be 5.0%. The ash content was 19.15%, as determined in an open muffle at 600℃. The elemental composition of the ash was previously determined in our laboratory using inductively coupled plasma atomic emission spectroscopy, as presented in Table 1, where it is seen that SiO2 represents the major component of RH ash at 95.81 (wt%). Hydrofluoric acid leached RH was prepared by stirring dried RH with 25% AR hydrofluoric acid with an acid solution volume to RH mass ratio of 3:1 for 40 min at room temperature. The solid was filtered and washed with distilled water until obtaining a neutral filtrate, and then dried for 24 h at 110℃. The dried hydrofluoric acid leached RH was carbonized in the absence of air using a stainless steel reactor tube (600 × 40 mm) at a rate of 10℃/min from room temperature up to 600℃ for 3 h at this temperature. The carbonized sample was cooled to room temperature, and designated as LC sample.
[Table 1.] Elemental composition of ash component of rice husk

Elemental composition of ash component of rice husk
Sodium hydroxide ACs were prepared by soaking the carbonized sample (LC) in the desired weight of analytical grade sodium hydroxide, and then dissolving in a minimal amount of water for 48 h (sodium hydroxide: carbonized samples were prepared in ratios of 2:1, 3:1, and 4:1, giving three activated samples designated by NLC21, NLC31, and NLC41, respectively). The produced paste was then dried at 110℃ and calcined at 800℃ with a rate of 10℃/min, and maintaining the maximum temperature for 3 h in a stainless steel tube. After cooling to room temperature, the produced activated samples were ground, sieved, and washed with distilled water several times until a neutral filtrate of the washing solution was obtained. The washed samples were dried at 110℃ and stored for characterization and adsorption studies.
NLC41 was selected for modification with nitric acid and hydrogen peroxide (NNLC41 and HNLC41, respectively). The carbon sample was heated with concentrated nitric acid (10 mL/g carbon) to almost dryness at 100℃, cooled in a desiccator and subjected to strong evacuation, and washed several times with distilled water until a filtrate of pH = 7 was obtained. For treatment with hydrogen peroxide, 1 g of carbon sample (NLC41) was mixed with 50 mL of H2O2 and shaken mechanically for 48 h at room temperature. It was then dried in an air oven at 110℃ for 24 h, cooled in a desiccator and subjected to strong evacuation, and washed with distilled water several times.
2.4.1. Theromgravimetric analysis
A thermogravimetric analysis (TGA) of RH and NLC31 as selected activated samples was performed in a thermo-analyzer ([D-50] Shimadzu, Japan) apparatus at a nitrogen flow rate of 50 mL/min and a heating rate 15℃/min up to 800℃.
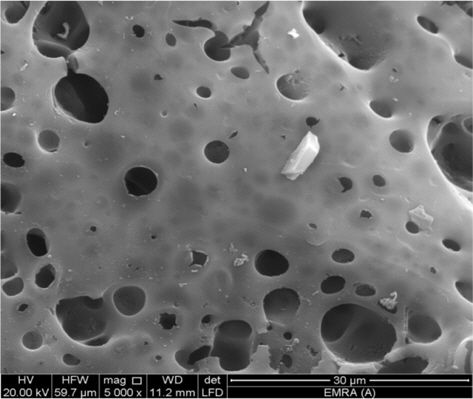
Scanning electron microscopy (SEM) was performed to study the surface morphology of NLC31 as a selected AC using a SEM model Quanta 250 FEG (field emission gun) with an attached energy dispersive X-ray analyses unit, with accelerating voltage of 30 KV, magnification of 14× up to 1 000 000, and resolution.
2.4.3. Textural characterization
Specific surface area (SBET, m2/g, BET: Brunauer-Emmett- Teller), total pore volume (VT, mL/g), and pore radius (rˉ, nm) for the investigated ACs were determined through nitrogen adsorption at -196℃ using a NOVA2000 gas sorption analyzer (Quantachrome Corporation) system.
2.4.4. Surface function groups of adsorbent
The presence of both acidic and basic function groups was determined using various methods: Fourier transform infrared spectra (FTIR) were recorded on a Mattson 5000 FTIR spectrometer in the range between 4000 and 400 cm˗1, where KBr discs were prepared in the usual manner. pH of the supernatant was determined by mixing 0.2 gm of adsorbent with 25 mL of pre-boiled distilled water in a 50 mL Erlenmeyer flask and shaking for 48 h; the supernatant was then filtered to remove solid adsorbent and the pH of the supernatant was measured using an Orion pH-meter. pHpzc of ACs was also measured. First, 50 mL of 0.01 M NaCl solutions was put into several closed Erlenmeyer flasks. The pH within each flask was adjusted to a value between 2 and 12 by adding HCl (0.1 M) or NaOH (0.1 M) solutions. A portion of the sample (0.15 gm) was then added to each flask, the flasks were agitated for 48 h, and the final pH was then measured. The pHpzc is the point where pHfinal ˗ pH initial = zero [7].
2.4.5. Adsorption equilibrium studies
Batch adsorption experiments were undertaken in a series of Erlenmeyer flasks containing a constant weight of ACs and equal volumes of lead(II) solutions at varying concentrations. The flasks were shaken in a thermostatic shaker at the desired temperature with shaking speed of 100 rpm for 10 h. The concentration of lead(II) in the supernatant was analyzed using a Perkin-Elmer model 2380 atomic spectrometer.
The effects of pH and contact time were studied with respect to the adsorption of lead(II) ions by HNLC41 and NLC41 at different pH values and time points using 50 mL of 50 mg/L lead(II) ions at room temperature. The optimum pH and time for the adsorption process were confirmed from the above experiments. The effect of adsorbent dosage on adsorption was investigated by shaking 50 mL of 75 mg/L lead(II) solutions with different weights from NNLC41. The effect of temperature was studied by conducting a batch adsorption experiment at 20, 30, and 45℃ for NNLC41 as a selected sample.
3.1. Textural characterization of ACs
The SEM technique was used to study the surface morphology of AC. A SEM micrograph of NLC31 sample is presented in Fig. 1. It shows irregular size cavities, indicating a wide pore size distribution due to the aggressive effect of NaOH (activating agent) at 800℃ on the solid surface of hydrofluoric acid leached RH, in addition to the effect of HF as a corrosive agent in removal of silicon atoms as volatile silicon tetra fluoride. Activation with NaOH is attributed to the formation of a gas released in the activation reaction, which could burst the precursor and results in wider holes [9].
3.1.2. Surface area and pore structure
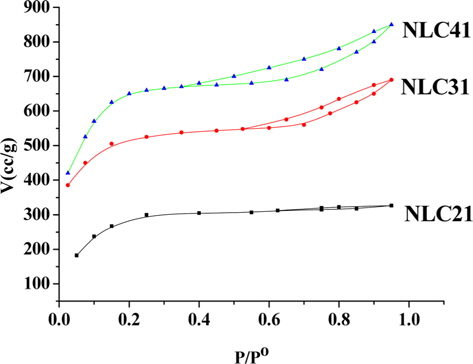
Specific surface area, total pore volume, and pore radius are significant indicators for any solid adsorbent. Fig. 2 presents the nitrogen adsorption/desorption isotherms at-196°C for the investigated ACs. The adsorption isotherms are either type I (NLC21) of Langmuiran type [12] or a mixture of type I and type II (NLC31 and NLC41). The initial part of the isotherm indicates micropore filling, while the slight curvature of the plateau denotes the multilayer adsorption on the external surface. The NLC21 sample shows a negligible hysteresis loop; i.e., the adsorption/desorption isotherms approximately overlapped, which is characteristic of slight shaped and/or inkbottle type pores [13]. The isotherms of NLC31 and NLC41 show hysteresis loops overlapped with the adsorption branch at relative pressure p/po of 0.54 and 0.37, respectively. The area of the hysteresis loop increased with an increase in % of the NaOH activating agent, which may be attributed to the creation of larger pores upon activation with NaOH [14].
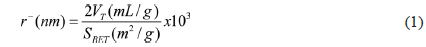
The specific surface area of the ACs (SBET, m2/g) was determined by applying a linear plot of the BET equation, and the mean pore radius (rˉ, nm) could then be calculated according to the following equation:

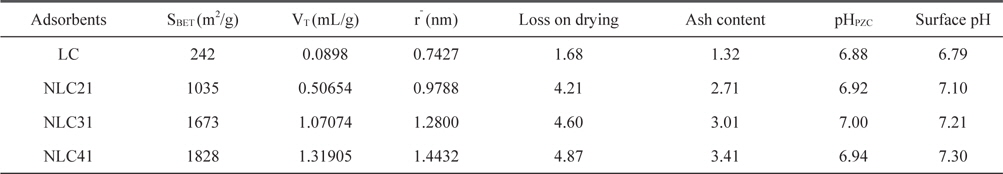
where VT (mL/g) is the total pore volume near saturation, i.e.at p/po ≈ 0.95 multiplied by the factor 15.47 × 10˗5. Table 2 lists the values of SBET (m2/g), VT (mL/g), and rˉ (nm). From Table 2 we can concluded the following: 1) the surface area for the carbonized sample is low due to the absence of the activating agent and the blocking of pores (created by the effect of hydrofluoric acid) during carbonization. 2) Activation with NaOH raises the surface area and as the % of activating agent increases, the surface area also increases, reaching about 7.6 times that of the LC sample in the case of NLC41. This may be related to the mechanism of activation with NaOH:


Textural properties of the investigated carbons as determined from nitrogen adsorption at -196°C
Reaction between NaOH and carbon at elevated temperature requires a large quantity of NaOH, where the stoichiometric ratio LC: NaOH is 1:3 (Eq. (2)) and the Na2CO3 produced under thermal decomposition give gases (CO2 and H2O) responsible for burst precursor and results in wider holes. The metallic sodium produced can insert itself into the produced carbon structure and aid in the development of porosity [15]. In this way, large surface area can be obtained when high impregnation ratios are used. 3) Total pore volume increases with an increase in the % of NaOH from 0.08980 for the non-activated sample to 1.31905mL/g for the NLC41 sample, which indicates the creation of new pores with an increase of the NaOH: carbon ratio. The average pore radius ranged from 0.7427 to 1.4432 nm, indicating microporosity of the surface.
3.2. Pyrolysis characterization of RH and ACs
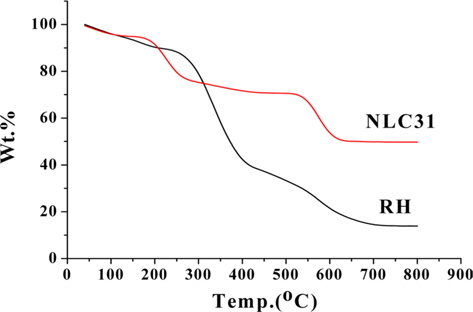
The results of the TGA for RH and NLC31 activated samples are shown in Fig. 3. They show the following: 1) for raw material at lower temperature up to 110℃, mass loss (about 4.8%) occurs due to moisture elimination. The weight loss between 250 and 400℃ may be related to the release of volatile materials. The reason is that cellulose and hemi-cellulose of the sample decomposed to condensable gases (acetic acid, methanol, and wood tar) and incondensable gases (CO, CO2, CH4, H2, H2O) [16]. For the weight loss between 420-700℃, lignins begin to decompose and residual volatiles from the first stages (below 400℃) are further released. A plateau curve at temperature over 700℃ showed that the weight was unchanged at this stage. 2) The TGA curve for NLC31 as a selected activated sample shows more thermal stability compared with RH due to preactivation at higher temperature, and the loss of weight below 220℃ may be related to moisture and other gases adsorbed on its more porous surface.
Loss upon drying and ash content for RH and other investigated samples are reported in Table 2, which shows the following: 1) the ash content for RH is about 19.15%, and with activation the % ash content sharply decreases to less than 3.41%. This is related to the effect of hydrofluoric acid on the removal of silica, which represents 95.81% from ash content in RH. The ash content increases with an increase in the amount of NaOH used in activation due to its corrosive effect on carbon atoms. 2) Loss upon drying for RH was found to be approximately 4.80%, as recorded with the TGA technique. Loss upon drying for the activated sample ranged from 4.21 to 4.87% and increased with an increase in the surface area, which is responsible for moisture sorption. Furthermore, as the inorganic content (ash content) of the carbon increases, water adsorption also increases. 3) Loss upon drying for the LC sample is lower (1.68%), which may be related to its lower surface area and lower inorganic content.
It has already been pointed out that high surface area and an adequate pore size distribution are necessary conditions for a carbon adsorbent to perform well in a given application. However, there are many examples of carbons with similar textural characteristics that show very different adsorption capacity with the same adsorbate. The reason for these different behaviors is that an adequate porous structure is a necessary but not a sufficient condition for optimization of the adsorption capacity of ACs [17]. There are many methods to evaluate the surface chemistry of ACs, such as Boehm's titration method, pHpzc, surface pH, and FTIR. pHpzc is the pH at which the net surface charge on carbon is zero. At pH < pHpzc , the carbon surface has a net positive charge, while at pH > pHpzc , the surface has a net negative charge [18]. pHpzc was 6.92, 7.00, and 6.94 for NLC21, NLC31, and NLC41, respectively (Table 2). Oxidation of NLC41 with hydrogen peroxide and nitric acid (HNLC41 and NNLC41) was associated with a decrease in pHpzc to 4.50 and 3.56, respectively, indicating the creation of new acidic function groups. The pH values of the AC supernatant (7.10, 7.21, and7.30, respectively) are slightly higher than their pHpzc. In addition, the slurries of the oxidized NLC41 sample showed a sharp decrease in pH, as reported by pHpzc.
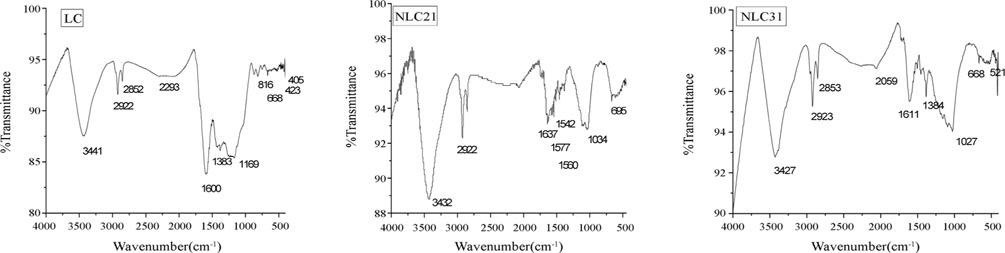
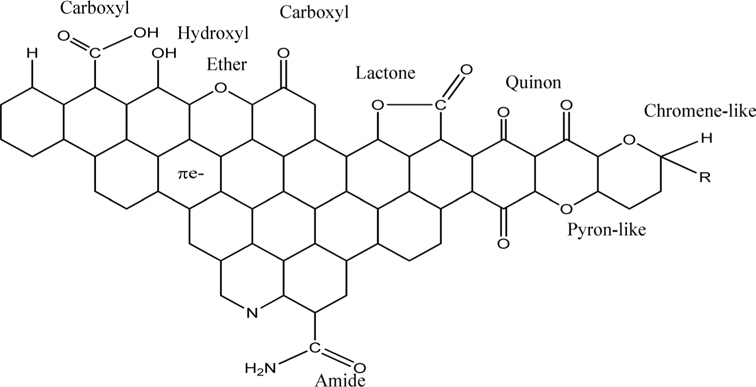
FTIR has been one of the most frequently used instrumental analysis methods to characterize the surface functionalities in ACs, as meaningful information is often difficult to obtain by conventional transmission/absorption. Oxygen-containing surface groups are by far the most common in carbons. In particular, ACs have a relatively large edge area, which results in a strong propensity for oxygen chemisorption. Molecular oxygen can thus dissociate into atoms that react chemically with atoms of carbon to form oxygen surface compounds. This oxidation process is particularly significant as the temperature of the reaction increases, but also is at room temperature for carbons previously treated at high temperature, which have a highly reactive surface. Oxygen-containing surface groups are not only formed by reaction with oxygen but can also result from reaction with many other oxidizing gases and with oxidizing solutions such as nitric acid, hydrogen peroxide, etc. Fig. 4 summarizes the most important types of surface groups that may be present on the carbon surfaces. The surface sites associated with functional groups represent a small proportion of the total surface area. However, small variations in the chemical nature of an AC may produce important changes in its adsorption capacity [17].
FTIR was used to obtain information about the chemical nature and functional groups of NaOH-ACs (Fig. 5). The bands located at 3422-3441 cm˗1 correspond to the intra-molecular Hbonded (-OH) [19]. The band located at 2922 cm˗1 is attributed to a C-H stretching vibration of –CH2. The bands observed at 1637-1542 cm˗1 are associated with C=O (ketones, aldhyde, lactone, and carboxyl) [7]. The band at 1384 cm˗1 is related to –CH3 deformation [20]. The band around 1034 cm˗1 could be assigned to alcohol (R-OH) groups [6]. Some weak bands also appeared in the range of 600-900 cm˗1, and are associated with the out-ofplane bending mode of the C-H or O-H group [21].
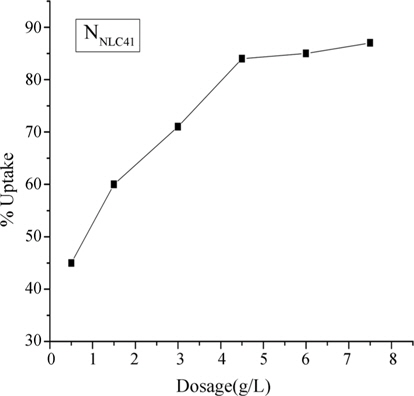
3.4.1. Effect of adsorbent dosage
Fig. 6 indicates the relation between adsorbent dosage (g/L) and % uptake for removal of lead(II) ions onto NNLC41 as a selected AC sample. It was found that increasing the adsorbent dosage of ACs from 1 to about 7.5 g/L accompanied an increase in %uptake of lead(II) ions from 45 to about 85%; this could be related to the fact that as the adsorbent dosage is increased, more adsorption sites are available for lead(II) ions, thus enhancing the % uptake [22]. But with increasing adsorbent load, the quantity of lead(II) ions adsorbed on the unit weight of the adsorbent is reduced, thus causing a decrease in qe (mg/g) values with increasing AC loading.
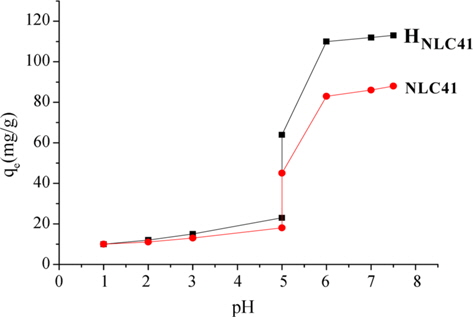
Generally, the pH of the adsorbate solution is one of the most important factors to determine the adsorption capacity of ACs due to its effect not only on the surface charge of the adsorbent, but also on the degree of ionization and speciation of the adsorbate [23]. Fig. 7 shows the effect of pH change from 1 to about 8 for adsorption of lead(II) ions onto NLC41and HNLC41 as selected adsorbent samples. An increase in the solution pH showed an increase in qe(mg/g), especially at pH values greater than 5. It is known from the Pourbaix diagram of lead that lead(II) ion precipitates as lead(OH)2 at pH values greater than 6.7. Although this range (pH > 6.7) was investigated for removal of lead(II) ions, no uptake could be ascribed to the adsorption onto ACs within this range. At pH < 6.7, removal of lead(II) ions by adsorption is probable. The difference in the adsorption capacities between pH 5 and 6.2 could be related to the competitive nature between H+ and Pb+2 for the negative adsorption sites on the surface of ACs. Raising the pH of the solution decreases the positive charge of the adsorbent and enhances the adsorption of lead(II) ions [24].
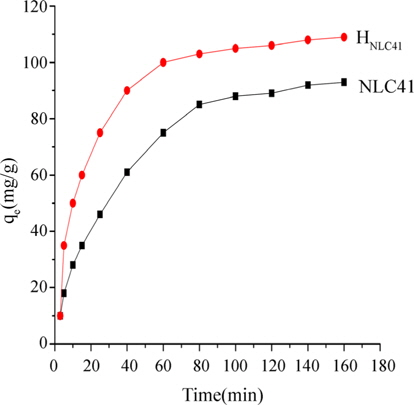
3.4.3. Effect of shaking time and adsorption kinetics
Fig. 8 shows the variation in the adsorption capacities of lead(II) onto NLC41 and HNLC41 as selected adsorbents. This figure indicates that the adsorption of lead(II) ions is rapid in the initial stage, and the rate of adsorption becomes slower with the passage of time and reaches a constant value at about 140 min (equilibrium time). The fast adsorption at the initial stage could be related to higher driving force for fast transfer of Pb+2 ions to the surfaces of ACs particles and the presence of higher uncovered surface area and the availability of active sites on the adsorbent [25,26]. The slow adsorption with further time could be related to the diffusion of lead(II) ions into pores of the AC as well as to the availability of uncovered surface area and fewer remaining active sites, resulting in lengthy time for adsorption to reach equilibrium for lead(II) ions [27].
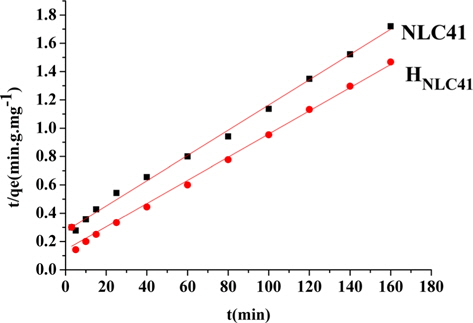
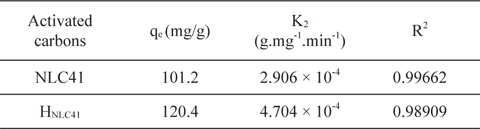
A kinetic study provides information about the adsorption mechanism, which is important for practical application of the process. In our studies pseudo-first and pseudo-second order models were applied for NLC41 and HNLC41. However, the adsorption of lead(II) ions fits a linear model of pseudo-second order with a higher correlation coefficient (R2 = 0.99662, Fig. 9), and a pseudo-first order model with R2 = 0.87645, as shown in Table 3. The pseudo-second order rate constants (K2) are 2.906 × 10˗4 and 4.704 ×10˗4 g.mg˗1.min˗1 for NLC41 and HNLC41, respectively. The equilibrium adsorption capacities (qe, mg/g) calculated from the particle swarm optimization (PSO) model are in agreement with the experimental values calculated from Langmuir’s model, indicating that the adsorption of Pb+2 follows pseudo-second order kinetics.

Parameters of pseudo second-order kinetic model for adsorption of Pb+2 onto NLC41 and HNLC41
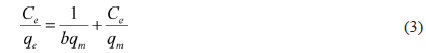
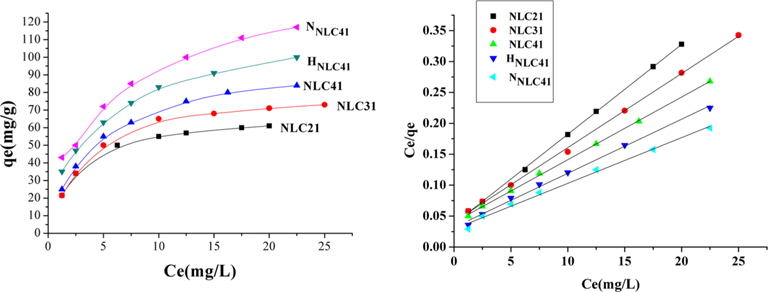
Adsorption isotherms indicate the amount of ions of lead(II) as the adsorbate is partitioned between the solid adsorbent and liquid phase at equilibrium as a function of lead(II) ion concentration. In this study, the equilibrium data obtained for the adsorption of lead(II) onto the investigated ACs were analyzed using the Langmuir model (Fig. 10). The linear form of the Langmuir equation is given as:

where b (L/mg) is the Langmuir constant, Ce (mg/L) is the equilibrium concentration, qe (mg/g) is the amount adsorbed at equilibrium, and qm (mg/g) represents the monolayer capacity. A plot of versus Ce gives a straight line of slope and intercept . The constants calculated from the linear form of the Langmuir equation are given in Table 4. Upon inspection of Table 4, the following observations are made: 1) Langmuir’s constant ranged between 0.208 and 0.384 L/mg. 2) The correlation coefficient, R2, ranged between 0.999871 and 0.990510, which indicates the applicability of the Langmuir equation for lead(II) ion adsorption. 3) The monolayer capacity increases with an increase in the surface area, total pore volume, and average pore radius. 4) Oxidation of ACs using hydrogen peroxide or nitric acid is accompanied by an increase of C-O function groups, which enhances the adsorption of lead ions. HNLC41 and NNLC41 exhibit increases in Pb+2 uptakes of about 18% and 29%, respectively, surpassing that of NLC41. The higher Pb+2 uptakes for NNLC41 compared with HNLC41 may be related to the higher oxidation potential of nitric acid in relation to hydrogen peroxide and the unstable nature of hydrogen peroxide, which decomposes easily on the surface of the ACs.
[Table 4.] Langmuir parameters for adsorption of Pb+2 at 20℃ by the investigated activated carbons
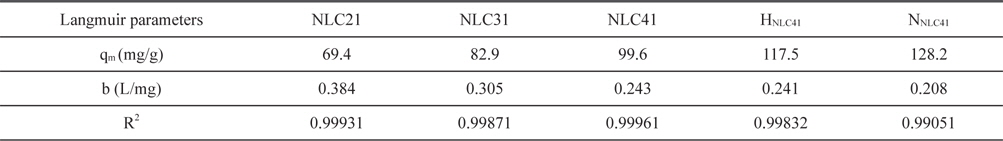
Langmuir parameters for adsorption of Pb+2 at 20℃ by the investigated activated carbons
3.4.5. Effect of temperature and thermodynamic study
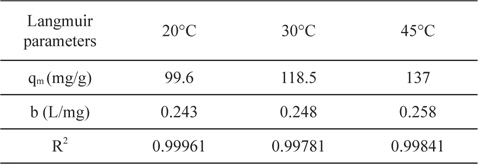
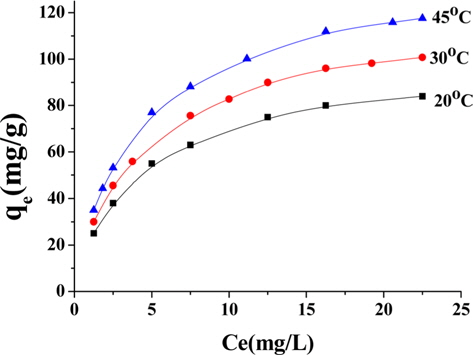
Temperature has two main effects on the adsorption process onto porous adsorbents. First, it can affect the diffusion rate of the sorbent within the pores as a result of decreasing solution viscosity [28]. Second, it affects the number of the sorption sites generated because of the breaking of some internal bonds near the edges of active surface sites of the sorbent [27,29], which improves the adsorption capacity of the adsorbents. Fig. 11 shows the adsorption of lead ions at 20, 30, and 45℃ by NNLC41, revealing an increase in the adsorption capacity with an increase of temperature, as presented in Table 5. Increasing temperature from 20 to 30 to 45℃ accompanied increased adsorption capacities from 99.6 to 118.5 to 137 mg/g, as calculated by the Langmuir equation, with a correlation coefficient of around 0.99961 and a Langmuir’s constant of (b) around 0.248 L/mg. The results indicate that the adsorption of lead(II) ions from the aqueous solution on ACs is an endothermic process; i.e. increasing temperature can increase the diffusion rate of lead(II) ions and increases the number of active sites and thus enhances the adsorption ability of ACs.
[Table 5.] Langmuir parameters for adsorption of Pb+2 onto NLC41 at 20, 30 and 45℃

Langmuir parameters for adsorption of Pb+2 onto NLC41 at 20, 30 and 45℃
Thermodynamic parameters are essential to determine the spontaneity of the adsorption process. The Gibbs free energy change ΔGo is a fundamental criterion of spontaneity, where it indicates a spontaneous process at a given temperature if it has a negative value. Thermodynamic parameters such as changes in standard free energy ΔGo), enthalpy (ΔHo), and entropy (ΔSo) were determined by using the following equations:


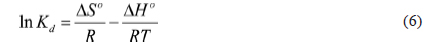
where Kd is the distribution coefficient for the adsorption, Cs the amount of Pb+2 adsorbed on the investigated ACs per liter of the solution at equilibrium, and Ce is the equilibrium concentration (mg/L) of Pb+2 in the solution. T is the absolute temperature of the solution and R is the gas constant. ΔHo and ΔSo were calculated from the slope and intercept of Van،t Hoff plots of ln Kd versus . The results were calculated from the adsorption of Pb+2 on NNLC41 at three different temperatures (20, 30, and 45℃). The calculated distribution coefficient values are 2.70, 3.21, and 3.75, indicating that as the temperature increases, the adsorbed amounts of lead(II) ions also increase. ΔHo recorded a value of 11.819 kJ/mol, and the positive standard enthalpy change suggests that the interaction of lead(II) ions adsorbed by NNLC41 is endothermic. This is consistent with the results of an increase in adsorption capacity with an increase in temperature. ΔGo and ΔSo values are -2.560 kJ/mol and 0.0482 kJ mol˗1.K˗1, respectively. The negative value of the standard free energy change of adsorption and the positive standard entropy change indicate that the adsorption process is a spontaneous process [30]. The absolute magnitude of the change in free energy for physisorption is between -20 and 0 kJ mol˗1 and chemisorption has a range of -80 to -400 kJ.mol˗1 [31]. The change in free energy for adsorption of Pb+2 onto NNLC41 is -2.5620 kJ.mol˗1, indicating a physisorption process.
Sodium hydroxide ACs were prepared from hydrofluoric acid leached HR with higher adsorption capacity for lead ions. SEM and nitrogen adsorption at -196℃ showed microporosity of ACs and the rupture effect of gases evolved during activation. FTIR and pHpzc indicated the presence of acidic and basic function groups on the AC surfaces. The kinetic studies showed that adsorption of lead ions on ACs is a PSO process. Oxidation of the AC surface (with H2O2 or HNO3) raises its surface acidity and the adsorption capacity of lead ions is also increased. Thermodynamic studies indicate an endothermic and spontaneous nature for adsorption of lead ions on ACs.