Water recovery research has attracted great attention due to the existing global water crises. One of the key tools to resolve a future global water crises is continued research into methods that will provide low-cost and high efficiency desalination. Most existing desalination technologies such as reverse osmosis and distillation require a great deal of energy, so it is imperative to find more energy efficient methods to desalinate water [1].
Electrosorption has been shown to be the most promising method for potential future application, for desalinating solutions of low-to-moderate ionic strength [2]. The basic concept of electrosorption is to use an external applied potential to force charged ions in an electrolyte solution toward oppositely charged electrodes, making an electrical double layer (EDL) region. This salt removal technology has been known as capacitive deionization (CDI). The ability of the CDI process to operate at low voltage and without chemical waste has made it a promising technology for overcoming the drawbacks of other desalination technologies.
The CDI unit cell mainly consists of electrodes, current collectors, and a spacer. The correct choice of electrode material is important because its ability to adsorb ions affects the performance of the salt removal process. Carbon, with its wide variety of available forms and porosity, has been found to be the electrode material of choice for CDI and other electrosorption processes [3]. Many studies have been carried to investigate the electrochemical behavior of many kinds of carbons for application as electrosorption electrodes [4-8].
Among the various forms of carbon materials, activated carbon (AC) has been widely used as the main electrode material for CDI, due to its high surface area (>1000 m2g-1) and extensive micropores (pore size <2 nm) [9,10]. The main problems of AC electrodes have been their the low electrode conductivity due to the low accessibility of micropores to the aqueous solution [11] and the weak physical bonding of AC [12].
To manufacture CDI electrodes with good particle-to-particle contact between the small carbon grains, AC powder is combined with a polymeric binder, such as polytetrafluoroethylene or polyvinylidene fluoride (PVdF). However, the amount of polymeric binder used must be limited (5-10%) because the use of polymeric binder increases internal resistance and may block some of the carbon pores, resulting in diminished capacitance [9,11]. For this reason, some CDI unit cells add a conductive material to the composition of the CDI electrode, such as carbon black or graphite [12-14].
In this present study we prepared a reduced graphene oxide (RGO) and used it as a conductive material to improve the performance of electrodes made from AC powder and polymer binder for CDI application. The salt removal performance of RGO was compared with graphite, which is a common conductive material for CDI.
GO was prepared using a modification of Hummers method [15]. Graphite flakes (Timrex, Timcal Ltd.) were added and stirred in a mixture of 2:1 HNO3 (Junsei Chemical Ltd.) and H2SO4 (Junsei Chemical Ltd.). After that, the mixture was diluted with water at room temperature and left overnight. The mixture was filtered and dried in ambient conditions for 24 h. Later, KMnO4 (Junsei Chemical Ltd.) was added slowly to a reaction vessel with concentrated H2SO4 in an ice bath and the mixture was stirred for 2 h. After dilution with water, H2O2 (Dongwoo Fine-Chem) was added to the mixture in an ice bath. Finally the mixture was centrifuged and washed with HCl aqueous solution (Junsei Chemical Ltd.) to remove residual ions and then washed with water until its pH reached 7. GO was reduced by heat treatment to 400℃, followed by a rapid heating process for graphene exfoliation to 900℃. Constant heating at 900℃ was maintained for 2 h and the RGO sample was obtained.
The morphology of samples was characterized by using scanning electron microscope (SEM, S-4700, Hitachi). The specific surface areas and pore parameters were obtained by analyzing nitrogen adsorption-desorption isotherms, recorded at 77 K using a surface area analyzer (BELSORP-mini, BEL Japan Inc.). Prior to this measurement, the samples were degassed at 250℃ for 2 h. The specific surface area and the pore size were analyzed using the Brunauer-Emmett- Teller (BET) method and the Barrett-Joyner-Halenda (BJH) method, respectively. X-ray diffraction (XRD, RINT2000, Rigaku) was carried out to investigate the graphitic structure of graphite, GO, and RGO. Scans were done for 2θ values between 5 and 80° at 0.02°/min.
2.3. Fabrication of CDI electrodes
The carbon slurry for the electrodes was prepared by mixing AC (P-60 Kuraray Co., Ltd.) with PVdF (Sigma-Aldrich Co., Ltd.) which was dissolved in dimethylacetamide (DMAc, Sigma-Aldrich Co., Ltd.), and RGO as the conductive material, with the composition of 85%:10%:5%, respectively. The mixture was stirred for 12 h. The obtained carbon slurry was cast into a graphite sheet using a doctor blade, for use as a current collector. The total thickness of the electrode was 400 μm. The cast electrode was dried in a vacuum oven at 70℃ for two hours. The AC-RGO electrode was obtained by cutting the cast electrode into a piece 10 × 10 cm2 with an additional area (3 × 5 cm2) left for a connectivity space. A hole with a diameter of 8 mm was made for electrolyte flow in the middle of the electrode. For comparison, we also made an electrode with graphite as the conductive material (AC-Gr) with the same composition as ACRGO. An electrode with no added conductive material (AC) was also made, with the composition of AC and PVdF of 85% and 15 % respectively. The morphologies of the fabricated electrodes were observed with a SEM (S-4700, Hitachi).
2.4. Electrochemical characterization
Cyclic voltammetry (CV) using a three electrode system was conducted to measure the capacitance behavior of the carbon electrodes. CV was performed with an AutoLab PGST30 potentiostat. A polarized electrode with the same composition as the CDI electrode was used as a working electrode. A platinum electrode and Ag/AgCl electrode were used as the counter and reference electrode, respectively. The electrolyte solution was 0.5 M NaCl, and all tests were performed at 35℃ in a water bath. The measurements were performed in the potential range of -0.2 to 0.8 V and measured at the sweep rate of 5, 10, 20, 50, and 100 mV/s.
Electric impedance spectroscopy (EIS) using a two electrode system was conducted to determine the internal resistance of the electrodes. The impedance measurement was conducted using the IM6ex spectroscope (Zahner Messtechnnik). A given potential of 0.0 V was applied to the electrode with AC potential amplitude of 10 mV for a short time until the system stabilized. After giving 10 mA applied current to the electrodes with 10 mV potential amplitude, the changes in resistance of the electrodes were measured in the frequency range of 0.1 Hz-100 kHz.
2.5. Desalination performance test
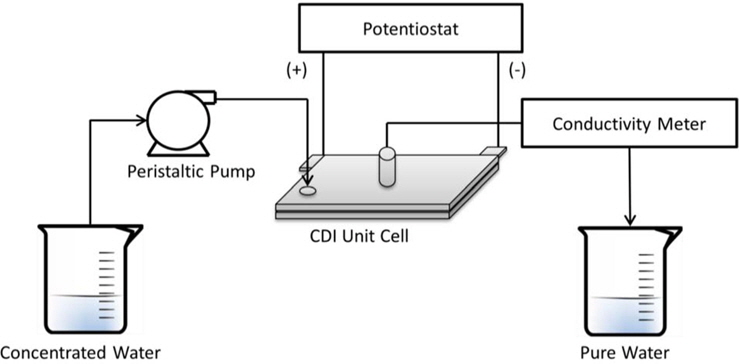
The desalination test of the CDI unit cell was performed in a continuous flow-through system as shown in Fig. 1. NaCl solution was pumped by a peristaltic pump and passed through the unit cell. A given potential was applied to the cell using a potentiostat (WPG100, WonATech Co., Ltd.). The conductivity of the effluent was measured using a pH-conductivity meter (Sevenmulti, Mettler Toledo) and was converted to the concentration (mg/L).
The desalination comparison tests between AC-RGO, AC-Gr, and AC electrodes were conducted with the following conditions. The applied voltage was 1.0 and 1.5 V for adsorption and 0.0 V for desorption, where both were performed for 3 min and repeated for 5 cycles. NaCl 250 mg/L was used as the feed solution with a feed rate of 20 and 30 mL/min.
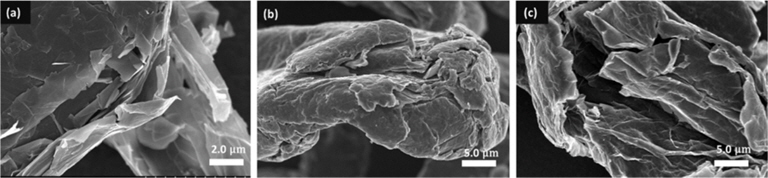
The morphologies of the obtained RGO were observed and compared with the graphite and GO by SEM, and these SEM images of graphite, GO, and RGO material are shown in Figs. 2a-c respectively. GO can be obtained by modification of Hummers method [15] which changes the highly crystalline layered graphite structure shown in Fig. 2a into an exfoliated structure (Fig. 2b). The surfaces of GO sheets have a soft morphology which may be due to the hydroxyl and carboxyl functional group that are attached to GO. The reduction of GO that was performed to 400℃ removes these functional groups from the GO structure and the following rapid heating process up to 900℃ exfoliated the GO into single layers of graphite. As shown in Fig. 2c, wrinkle morphology is observed in the RGO structure which is probably due to the removal of carbon atoms in the form of carbon dioxide, which leads to lattice defects throughout the sheets [16]. The single layer of graphite has been known to have high electric conductivity [16,17], thus its addition to the carbon electrode compositions will improve the electrode’s conductivity and ability to adsorb the charged ions for CDI.
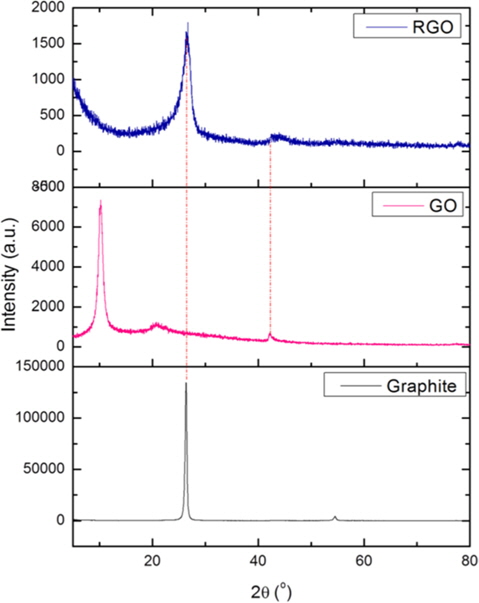
The structural changes of graphite, GO, and RGO were investigated by XRD measurement, and the patterns are shown in Fig. 3. The XRD pattern of graphite shows one strong and sharp peak at 2θ = 26.4° which corresponds to an interlayer distance (d002) of 3.38 Å. After thermal treatment, this peak was markedly shifted to a point of 2θ = 10.24° and the interlayer distance expanded to 8.64 Å. The larger interlayer distance is due to the oxidation of graphite into GO with the formation of hydroxyl and carboxyl groups. The reduction process was expected to contract the interlayer of the GO and remove the functional groups, leading to the exfoliation of the GO layer to produce a single layer of graphite. After the thermal treatment of GO, the peak was similar to that of graphite, which is at the point of 2θ = 26.76° and the interlayer distance was reduced to 3.33 Å. This re-shifted peak shows that the functional groups in the GO interlayer were removed and the layers were exfoliated. The calculation of the RGO peak using the Debye-Scherrer equation gives about 12-13 layers in a single sheet.
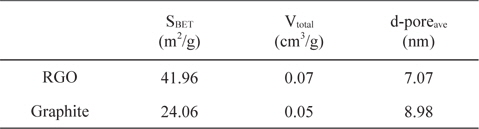
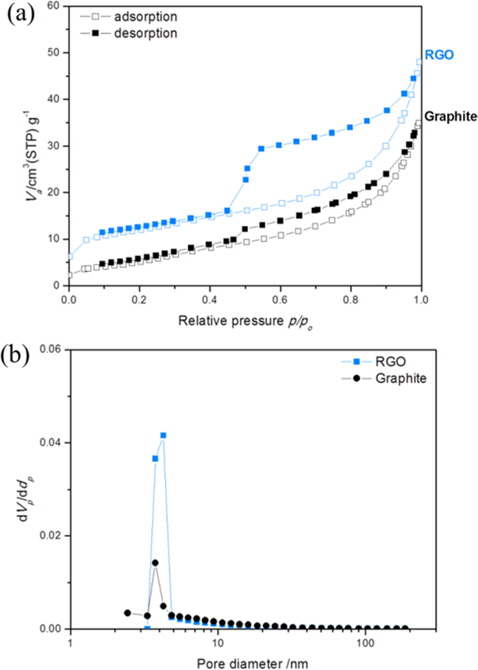
Table 1 summarizes the BET surface areas, total pore volumes, and average pore sizes of synthesized RGO and graphite for comparison. The N2 adsorption-desorption isotherm as well as pore size distribution is shown in Fig. 4. The BET surface area and total pore volume of RGO are slightly larger than graphite due to the thermal exfoliation. However, the surface area of the synthesized RGO in this experiment is still below the theoretical value of the fully exfoliated pristine graphene, which might be due to the incomplete exfoliation of GO. Based on pore width, the RGO and graphite consist of mesopores with pore diameters of 3-4 nm, which was suitable for access by ions.
[Table 1.] BET properties of RGO and graphite

BET properties of RGO and graphite
3.2. Characterization of AC-RGO electrode
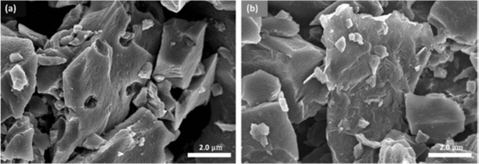
Fig. 5 shows SEM images of the AC and AC-RGO electrodes. The AC electrodes provide a large number of micropores (Fig. 5a) to accommodate the charged ions to be adsorbed, yet strong aggregation between AC particles resulted in poor conductivity. For the AC-RGO electrode (Fig. 5b), RGO can act as a flexible bridge to form a “plane-to-point” (RGO to AC) conducting network, which is beneficial for decreasing the aggregation of AC particles and therefore enhances the pore availability [18].
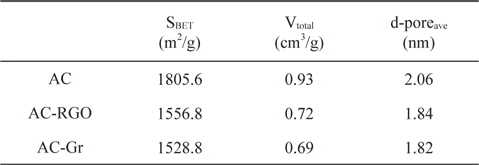
Table 2 shows the BET surface area, total pore volume, and average pore diameter of the AC-RGO electrode compared with the AC electrode. The AC material provides high surface area as the main active material for electrosorption. With the addition of RGO in the electrode composition, the surface area and pore volume decrease as the RGO particles fill the path of the ions to be adsorbed. However, compared to the AC, which mainly consists of micropores, RGO can decrease the overlapping effect caused by micropores, which is beneficial to electrosorption. Hence, despite the decrease in surface area, the conductivity of electrode is also an important factor for the electrosorption capacity, and helps determine the flow of charged ions in the electrode pore. The movement of ions is more difficult in the smaller pores than in the large pores, so that RGO can provide micropores’ accessibility to the salt solution [11].
[Table 2.] BET properties of the AC, AC-RGO, and AC-Gr electrodes

BET properties of the AC, AC-RGO, and AC-Gr electrodes
3.3. Electrochemical characterization
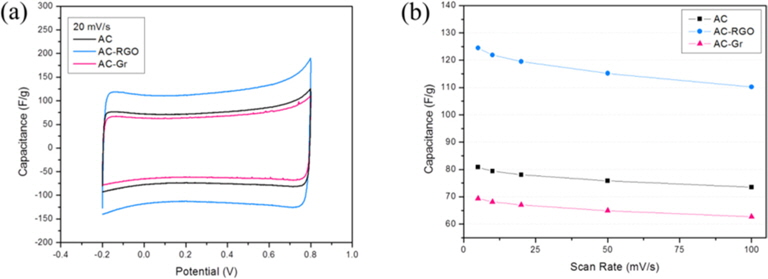
CV measurements were carried out within the potential range of -0.2 to 0.8 V to analyze the electrochemical behavior of the CDI electrodes. Fig. 6a shows the cyclic voltammograms of ACRGO, AC-Gr and AC electrodes at a scan rate of 20 mV/s. It can be seen that the samples show a typical rectangular curve within the potential ranges, indicating high electrosorption capacitive behavior. However, small distortions were also observed in the voltammogram, a delay of potential when reversing the potential sweep. This means that the electrochemical behavior of the CDI electrodes depends not only on the charging current in the electric double layer, but also on faradaic currents [19].
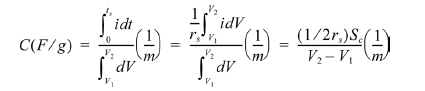
The electrodes’ specific capacitances were calculated by using the following equation [20]:

where
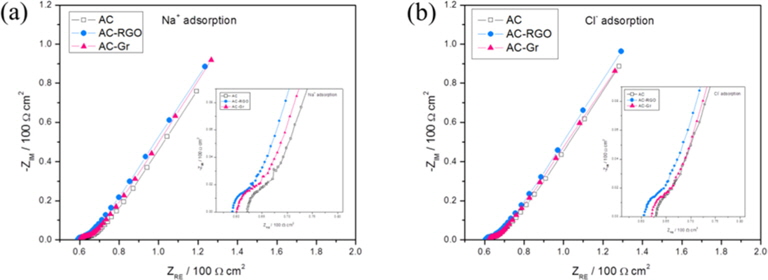
EIS was also used to observe the electrochemical behavior of the CDI electrodes. The Nyquist plots and their enlarged sections (high frequency, inset) of the AC-RGO, AC-Gr, and AC electrodes are shown in Fig. 7. These plots show typical EDL capacitor behavior. The region with the 45° slope at high frequencies (10 kHz-1 Hz) can be assigned to the behavior of the porous structure and is often called the distributed resistance. For low frequencies (<1 Hz), the spectrum approaches a vertical line and behaves like an ideal capacitor, with R and C being no longer frequency-dependent [21].
The impedance performance from the high-frequency range, which is referred to as equivalent series resistance (ESR), is discussed here, as it is related to the electrode conductivity. By comparing the three samples in a single plot as in Fig. 7, it can be seen that the AC-RGO and AC-Gr electrodes have lower ESR than the AC electrode. This shows that the addition of a conductive material to the AC electrode reduces the electrode/electrolyte interface resistance, thus increasing the ability of the electrolyte solution to penetrate into the micropores of the AC particles.
Two kinds of Nyquist plot are shown in Figs. 7a and b, comparing the difference of the electrodes adsorption for cation (Na+) and anion (Cl-), respectively. There is not much difference between them, just the ESR for the Na+ adsorption is slightly lower than the ESR for the Cl- , due to the difference in ion size.
3.4. Desalination performance test
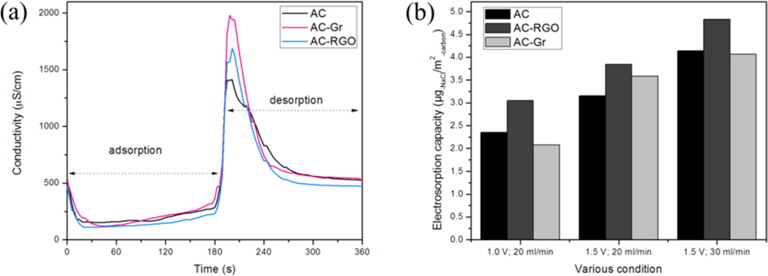
The desalination performance test was carried out with adsorption (1.5 V for 3 min) and desorption (0.0 V for 3 min) processes with a NaCl feed rate of 20 mL/min, repeated for five cycles. The results of conductivity change per unit time at the 5th cycle for AC-RGO, AC-Gr, and AC are shown in Fig. 8a. The initial conductivity was 512 μS/cm based on the conductivity of the 250 mg/L NaCl solution. When the potential was applied to the electrode, Na+ and Cl- were attracted onto the surface of the oppositely charged electrodes, which can be observed from the decreasing conductivity of the NaCl solution. The AC-RGO electrode reduced the conductivity of the NaCl solution more than the AC-Gr and AC electrodes, which means relatively more ions were being adsorbed in the AC-RGO electrodes’ pores. The conductivity of NaCl was also reduced using the AC-Gr electrode. However after it reached the lowest point, the conductivity increased gradually. This can be explained because the capacitance of the AC-Gr electrode was the lowest.
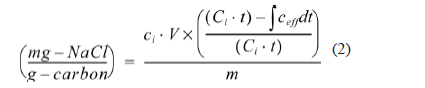
The electrosorption capacity of the electrodes was calculated using the following equation:
electrosorption capacity

where
RGO was synthesized and added as a conductive material in the composition of a carbon electrode for application in CDI. The electrochemical behavior of the AC-RGO electrode showed that it can increase the specific capacitance and reduce the ESR of an AC electrode, and indicated that RGO reduced the aggregation of AC particles, thus improving the penetration of electrolyte solution into the micropores of AC particles. The salt removal efficiency and the electrosorption capacity of the AC-RGO electrode was higher than the AC-Gr in every condition performed in this experiment, which proves that RGO is preferred over graphite as a conductive material addition for CDI applications.