Optical tomography was used to measure the pattern of spray cross-section. The maximum-likelihood estimation (MLE) algorithm was used to reconstruct the spray cross-section from the measured transmission rate of the spray. A swirl-type injector was used to form an optically dense spray, and the test was carried out in a high-pressure chamber, to control the pressure condition of the test site. Before the experiment, the reliability of the MLE-based reconstruction algorithm was verified, by comparing it with a conventional filtered back projection reconstruction (FBP) method. The MLE algorithm showed superior reconstruction of the image. In the spray patternation experiment, the results of the optical tomography and optical line patternator, which uses Mie scattering signal information, were compared. While measuring the cross-section of optically dense spray, the intensity of the scattering signal had attenuated to an uncorrectable level, which led to incorrect spray pattern measurement by the optical line patternator. However, reliable results were obtained by optical tomography, under the same condition. Finally, the pattern of the optically dense spray was measured at various chamber pressures, of up to 3 MPa. As the chamber pressure increased, the hollow cone-shaped swirl spray shrank, and the attenuation coefficient value of the inner region increased.
Liquid fuel is widely used in industrial power plants; combustion engines; and propulsion units, such as gas turbines, diesel and gasoline engines, and jet engines and rocket engines. Since most fuel is injected into the combustion chamber in spray form, spray characteristics have been widely investigated. Spray pattern study is especially important, because spray patterns are crucial factors that help determine combustion characteristics [1].
Various methods have been developed to measure the spray pattern. Initially, a mechanical method was employed [2, 3]. This method measures spray distribution by directly collecting fluids in the measuring area. However, some problems are encountered in this method of patternation, namely, difficulty of setup in limited space, low spatial resolution of patternation, and flow intrusion, resulting in distortion of the measured results. Therefore, a nonintrusive patternation method was required, for improved measurement of spray patterns.
Thereafter, many methods of indirect patternation have been developed. These methods used various approaches, including X-ray [4], ballistic image [5], and laser-induced fluorescence [6], to measure the spray pattern, without affecting the spray formation process. In particular, optical patternation methods are widely used, with relative ease in experimental setup, although some problems that caused measurement error were encountered - extinction of the incident light, attenuation of the signal from spray, and multiple scattering of the signal [7]. Various methods were suggested to overcome these problems, such as mathematical correction [8, 9], or reduction of the signal error, by improving the measurement setup [7]. An optical line patternator, suggested by Koh et al. [10], used the scattering signal from a laser beam passing through the spray, and employed an algebraic reconstruction method to measure the spray area, in order to reduce multiple scattering, and ensure correct signal attenuation, respectively.
Meanwhile, an optical tomography was suggested, for use as an optical patternation method. Normally, tomography measures the transmittance of the sample, and reconstructs the cross-section. This method was first developed for use in biological research [11], and is used in the measurement of gas jet [12] and liquid flow [13, 14]. In this method, the filtered back projection (FBP) algorithm was primarily used for section reconstruction [12]. The maximum-likelihood estimation algorithm, which is based on probability statistics, has recently been adopted for reconstruction in this method [13, 14].
Since the combustion engine is required to have a large output, high quantities of fuel are injected in the combustor, working at higher pressure. In such cases, the increased mass flow rate and ambient pressure would make the spray optically dense. Optical tomography is considered a reliable method for measuring sprays, and previous studies have conducted spray patternation, in conditions of relatively low mass flow rate, and ambient pressure up to 1 MPa [14].
In this study, optical tomography was used to measure the pattern of an optically dense spray. The reliability of the tomographic reconstruction method was first tested, by quantitatively analyzing the reconstruction performance of a sample image. In addition, the scattering-based patternation method (optical line patternator) and transmission-based patternation (optical tomography) method were compared. Finally, optical tomography was conducted, to measure the cross-section of the optically dense spray with high mass flow rate, compared to the previous works [10, 13, 14], and with increased ambient pressure.
2.1 Tomographic Reconstruction
Optical tomography was used to measure the crosssection of a spray. Transparent liquid (i.e. tap water) was used as the working fluid in the optical measurement method, to ensure light penetration through the spray with less obstruction. While the physical properties of water (viscosity, surface tension, etc.) are different to that of conventional combustion fuels, water is easy to handle. Therefore, many studies have used water as a simulant of fuel, to investigate the qualitative characteristics of the spray [3, 7, 8, 10, 13]. The spray cross-section was then reconstructed from the measured optical signal. The optical line patternator mainly uses the Mie scattering signal, and optical tomography uses the transmission rate of a laser beam through the spray. The mechanism of the optical line patternator was explained in a previous study [10]. The mechanism of optical tomography for measuring spray cross-section is presented below.
In optical tomography, the distribution of the attenuation coefficient in the spray was calculated. From the transmission rate, measured from various angle views of the spray, a planar distribution of the liquid spray was reconstructed, using the maximum-likelihood estimation (MLE) technique [13, 15]. The MLE algorithm was developed for positron emission tomography, and its estimation-maximization method has proven to be useful in various situations [16]. A detailed theory of the MLE algorithm is based on positivity statistics, and can be found in previous works. Briefly, the attenuation coefficient distribution of the spray cross-section can be calculated using the following iterative equation [13, 15]:
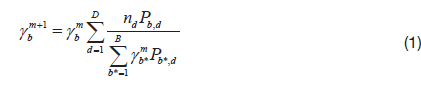
In Eq. (1),
To apply Eq. (1) in spray patternation, some variables in the equation should be redefined. Before redefinition, as the method requires the transmission rate of the incident laser beam through spray, the Beer-Lambert law should be used, as follows.
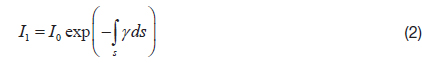
In Eq. (2),

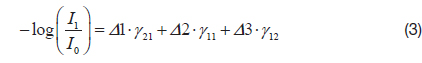
Equation (3) is obtained by taking the logarithm of Eq. (2). The integral of attenuation coefficients along path s was written in discrete form according to Fig. 1, in which the measurement area is expressed as small boxes. The pass length ∆ and attenuation coefficient
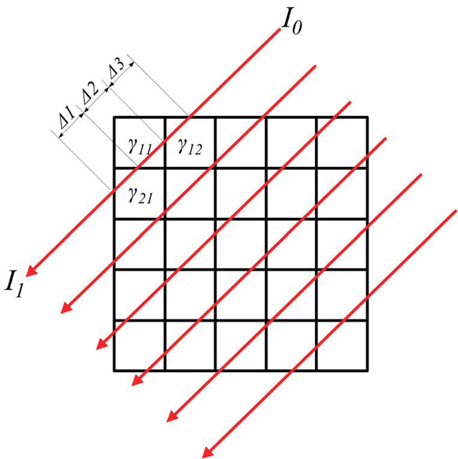
To obtain optical signal information, laser beams were used in both optical tomography, and optical line patternator. A laser line beam swept the spray area, to measure the transmission rate of the beam, and scattering signal through the spray. With the reconstruction process, the attenuation coefficient map of the spray cross-section was calculated. An injector was mounted in a high pressure chamber, to form an optically dense spray. The chamber contained 6 windows for optical access, each with a circular view of approximately 80 mm in diameter. The spray cross-section 20 mm downstream from the injector post was measured. The size of the measurement area was 60 mm × 60 mm, which sufficiently covered the entire spray section area, and was smaller than the diameter of the chamber window.
In the optical line patternator, a He-Ne laser (
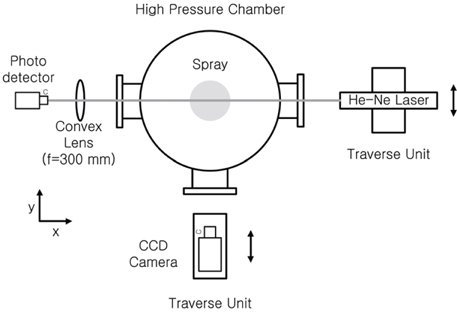
For optical tomography, an Ar-Ion Laser (
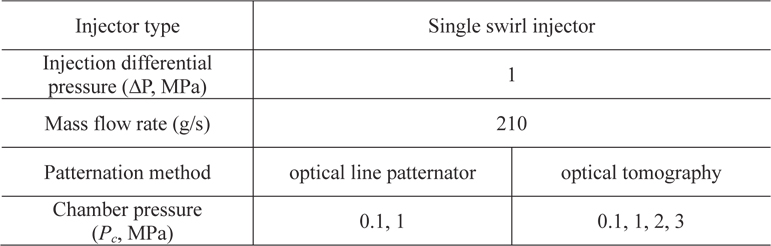
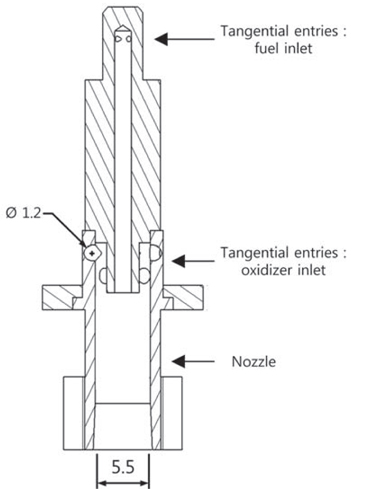
A swirl-type injector was used to form the hollow cone-shaped spray of high optical density. Fig. 4 shows a schematic representation of the injector. Although the injector was designed to have two sets of tangential entries, to enable coaxial swirl flow, only one set (oxidizer inlet, Fig. 4) was used, to obtain a spray with single swirl flow. There were eight entries in all, and the diameter of each entry was 1.2 mm. The exit nozzle diameter of the injector was 5.5 mm. Tap water was used as the working fluid, and the mass flow rate of the spray was 210 g/s, as the injection differential pressure was maintained at 1 MPa.
The injector was mounted inside a high pressure chamber. The chamber controlled the conditions of the spray. The inside pressure of the chamber was adjusted up to 3 MPa with nitrogen gas. Table 1 shows the experimental conditions.
[Table 1.] Experimental conditions

Experimental conditions
3.1 Validation of the Reconstruction Algorithm
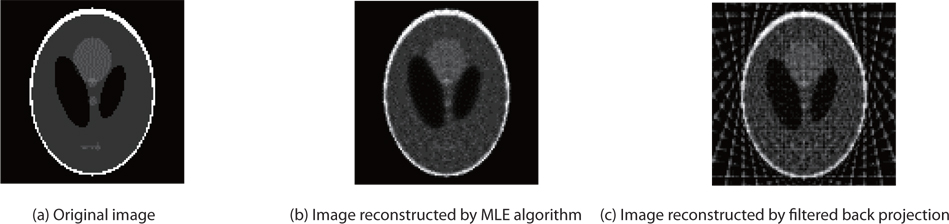
To verify the reliability of the MLE reconstruction method, the technique was compared with the conventional FBP reconstruction algorithm. To examine the performance of each method, a 100×100 pixel Shepp-Logan phantom image was used as a sample. This image is widely used in computerized tomography (CT) research, particularly for performance evaluation of reconstruction algorithms. The sample image was changed with radon transform, and the transformed image was reconstructed, using each method.
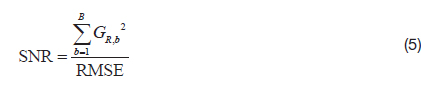
The original sample and reconstructed images are presented in Fig. 5. The concepts of root-mean-square error (RMSE), signal-to-noise ratio (SNR), repeatability index (RI) and relative difference (RD) were adopted [17], and calculated, for quantitative comparison of each reconstruction algorithm. Lower values of RMSE and RD indicated that the difference between the original and reconstructed images is small, whereas lower values of SNR and RI indicated the converse. The definitions of the difference-quantifying values are shown in Eqs. (4) to (7).
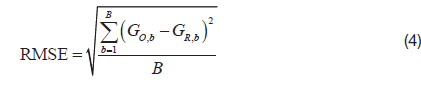

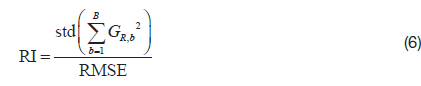
std : standard deviation
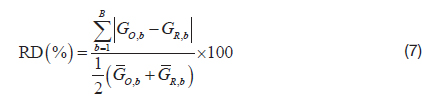
In the above equations,
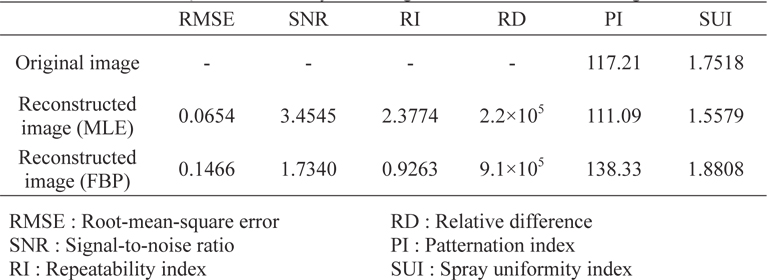
The results are presented in the second through fifth columns of Table 2. The results revealed that the MLE method reconstructed the original image more effectively than the FBP method. Further, with respect to RMSE and RD, the MLE algorithm had less than half the errors encountered in the FBP method. Similar results have been deduced with respect to SNR and RI-the MLE-reconstructed image calculated these values to be almost two times higher, than corresponding values calculated by the FBP-reconstructed image.
[Table 2.] Quantitative analysis of original and reconstructed images

Quantitative analysis of original and reconstructed images
The Patternation Index (PI) [2] and Spray Uniformity Index (SUI) [18] were also calculated, to find the image characteristics, which indicate the characteristics of the planar pattern of the spray. PI and SUI can be calculated, as shown below.
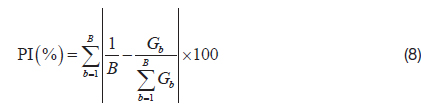
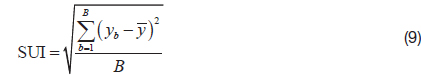
PI and SUI represent characteristics of the spray pattern; therefore, they would be expected to show the characteristics of planar images. The values of PI and SUI from each image are shown in Table 2 (columns 6 and 7). In the investigation, each reconstruction method reproduced the characteristics of the original image with high accuracy. In the analysis of PI, the difference between the original image and the MLE-reconstructed image was 5.2%, while that between the original and FBP-reconstructed image was 18.0%. This result illustrates that the MLE algorithm is superior to the FBP algorithm. On the other hand, the opposite results were obtained in the same analysis for SUI: the difference between the original and MLE image was 11.1%, while that between the original and FBP was 7.4%. However, the difference in the latter case was considerably lower than the results obtained from PI analysis.
3.2 Comparison of optical line patternator and optical tomography
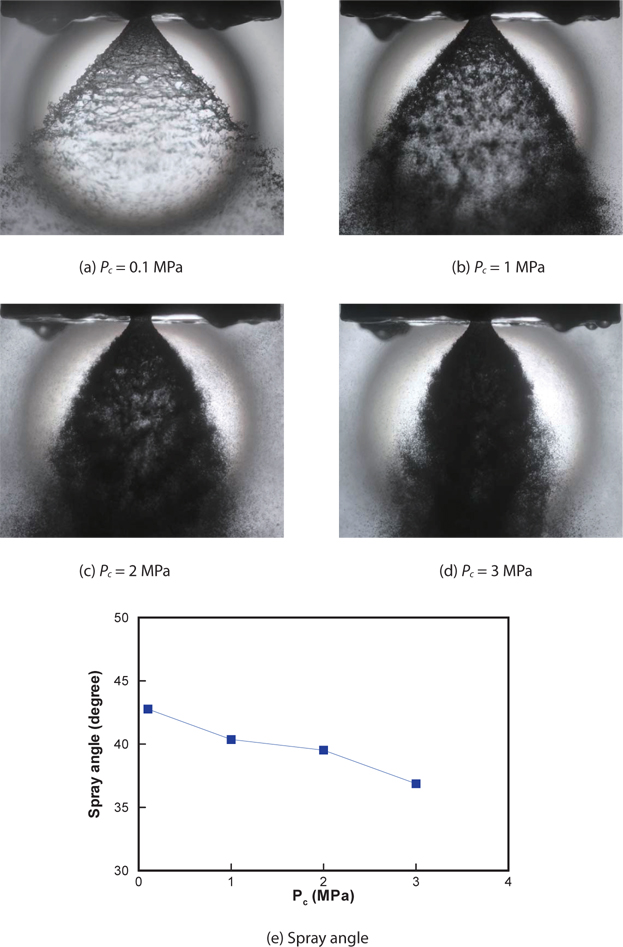
The results obtained from the two measurement methods were compared. Fig. 6 shows the spray shape at various chamber pressures. As the spray was formed by a swirltype injector, the shape of the spray was expected to be a hollow cone, with symmetric ring-like cross-section. When the ambient pressure increased, the spray angle decreased, and the spray became optically dense. As a result, serious attenuation of the optical signal occurred, increasing the need for signal correction [7].
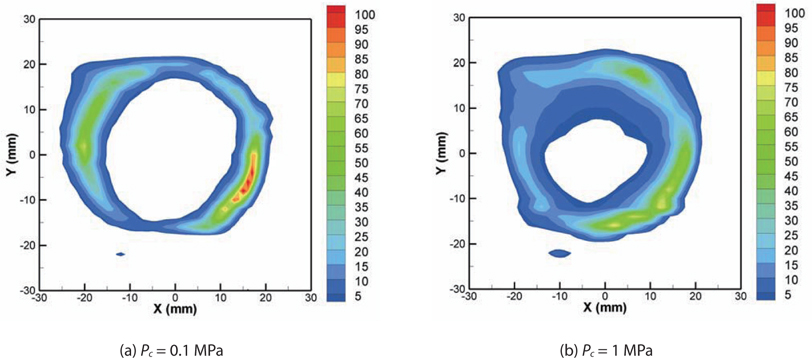
Figure 7 shows the planar distribution of the attenuation coefficient in the spray cross-section, obtained by the optical line patternator. Although the attenuation effect of the scattering signal was corrected in the reconstruction process, signal correction was limited in the optically dense spray, resulting in asymmetric shape of the reconstructed cross-section. This phenomenon was intensified when the chamber pressure was increased from 0.1 MPa to 1 MPa, as a result of which the spray became optically dense.
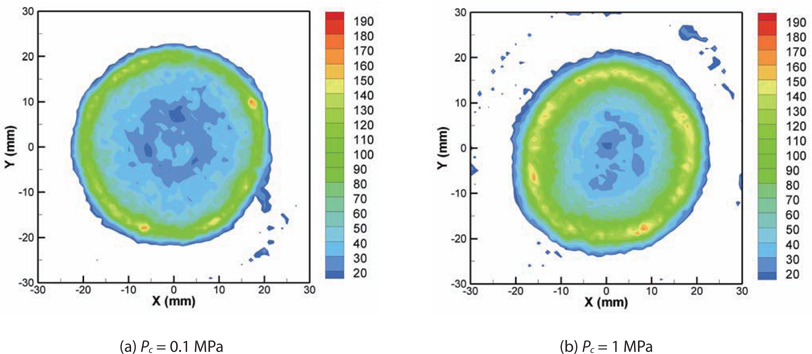
The reconstructed spray section obtained from optical tomography is shown in Fig. 8. Since optical tomography measured the optical signal at various angle views, it was not necessary to correct the attenuation effect. The reconstructed spray cross-section was in a symmetric ringlike shape. However, when
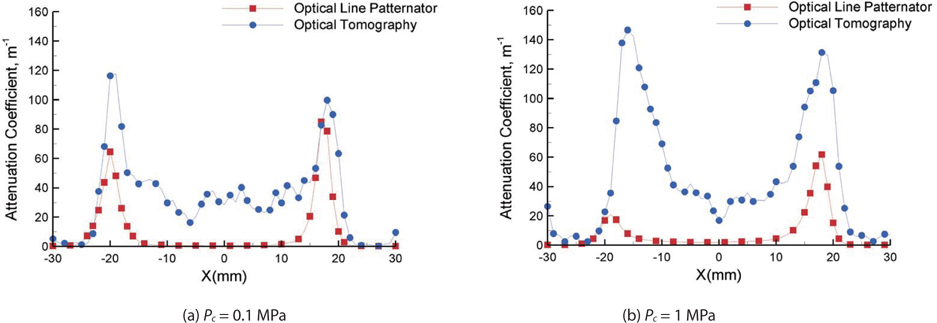
In Fig. 9, the spray patterns obtained from each method were directly compared, along the line passing the center of the measurement area, in the direction of the X-axis. The incident laser beam passed the spray from right to left. When the chamber pressure
3.3 Effect of the Ambient Pressure on the Spray
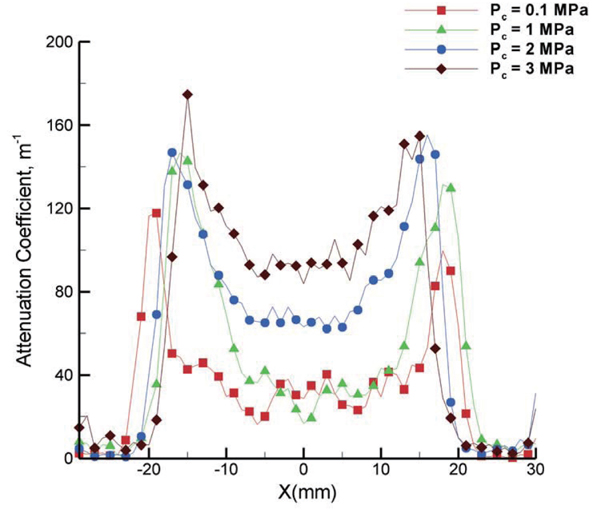
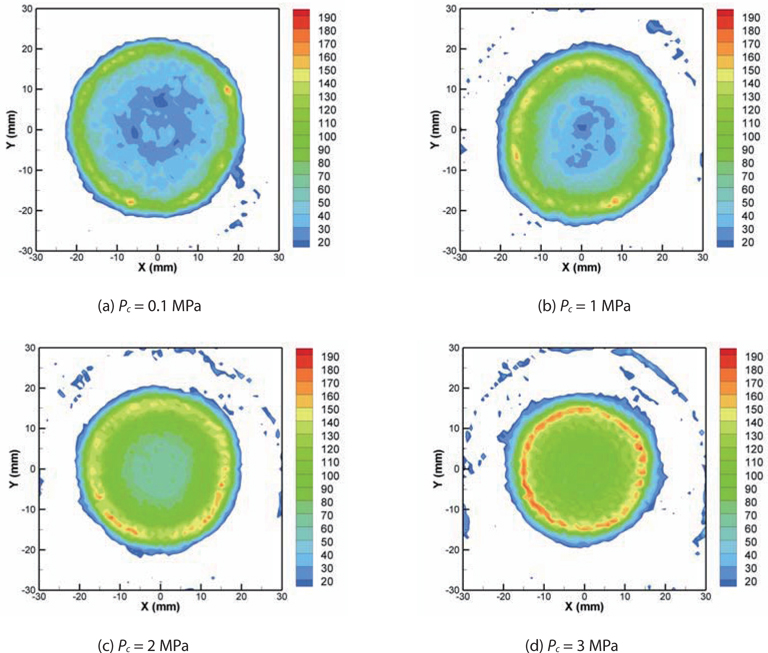
The planar distribution of the spray was measured by optical tomography, at different values of ambient pressure. In the experiment, the chamber pressure was changed to 0.1, 1, 2, and 3 MPa. The reconstructed image of the spray cross-section is shown in Fig. 10. As the chamber pressure increased, the size of the spray diameter was decreased (Fig. 6). The value of the attenuation coefficient at the central region of the spray was also increased, suggesting that the spray pattern was changed from a hollow cone to a solid cone, with increase of the ambient pressure. The trend was distinctly observed, when comparing spray distribution along the X-axis (Fig. 11). Similar results have already been obtained in many previous works [1, 3, 10]. These similar trends reported previously prove the reliability of optical tomography for patternation of optically dense spray.
In this study, planar distribution of the optically dense spray was measured, using optical tomography. The reconstruction technique was validated, compared with another optical patternation method, and the measurements were performed at various ambient pressure conditions.
1. A recently developed reconstruction technique (MLE) was compared with the conventional reconstruction method (FBP). The MLE reconstruction algorithm showed similar or slightly better performance, as compared to the FBP method, in reconstruction of the sample image, and the validity of the MLE algorithm was confirmed. 2. Spray patternation methods using the scattering signal (optical line patternator) and transmission rate (optical tomography) were compared. In the scatteringbased method, patternation failed, because of the uncorrectable attenuation caused by dense spray. In contrast, the transmission-based method was not affected by this attenuation problem. However, the central region of the spray was falsely reconstructed by the latter method at Pc = 0.1 MPa, by overestimating the attenuation coefficient at the region. 3. As the ambient pressure increased, the spray shape and pattern changed. When the chamber pressure was increased, the diameter of the hollow cone spray was decreased. The hollow region inside the spray was reduced, and the attenuation coefficient was increased, a trend that is similar to those in previous studies. The result shows that optical tomography can be reliably used to measure optically dense spray.