Automatic detection of disease helps medical institutions that are introducing digital images to read images rapidly and accurately, and is thus applicable to lesion diagnosis and treatment. The aim of this study was to apply a symmetry contribution algorithm to unsharp mask filter-applied MR images and propose an analysis technique to automatically recognize brain tumor and edema. We extracted the skull region and drawed outline of the skull in database of images obtained at P University Hospital and detected an axis of symmetry with cerebral characteristics. A symmetry contribution algorithm was then applied to the images around the axis of symmetry to observe intensity changes in pixels and detect disease areas. When we did not use the unsharp mask filter, a brain tumor was detected in 60 of a total of 95 MR images. The disease detection rate for the brain was 63.16%. However, when we used the unsharp mask filter, the tumor was detected in 87 of a total of 95 MR images, with a disease detection rate of 91.58%. When the unsharp mask filter was used in the pre-process stage, the disease detection rate for the brain was higher than when it was not used. We confirmed that unsharp mask filter can be used to rapidly and accurately to read many MR images stored in a database.
In modern medicine, medical images have been considered as one of the most important tools for patient diagnosis and treatment. However, automatically detecting only the areas of disease in medical images is a very difficult process due to the extremely large volumes of data and extreme complexity. In clinical practice, computer-aided diagnosis (CAD) can be a very useful tool to enable automatic interpretations of medical images. Especially, many studies have been carried out on the analysis technique of automatically recognizing areas of brain tumor and edema in MR images.
The CAD system can provide a valuable examination and accuracy of earlier brain tumor detection. It consists of two stages [1,2]. The first stage involves pre-processing and enhancement, while in the second stage, feature extraction, feature selection, classification, and performance analysis are compared and studied. Pre-processing and enhancement techniques are used to improve the detection of the suspicious regions in MRI. Accessing and researching actual medical images such as those of MRI, PET or CT scan is a very complex task because of privacy issues and heavy technical hurdles. The purpose of this study is to compare automatic brain tumor detection methods through MR brain images. Nowadays, MRI systems are very important in medical image analysis. The detection of a brain tumor requires high resolution brain MRI. Most medical imaging studies and detection are conducted using MRI, positron emission tomography (PET), and computed tomography (CT) scanning. MRI has a multidimensional nature, with data provided from different sequential pulses. MRI is the modality of choice for evaluating brain morphology because it provides superior soft-tissue contrast with flexible data acquisition protocols that highlight several different properties of the tissue [3,4].
Current statistical methods detect changes in the brain between 2 MR imaging studies, but do not provide fully automated segmentations of lesion change [5]. Volumes from 2 time points are registered, and statistical models classify voxels into no signal change, signal increase, signal decrease, and outside of the brain [6]. Higher lesion activity detection probabilities have been obtained by extending this method to the use of multisequence imaging data [7]; however, clusters of highly likely lesion change voxels must be reviewed by an expert to produce lesion change segmentations. Temporal analysis approaches are based on a voxel level time-series [5]. Longitudinal collections of images for a subject are registered, and voxel intensities are analyzed as a function of time. While lesions and other tissue classes of the brain can be segmented from these time-series [8], these methods require more than 2 MR imaging studies for each subject.
In contrast to intensity-based methods, deformation fieldbased approaches, the modification of the tissue surrounding the lesions is observed [5]. Volumes from 2 time points are registered, and structural changes in the brain are determined by the local deformation of voxels [9]. While these methods have been shown to perform better than intensity-based methods for the segmentation of lesions, the region of interest needs to be manually selected before the analysis.
Currently, no fully automated method is available that produces segmentations of incident lesions and lesion enlargement using information from only 2 MR imaging studies.
One can very usefully determine whether or not a disease is present by using the major features of the human body when applying CAD to medical images. One of these features is that most of the human body is symmetrically structured. The skull area is especially symmetrical, and this feature can be useful for determining whether or not a disease is present [10]. In this study, a technique is proposed to automatically detect brain lesions by performing a pre-process stage with brain MR images and unsharp mask filters, detecting the skull outline with a symmetry transformation symmetry contribution algorithm [11], and applying the method to set an axis of symmetry.
A total of 95 MR T1 images were used in the study shot at P University Hospital between 2011 and 2012. All MR images were acquired on a 1.5T MRI system. The MR images were transformed to jpg images and all images had 1 mm slice thickness with 1×1 mm in plane resolution.
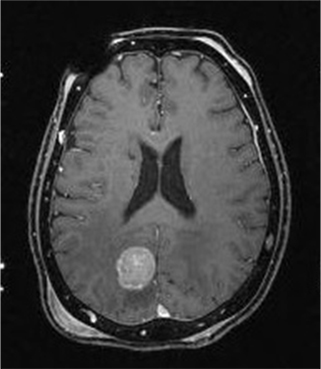
Figure 1 shows the MR images of a brain disease.
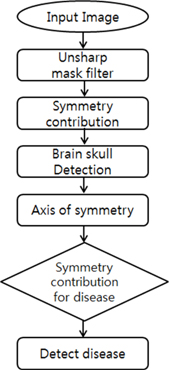
Figure 2 presents a total block diagram.
Grey MR images go through a pre-process stage with unsharp mask filtering. Unsharp mask filters make images sharp and thus perform opposite functions to the Gaussian filters that make images soft. Unsharp mask filter was removed the blurring image from original image. As a result, the boundaries of the image was emphasized.
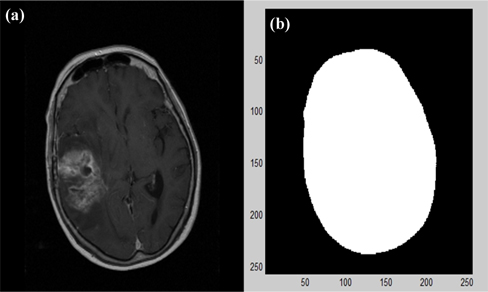
As one of the outline components in the pre-processed images, the skull area was extracted using the generalized symmetry transformation algorithm proposed by Reisfeld [6] (Fig. 3).
In Fig. 3, the pixels inside the extracted skull outline were filled to 255 to show only the cerebral area. The cerebral area is oval-shaped in most parts, a characteristic that can be used to determine the degree to which the oval is inclined by determining its major and minor axis. Its inclination helps to obtain the central axis of the cerebrum and set an inclined image to be upright. Symmetry contributions can accumulate in the cerebral area to highlight areas of strong symmetry in images by using the changes in the degrees and directions of brightness to each pixel of extracted outlines. When each pixel of images is pk=(xk,yk), the degree of symmetry Mσ (p) representing the degree of symmetry at pixel p in the image (k=1,2,3 .. K) can be obtained using the following formulas:
Here, the locations of ri and rj represent the size of brightness changes to pixels pi and pj at (xi,yi) and (xj,yj), respectively, θi and θj represent the direction of brightness changes to pixels pi and pj, respectively, αij represents the angle between the straight line connecting pixels pi and pj and a horizontal line, and σ represents the size of a symmetry mask. Symmetry contribution C(i,j) increases when two pixels are symmetrical in the direction of the changes in brightness, the distance between them is closer, and their brightness changes are larger. The symmetry contribution of symmetry transformation is very closely related to the outline of an image. Principal component analysis using symmetry contribution produces fast, accurate, and reliable results by using the symmetry axis of symmetry contribution. Even then minimal information is given, we can rotate the image and change the size.
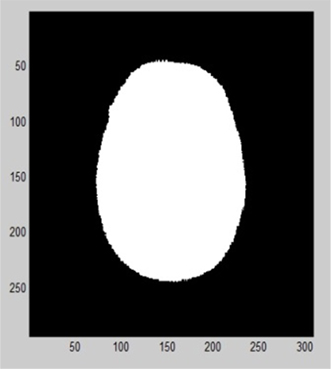
The most important factor in recognizing images with symmetry contributions is to set the axis of symmetry, which is the axis of rotation, to compare the contribution of the shapes of objects and the standard to normalize images. Since the cerebrum is oval-shaped in most cases, we can determine the major and minor axes of the cerebrum by using the axis of symmetry. Figure 4 presents the results from obtaining the axis of symmetry and using it to rotate images.
In Fig. 4, the cerebral area is divided into right and left along the axis of symmetry.
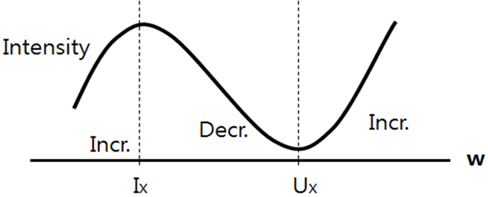
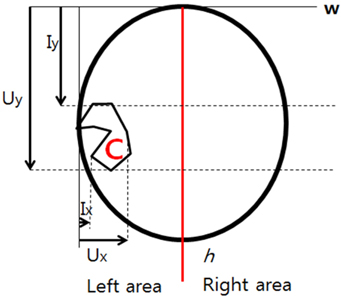
In the normalized image, C represents an area of which the pixel intensity differs between the right and left. The cerebral width (w) was marked as the x axis. A difference is observed in the pixel intensity in the C area along the axis of symmetry. As shown in Fig. 5, the section from Ix to Ux in the left area along the w axis representing the cerebral width shows the greatest difference from the right area. The intensity graph of the same shape was drawn for h, representing height.
In Fig. 6, pixel intensity transformation is shown in the graph of pixel intensity changes for the horizontal axis, which is w.
In the graph, the highest or lowest point represents the size of the tumor or edema on the horizontal axis. A graph of the same pattern was drawn for the vertical axis h with the highest and lowest point used to determine the size of the horizontal axis of the tumor.
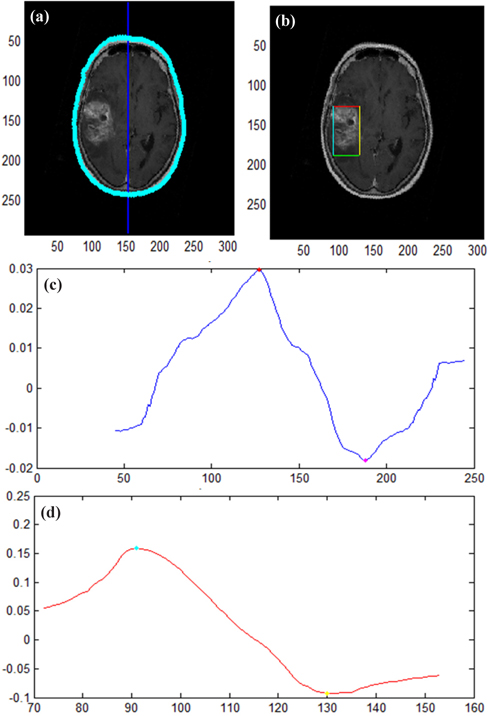
Figure 7 shows the results of applying symmetry contribution to images where an unsharp mask filter was not applied.
In Fig. 7(a), we detected the cerebral outline and axis of symmetry in the original image of a brain disease. Figure 7(b) presents the results of calculating the symmetry contribution along the axis of symmetry and detecting a disease area with pixel intensity transformation.
Figure 7(c) shows the pixel intensity of the x axis of an image where a symmetry contribution algorithm was applied, and (d) presents the pixel intensity of the horizontal axis h.
A disease was detected and the symmetry contribution algorithm was applied in 60 of the total 95 images, in which case the lesion detection rate was 63.16%.
In the present study, unsharp mask filters were applied to increase the lesion detection rate when a symmetry contribution algorithm was applied.
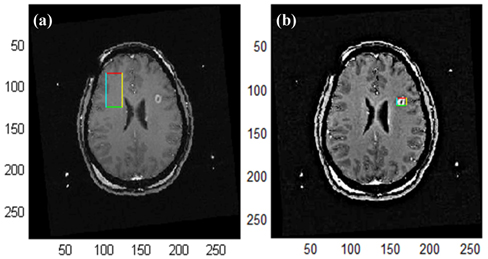
As seen in Fig. 8, while disease was not detected when no unsharp mask filter was applied, it was detected after application of the unsharp mask filter. In the present study, an unsharp mask filter was applied to the 35 images in which a lesion was not detected in order to increase the lesion detection rate.
As a result, lesions were detected with the application of an unsharp mask filter, as shown in Fig. 8(b).
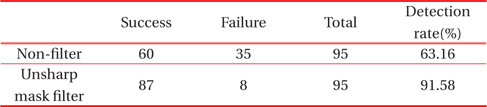
Table 1. presents the lesion detection rate when an unsharp mask filter was applied and when one was not applied.

Results in the cases of application of an unsharp mask filter and application of no unsharp mask filter.
The disease detection rate was 63.16% when a filter was not applied and 91.58% when a filter was applied.
4. CONCLUSIONS AND CONSIDERATIONS
Today, automatic disease detection systems utilize the region growing method [12,13], statistical pattern recognition [14,15], and principal component analysis [16,17] in computer-aided diagnosis (CAD). The region growing method [18] has the disadvantage of leakage to other regions during growth. Statistical pattern recognition [19] and principal component analysis require advance registration of image information about a brain lesion, and are thus time-consuming and inconvenient [20].
Using the lesion detection method based on symmetry contributions proposed in the present study, a 91.58% lesion detection rate was recorded when applying an unsharp mask filter as a pre-treatment process. The findings confirm that the method is capable of rapidly and accurately discriminating a large volume of MR images stored in a database.
However, the method is limited in the case of a minute brain lesion and the cerebrum can be falsely detected as a lesion. It is also limited in that it captures only some areas around the strongest pixel of a lesion in the case of two simultaneous lesions in an image instead of detecting both legions.
In recent years, many studies have been conducted on CAD systems to assist in making an accurate, uniform, and efficient diagnosis of disease. The large amount of research carried out on breast- and lung-related diseases, however CAD researches on brain diseases are rare.
In the present study, a symmetry contribution algorithm was applied to the MR images of patients with a brain disease and lesion areas were detected. The lesion detection rate was 91.58% when an unsharp mask filter was applied, it means that our research was useful on the screen test about brain diseases. When its problems are compensated for, the algorithm will be able to play a better role in CAD research on brain diseases.
The rate of misdiagnosis in clinical practice can be lowered for easier diagnosis and treatment by detecting lesion areas more accurately and thus re-reading a vast amount of data in the field of medicine.