The Polarization and Depolarization Current test had been applied to many items of electrical apparatus to monitor their condition, such as machine stator, transformer and power cables. The PDC test was used for maintenance and diagnostic tests periodically conducted on machine stator insulation systems, to continuously monitor both the charge and discharge current, during a step voltage test [2,3].
Researcher [4] has applied the Polarization /Depolarization Current (PDC) analyzer for the insulation assessment of power cables since 2002. Researches [5-7] have applied the PDC technique for XLPE insulation that is subjected to wet ageing.
This technique has also already been applied as a quality assurance tool for the assessment of power transformers by researchers [8-15]. Researches [14-16] have been done to investigate the moisture content and conductivity of the oil insulation, focused on transformer oil. Research has been carried out to find the dielectric responsive function and maximum conductivities of biodegradable and mineral transformer oils with different moisture levels (dried, normal, or wet) for comparative analysis, by researcher [17] .
2.1 The insulation conductivity concept
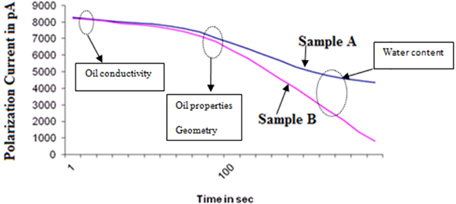
By examining the PDC curves, parameters such as conductivity and moisture content in the insulation can be estimated. Figure 1 shows an example of PDC curves in a dB plot. The figure shows the oil conductivity, oil properties, geometry, ageing and water content influence on the PDC-Curves [18]. Based on the figure, the conductivity of the insulation can be measured from the front tail of the PDC curve. The value of conductivity affects the polarization current, mainly in the time range t<100 s. Higher conductivity leads to a higher current value. Moisture content can be measured from the end tail of the PDC curve.
From the measurements of polarization and depolarization currents, it is possible to estimate the dc conductivity σ, of the test object. If the test object is charged for a sufficiently long time, so that f(t+tc)≅0, the dc conductivity of the composite dielectric can be expressed as [1,16,17,19,20]:

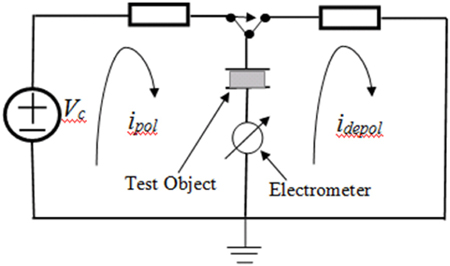
The polarization currents measurement is performed by applying a dc voltage step on the dielectric materials, and the depolarization current is measured by removing the dc voltage source, incorporating a switch, which turns on to short circuit the tested objects. The dc voltage applied was 1,000 V, for about 10,000 seconds for the polarization and depolarization time. The principle of PDC measurement is shown in Fig. 2.
3. MEASUREMENT RESULTS AND ANALYSIS
3.1 Effect of moisture content and temperature on transformer insulation
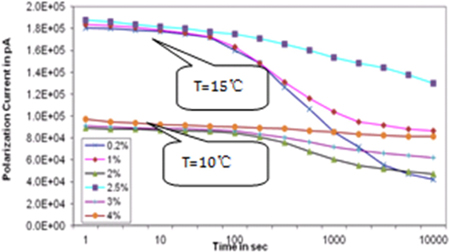
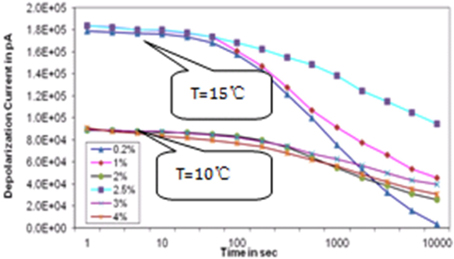
In order to access the low temperature effect on PDC measurements, an adiabatic climate chamber with ±0.1℃ accuracy was used, to vary the temperature at 10 and 15℃. Figure 3 and Fig. 4 show the effect of moisture content on the polarization and depolarization current measured at 10℃ and 15℃. From these figures, it can be seen that the amplitude of the long term dc polarization/ depolarization current is very sensitive to the moisture content in paper. Any increase in moisture content shifts upward the long term range of the dc polarization/depolarization current.
For the temperature effect, it can be seen that the PDC current magnitude increases with increasing temperature from 10℃ to 15℃, for both initial and long term PDC values. The temperature of insulation has great influence on the results, and the interpretation of PDC measurements [14]. After 100 s, the current shows an obvious trend, because at this time the molecules inside the material get enough energy to move inside the material, from positive to negative electrode.
3.2 Conductivity of transformer insulation
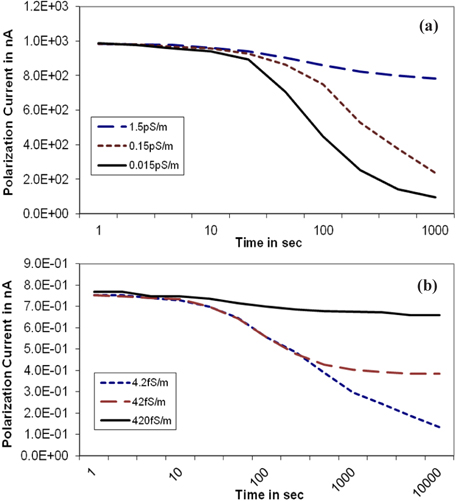
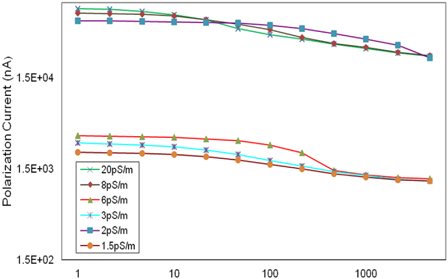
Figure 5 shows the variation of polarization current with paper conductivity. It is observed that the change in paper conductivity tends to affect the tail of the polarization currents [16]. Whereas, Fig. 6 shows that the initial part of the curve is primarily controlled by the parameters of the liquid dielectric. Higher liquid insulation moisture or conductivity tends to increase the magnitude of the polarization currents during the head of the PDC curve. A higher value of conductivity tends to increase the magnitude of the PDC. These results show that the initial amplitudes of polarization current can be used to estimate the oil conductivity of a transformer, without performing direct conductivity measurement.
3.3 Machine insulation results
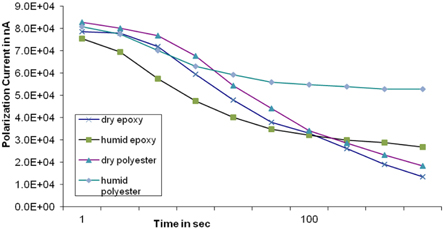
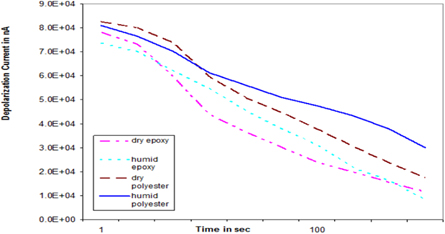
The analysis for PDC measurement for machine insulation was done, based on the results in a paper published by researchers [6]. Figure 7 and Fig. 8 show that the polarization and depolarization current for polyester-mica coil is higher than for epoxy-mica bar, in both conditions. Their conductivity increases sharply after moisture absorption, which caused a significant change in the dielectric response of the insulation system, resulting in the occurrence of an interfacial polarization peak within the time frame of observation. Table 1 shows the maximum and minimum current of these two insulations. The minimum value interprets the moisture absorption of the insulation, which indicated higher moisture absorption for polyester-mica coil. The result was compiled, and is shown in Fig. 7 and Fig. 8. Higher solid insulation moisture or conductivity tends to increase the magnitude of the polarization and depolarization currents, for longer time.
[Table 1.] Machine insulation current for different condition.
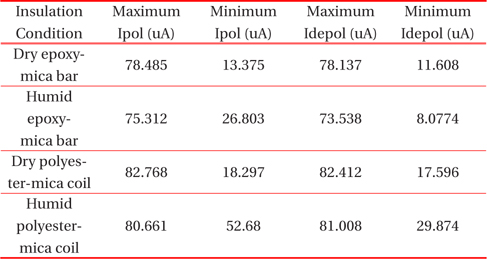
Machine insulation current for different condition.
3.4 Effect of moisture content and temperature on cable insulation
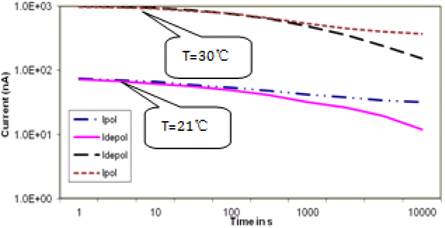
The analysis of PDC measurement for cables was done by researcher [4]. Figure 9 shows the polarization and depolarization current of 2 km XLPE cable, after 4 years in service at temperature 21℃, and 5 years later, after supplying fault current at temperature 30℃. It is observed that this ageing process leads to a very high polarization and depolarization current at temperature 30℃. This is a case of severe thermal aging. The high temperature indicates that the cable was ageing, and had a fault condition.
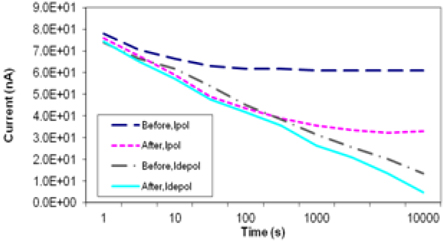
Figure. 10 shows the polarization and depolarization current of aged XLPE cable, before and after repair due to free water. It can be seen that conductive contaminants, especially free water, cause high conduction current. An improvement after repair is clearly seen from the result when the polarization and depolarization current is lower than before repair. The straight shape of I depol means either good cables or cables having problems with water, and one prominent crook of I depol refers to thermal aging (due to high load, fault, etc.) [4].
3.5 Conductivity of cable insulation
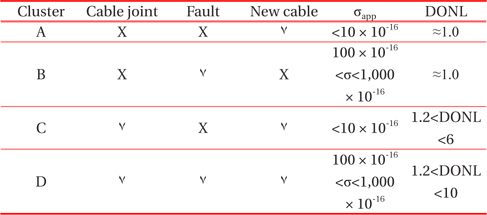
The PDC application to cable insulation was done by researchers [6,7]. Based on their papers, the tests were classified into several cable classifications, as listed in Table 2. Cluster A contains the newest cables with no joints, and some intermediate aged cables. Cables in Cluster B had failed, and had been repaired many times, but there was widespread degradation of the cable insulation. Cables in Cluster C contain one of the newest cables, with poor joint insulation quality. Cables in Group D appear to share the characteristics of cables in Groups B and C.
[Table 2.] Cable conductivity for different conditions.

Cable conductivity for different conditions.
The above table shows that cables with σapp > 10 × 10-16 S/m, and degree of nonlinearity DONL > 1.2 but < 2, could have joint and/or water tree problems. Cables with σapp < 10 × 10-16 S/m and DONL >1.2 but < 2, have high water tree density, where no tree bridges the insulation. Cables with σapp < 10 × 10-16 S/m and DONL < 1.2, are in good condition.
As the temperature increases, the apparent conductivity increases. This is due to insulation degradation with temperature, which refers to the ageing process.
PDC measurements can be used to determine the condition of HV insulation. The PDC measurement results presented suggest that higher moisture contents and other ageing conditions due to temperature dependence show higher conductivities and moisture content, of both solid and liquid insulations.
This paper reviewed and compared the results of PDC conductivity and moisture content, for transformer, cable and machine. From the comparison results, it concluded that the polarization and depolarization current results could be used to determine the conductivity and moisture content of solid and liquid insulation. Higher values of polarization and depolarization currents can contribute to higher conductivity and moisture content of insulation.

![Oil conductivity, oil properties, geometry, ageing and water content influence on the PDC-curves [18].](http://oak.go.kr/repository/journal/13464/E1TEAO_2014_v15n1_7_f001.jpg)


![Effect of paper moisture content on the polarization current, measured at 15℃ and 10℃ [13].](http://oak.go.kr/repository/journal/13464/E1TEAO_2014_v15n1_7_f003.jpg)
![Effect of paper moisture content on the depolarization current, measured at 20℃ and -10℃ [13].](http://oak.go.kr/repository/journal/13464/E1TEAO_2014_v15n1_7_f004.jpg)
![Variation of polarization currents with paper conductivity (a) σpaper=1.5 pS/m; σpaper=0.15 pS/m; σpaper=0.015 pS/m, and (b) σpaper=4.2 fS/m; σpaper=042 fS/m; σpaper=420 fS/m [16,20].](http://oak.go.kr/repository/journal/13464/E1TEAO_2014_v15n1_7_f005.jpg)
![Variation of polarization currents with different oil conductivity [17,22].](http://oak.go.kr/repository/journal/13464/E1TEAO_2014_v15n1_7_f006.jpg)
![Charge currents for epoxy-mica bars and a polyester-mica coil, before (dry) and after (humid), one week under a humid atmosphere [6].](http://oak.go.kr/repository/journal/13464/E1TEAO_2014_v15n1_7_f007.jpg)
![Discharge currents for epoxy-mica bars and a polyester-mica coil, before (dry) and after (humid), one week under a humid atmosphere [6].](http://oak.go.kr/repository/journal/13464/E1TEAO_2014_v15n1_7_f008.jpg)

![Polarization and depolarization current of 2 km XLPE cable, after 4 years in service (T=21℃), and 5 years later, after supplying fault current (T=30℃) [4].](http://oak.go.kr/repository/journal/13464/E1TEAO_2014_v15n1_7_f009.jpg)
![Polarization and depolarization current of aged XLPE cable, before and after repair due to free water [4].](http://oak.go.kr/repository/journal/13464/E1TEAO_2014_v15n1_7_f010.jpg)