Recently, the alternative energy industry has been actively developing to prevent the accelerated global warming due to the increase of CO2 creation. Performance improvements on wind power and energy saving devices in the hybrid automobile have been intensively processed focusing the consistency and efficiency of energy in the midst of developing the alternative energy industry. The battery industry including the lithium secondary battery has the tasks of consistent energy saving and supplementing of efficiency. Accordingly, the application of the electric double layer capacitor, an energy saving device with excellent stability that satisfies the requirement of stable energy density and output density has been increased.
The electric double layer capacitor is an energy saving device with middle positioned characteristics of condenser with high power and lithium secondary battery with high energy density. The electric double layer capacitor is an energy saving device that use the absorption and desorption reaction of physical ions differently from the lithium secondary battery. The electric double layer capacitor is composed of activated carbon electrode for physical absorption and desorption, porous membrane for separating, current collector for the channelling of electric flow charge and the electrolyte which provides the carrier of electric charge. The factor with the biggest influence on the performance of the electric double layer capacity is the carbon electrode and activated carbon with advantages of large specific surface area, chemical resistivity and low thermal expansion rate and high electric conductivity has been most widely used in industry.
The material for the commercial carbon electrode is obtained from natural materials such as wood, palm tree and petroleum pitch or cokes. Japan is positioned as leader of technology and the micro pore structure is formed inside the carbon by means of steam and alkali chemical processing at over 800℃. However, gas creation and capacity reduction have occurred in the current commercial activated carbon by using the hard carbon series material because the impurity contents are high.
The activation process for high power and high capacity with improved stability was optimized in this study by using the soft carbon series cokes with less impurity than the material for current activated carbon. Mainly the alkali activation process is applied in the production of high capacity activated carbon and the characteristics of specific surface area, pore structure, functional group and impurity contents differ with the process parameter such as activation temperature and using rate of the activation agent. The specific surface area and the pore structure influence the charging·discharging capacity of electric double layer capacity and it is reported that the surface functional group and the impurity contents influence the interfacial resistance and energy density of the electric double layer capacitor. It is known that the physical properties of such activated carbon have close relation with the output and stability of the electric double layer capacitor, but a systematic identification of the process parameter and correlation have not yet been made.
The process was optimized by applying various parameters of the activation process to the DOE experiments design and it was tried in this study to identify the correlation between the physical properties of activated carbon and the electrochemical characteristics of the electric double layer capacitor. The soft carbon series activated carbon with high power and capacity was made by controlling the specific surface area, pore distribution and forming of the surface functional group and impurity contents depending on the activation temperature and the mixing ratio of the activation agent and its electrochemical characteristics and physical properties were surveyed.
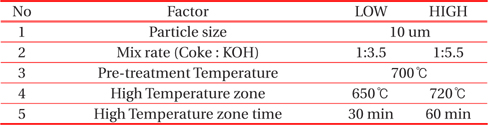
The optimization of the activation process was performed by means of DOE (Design Of Experiment), which is the statistical experiment method for activation process optimization to identity the influence of the activation parameters of soft carbon series cokes on the physical properties and electrochemical performance of the material. The screening DOE was performed to extract the core process parameters which influence the physical properties of the material. The experiment factor and level were set based on a literature study and experimental experience, and the key factors that make the biggest influence on the physical properties of the activated carbon were established through these (Table 1).
[Table 1.] Establishment of the activation condition.
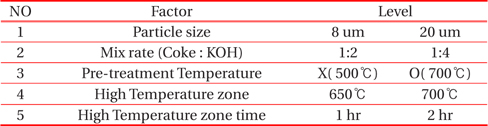
Establishment of the activation condition.
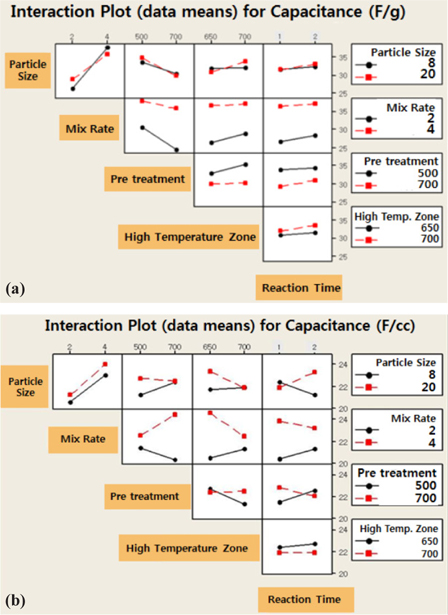
The interactions between every major effect are recorded in Fig 1. The analysis on the capacity per unit weight for the influence analysis factor showed that the mixing ratio of the activation agent and pre-treatment temperature made the biggest influence and the influence of the particle size of the material was very small. In the case of the capacity per unit volume, the influences on the pre-treatment and in the high temperature zone displayed the opposite trend to the capacity per unit weight. It was known through this tried that the heat treatment parameter was the key factor to have the biggest influence on the electrochemical characteristics.
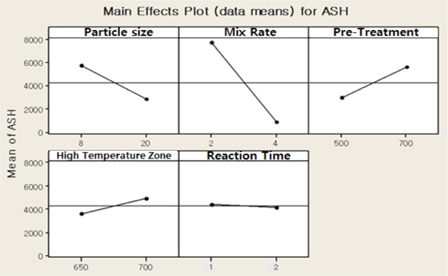
The mixing ratio of the activation agent influences the characteristics and impurity contents of the activated carbon. Impurity contents in the activated carbon are the key factor to influence the stability of the electric double layer capacity. The activation optimization results from the DOE (Design Of Experiment) considering the impurity contents are shown in Fig 2.
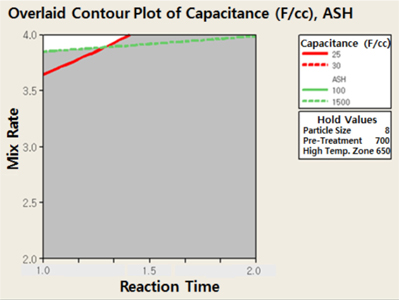
The experiment conditions were established as follows through screening on the optimization area in Fig 3. The experiment range was moved to the high mixing ratio, because the capacity per unit volume was higher as the mixing ratio increased. The optimized activation condition for the parts in high temperature was established to expand the experiment in higher temperature for checking the influence. The optimized activation condition is shown in Table 2. The conditions for moving the experiment range were to increase the mixing ratio of the activation agent in 10μm particle size to reduce the reaction time and to obtain a high capacity per unit volume in consideration of the production yield. The pre-treatment (heat treatment) was basically performed in every experiment.
[Table 2.] Optimum condition of activation from the DOE.

Optimum condition of activation from the DOE.
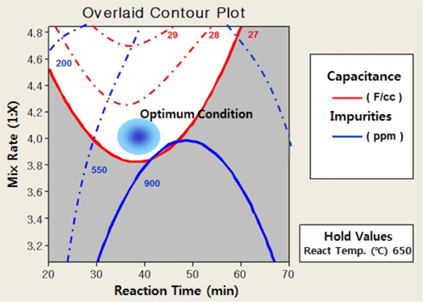
In order to observe the effect of the key factors of alkali mixing rate and activation time, the activation temperature was fixed. The impurities were reduced, as the activation agent mixing ratio increased, but the effect of the activated reaction time was very low. In the effects of the activation agent mixing ratio and the activation time, it acted positively in low activation temperature at 650℃. The DOE (Design Of Experiment) analysis on these three key factors displayed the optimum conditions for capacity per unit volume with an activation agent mixing ratio of around 4.0, low activation temperature and activation time of around 40 minutes (Fig 4).
The impurities which are a negatively influential factor exist on the surface of the activated carbon. Because of the chemical/physical reaction of impurities on the surface of activated carbon, gas will occur inside the electric double layer capacitor. Gas generation will impact the decrease of life of the electric double layer capacitor. In order to minimize the impurities the cleansing process condition was optimized. The optimization of the cleansing process was specified as 3 stages of dispersion, acid cleansing and distilled water cleansing which were performed to effectively remove impurities. The 1st dispersion process to effectively perform the 2nd cleansing process was performed by adding hydrochloric acid and it was checked that the optimum concentration was water: hydrochloric acid = 3:1. The 2nd cleaning process showed the highest impurity removing efficiency in water: hydrochloric acid =1:1. The 3rd cleansing using the pure distilled water was performed to remove the remaining impurities and acid solution after acid cleansing. Activated carbon with impurities under 1000ppm was obtained by performing the cleansing process on the activated carbon with the optimized cleansing process (Fig 5).
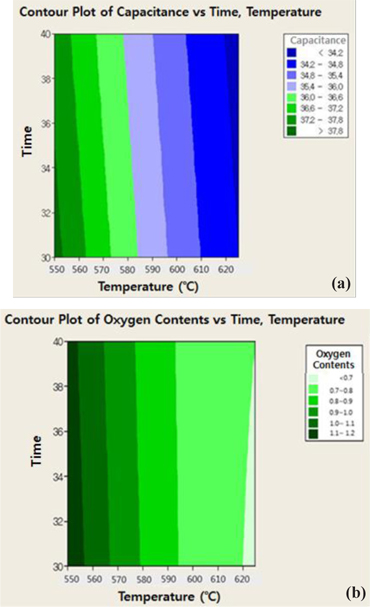
Additional optimization of the heat treatment process was performed to control the functional group on the surface of activated carbon with the completed cleansing process. The reduction of oxygen functional group on the surface of activated carbon is important as it is a factor influencing the long-term reliability and it can be controlled through the heat treatment process. The relation between the temperatures for additional heat treatment, contents of the oxygen functional group and the capacity per unit volume of activated carbon are shown in Fig 6. The decreasing trend of the oxygen functional group and increasing trend of the capacity per unit volume was shown as the temperature for additional heat treatment increased. But the factor of additional heat treatment time was not affected. It was optimized with characteristics under 1.0 meq/g for the oxygen functional group and over 35 F/g for the specific capacity in range of 570~590℃ for additional heat treatment.
3.1 Physical characteristics of the final activated carbon
The activated carbon was produced in optimized activation conditions of 4.0~4.5 for the mixing ratio, 650~700℃ for the activation temperature and 40 minutes of activation time based on the optimum activation condition set with the DOE. The production of activated carbon was performed with milling, pretreatment, activation, cleansing and additional heat treatment and KOH was used for the activation agent. The specific surface area and pore characteristics of the produced activated carbon were measured by the BET method through N2 absorption using BELSORP-mini II. The average particle size of the activated carbon was measured with Malvern PSA and the impurities were analyzed with XRF equipment. In addition, the oxygen function group on the surface of activated carbon was measured by means of the base neutralization method of Boehm.
3.2 Cell production and evaluation on the electrochemical characteristics
The electrode of the produced activated carbon was made by mixing activated carbon: conductive material: binder = 78 : 14 : 8 wt% using the conductive material, carbon black (Super- P) and CMC, SBR, PVP and PTFE which are binder. The electrode was made of slurry with viscosity 1,800 cps and the electrode with 100 μm and 125 μm thickness was made by coating on the Al foil surface which is the current collector using the comma roll type coater for drying in 120℃ in maximum. The coated electrode was cut to uniform size after heat pressing with 100℃ rolling press. The separator was inserted between the cut electrode and wound and the 10Φ cylindrical electric double layer capacitor was made. 1.0 mol TEABF4 (tetra ethyl ammonium tetra fluoroborate) /ACN (acetonitrile) (SK Chemical Co., Ltd.) was used for the electrolyte.
The capacity and resistance which are the electrochemical characteristics of the produced cell were measured by Potentiostat galvanostat PARSTAT 2273. The cyclic voltammetry test is an electrochemical experiment to observe the changing electric current depending on the voltage which is applied periodically to the membrane between the electrode and electrolyte. It was measured at 2.7 V operating volt and scan rate of 50, 100, 200, 300 mV/s. The membrane resistance of activated carbon was measured at 10 mHz ~ 100 kHz using the same cyclic voltammetry test equipment.
4.1 Physical properties of the activated carbon
Table 3 shows the result of the specific surface area and impurity contents of the produced activated carbon A, B and C made by activating under mixing ratio of activation agent of 4.0 and 4.5 and additional heat treatment temperature at 650 and 700℃ from the carbon series coke milled to 8μm of average particle size. Other factors were fixed with activation temperature of 650℃ and activation time of 40 min. The comparison analysis was made by using MSP-20, the activated carbon with high capacity which has been most widely used from Kansai Company and YP-50F with excellent impurity characteristics from Kuraray Company.
[Table 3.] Physical properties of activated carbon produced from the optimized process by DOE.
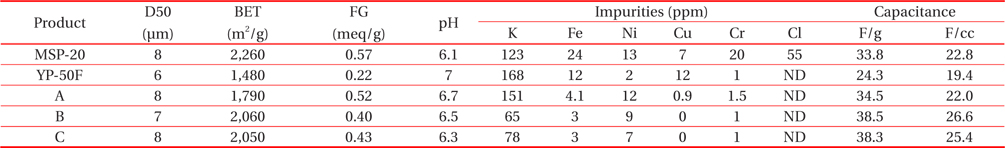
Physical properties of activated carbon produced from the optimized process by DOE.
The specific surface area of 1,800~2,100 m2/g for activated carbon A, B and C which were made by the optimum activation conditions was higher than that of YP-50F and lower than MSP- 20. The impurity was 60~150 ppm of K and activated carbon A displayed a lower impurity than YP-50F and higher than MSP- 20. Activated carbon B and C showed lower impurity than YP-50F and MSP-20. It was known from comparison of the measured results that the changing range of the specific surface area and impurity contents was increased by the activation agent mixing ratio rather than by the additional heat treatment temperature. In addition, in the case of the functional group on the surface of activated carbon measured by the Boehm test method, the membrane characteristics of electrolyte with activated carbon are expected to improve by adjusting the functional group. The functional groups of activated carbon B, C at 0.4 meq/g are lower than MSP-20 and higher than YP-50F.
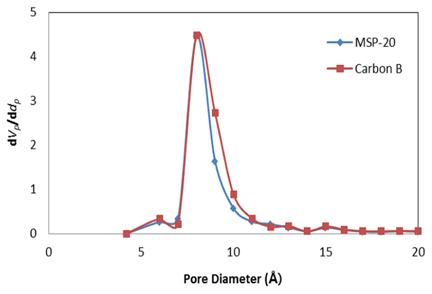
The pore size of activated carbon was checked using the MP method in BET. Micro pores of 5~15 Å were distributed on the activated carbon when it is observed in Fig 7. The micro pore volume is larger than that of MSP-20. It is expected that the formation of pores under 20 Å which is known as the pore size that is most influential to the electric charge moving on the activated carbon will make an influence on the improvement of the electrochemical characteristics of the electric double layer capacitor.
4.2 Electrochemical characteristics of the activated carbon
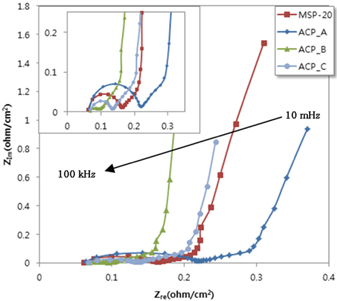
Figure 8 is the impedance of the electric double layer capacitor composed of activated carbon electrode which was made by the optimization process and MSP-20 and it was measured in the 10 mHz ~ 100kHz frequency range. The starting point of the Nyquist plot is a resistance due to the electrode material, electrolyte and the gap between the particles. It seems that it is the resistance of the electrolyte itself rather than the influence from the gap between the material and particle when it is considered that it was started from the same position.
A semi-circle in the Nyquist plot at high frequencies indicates contact between the activated carbon and current collector. The capacitors in ESR show clear semi-circles at higher frequencies, which could be due to decreased contact resistance between the electrode and current collector. The semi-circle end point of the Nyquist plot is 0.10 and 0.13 Ω/cm2 for activated carbon B and C which were lower than 0.16 Ω/cm2 for MSP-20. The electro double layer resistance was improved to increase the electron conductivity between the activated carbon surface and the pore. Decreasing the oxygen functional group of the activated carbon surface (Table 3.) affected the electro double layer membrane resistance at Fig 8.
The low frequency tail of the Nyquist plot is the ideal behavior characterized by a vertical line. The low frequency tail may arise from surface roughness, non-uniformity of the double layer thickness, a distribution in microscope charge transfer rates or adsorption processes. The characteristics of low frequency tail shows same slope in all activated carbon (Fig 8.). When the test results were looked into, it was checked that the electric charge moving and the improvement of ion diffusion characteristics were more effective at 650℃ than 700℃ at a mix rate of 4.5.
The electrochemical characteristics were evaluated by making the produced activated carbon A, B and C into 10 Φ cylindrical electric double layer capacitor. The specific capacity per unit volume and per unit weight of activated carbon A, B and C was measured and it was compared with MSP-20 from Kansai Company. The specific capacities of activated carbon B and C were over 38 F/g and 25 F/cc and they were higher than that of MSP- 20. Activated carbon B which showed the best characteristic in impedance also displayed the best in cyclic voltammetry.
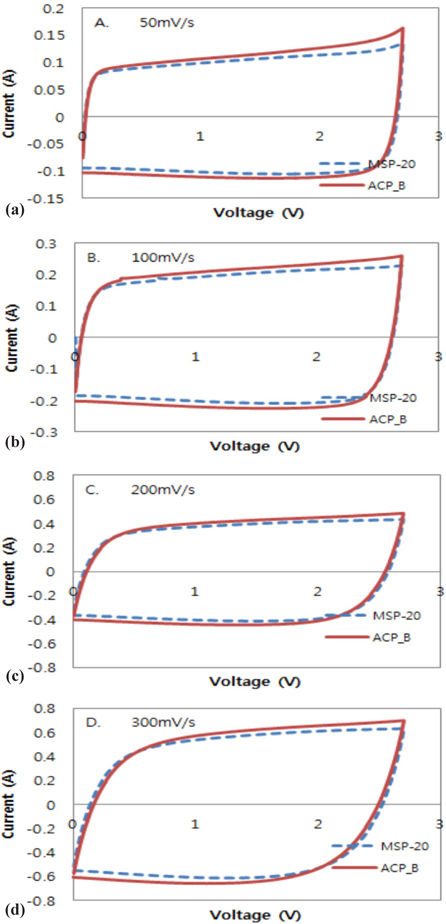
The unit cell was made by using activated carbon B with excellent resistance, capacity characteristics and the cyclic voltammetry test was performed. The circulating current test was made with scan rate of 50, 100, 200, 300 mV/s within the range of 0~2.7 V. The ideal cyclic curve of the electric double layer capacitor by cyclic voltammetry test is squared, but the cyclic curve in pattern out of this shape is due to the diffusion resistance inside the electrode pore created from the electric charge movement in charging and discharging and membrane resistance. The activated carbon B showed higher value than MSP-20 in the discharge flat electric potential of the cyclic curve which means that the electric capacitance and high discharging capacity was shown when the scan rate increased from 50 mV/s to 300 mV/s (Fig 9).
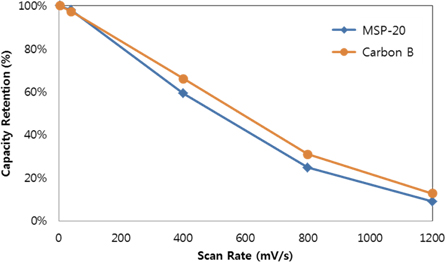
The improvement of output characteristic was achieved by improvement of the pore size, pore distribution, and pore shape. The 2nd key factor of the output characteristic is the electro double layer membrane which plays a role of transferred charge. The functional group on the activated carbon surface is one of the effective factors for the electro double layer membrane. To make sure of the effect of the output characteristic, the scan rate was increased to 1,200 mV/s. When the scan rate was increased to 1,200 mV/s, the capacity retention of activated carbon B was more effective than that of MSP-20 (Fig. 10). According to the results, it seemed that the specific capacity of activated carbon was improved as the membrane resistance was decreased due to the functional group on the activated carbon surface. Also the electrochemical characteristics increase in cycling behavior was due to the pore structure of activated carbon and improvement of the membrane characteristic.
The activated carbon production process from the soft carbon series coke by KOH activation was optimized with DOE [Design of Experiment] and the physical and electrochemical characteristics were confirmed by applying the activated carbon made with the optimized process using the organic electrolyte electric double layer capacity. (1)An activation agent mixing ratio of 4.5, activation time 40 minutes and low activation temperature of 650℃ were confirmed as the optimum condition to obtain high capacity characteristics per unit volume for KOH activation through the DOE. (2)The specific surface area of activated carbon and the characteristics of the impurities were more influenced by the activation agent mixing ratio and cleansing process than by the activation temperature, which was confirmed by making the activated carbon with specific surface area over 2000 m2/g and under 100 ppm impurity contents in the activation agent mixing ratio of 4.5.(3)The activated carbon B with electrochemical characteristics in 38.5 F/g, 26.6 F/cc, 0.10 Ω/cm2 was used to check the output characteristic of the activated carbon. The output characteristic of activated carbon B was improved by improving the pore structure on the activated carbon surface and the membrane characteristics.