Si-carbon composites as anode materials for lithium rechargeable batteries were prepared simply by mixing Si nanoparticles with carbon black and/or graphite through a solution process. Si nanoparticles were well dispersed and deposited on the surface of the carbon in a tetrahydrofuran solution. Si-carbon composites showed more than 700 mAh/g of initial capacity under less than 20% loading of Si nanoparticle in the composites. While the electrode with only Si nanoparticles showed fast capacity fading during continuous cycling, Si-carbon composite electrodes showed higher capacities. The cycle performances of Si nanoparticles in composites containing graphite were improved due to the role of the graphite as a matrix.
Graphitic materials have been used widely for anodes in lithium rechargeable batteries. Lithium intercalation and deintercalation between graphene layers are reversible, but the theoretical capacity of graphitic materials is limited to 372 mAh/g, because the lithium and carbon forms the LiC6 compound. To increase anodic capacity, various metals or metal alloys, which can form intermetallic compounds with lithium, have been used. Silicon ‘metal’ is also a candidate and its theoretical capacity could reach to ~4,200 mAh/g. However, the volume expansion, almost 300% by alloy formation with lithium, leads to capacity fading caused by particle cracking [1,2]. Recently, many researchers have sought to address these obstacles with Si by using porous structures, nanowires, and nanoparticles [3-5]. These problems can be reduced by using Si nanoparticles, which can be synthesized by sputtering [6], chemical vapor deposition (CVD) [7], and solution-phase reduction [8]. However, these methods have their own of drawbacks, such as particle aggregation, use of expensive apparatus, difficulties in mass production, and complex chemical reactions. An intermediate solution to these issues is the use of a composite, with small amounts of Si particles and graphitic materials. Yoshio et al. and Lee et al. reported that mixtures of commercial Si particles with graphite could be prepared by mechanical milling and showed good cycleability [9,10].
In this study, we prepared a silicon nanoparticle (NP)-carbon composite through a simple solution process. Si NPs were synthesized from the decomposition of silane (SiH4) through CO2 laser pyrolysis. Si NPs were deposited on carbon black or graphite by simply stirring in solution. The deposition of Si NPs on supporters was investigated in different solvents. Sicarbon composites as anode materials were characterized electrochemically for lithium intercalation and by surface morphology.
The synthetic process for the Si nanoparticles was as follows. Silane (SiH4, Aldrich) was added at a rate of 25 sccm into the chamber of a CO2 laser pyrolysis apparatus with hydrogen gas (100 sccm). Gases were irradiated by a CO2 laser (60 W power, 10.6 μm wavelength) and Si nanoparticles were produced by pyrolysis of the silane. This synthetic process was conducted by Korea Institute of Energy Research (KIER).
Si NP solution was prepared by the homogeneous dispersion of Si NP in methanol, tetrahydrofuran (THF), ethanol, and hexane, and then graphite (Posco Chemtech) or carbon black (Vulcan XC-72, Cabot) were added to the solution. To deposit the Si NP on the surface of the graphite (G) or carbon black (CB) particles, the solution was stirred overnight at room temperature. To obtain Si NP deposited on graphite (Si/G) or carbon black (Si/ CB), the solutions were then filtered and dried at 60℃ for 12 h.
The electrodes for electrochemical testing were prepared from a mixture of Si NP, Si/G, Si/CB or graphite with or without carbon (Super-P) containing polyvinylidene fluoride (PVDF; Kynar, Arkema Inc.) as a binder, as described previously [11-13]. Table 1 shows six kinds of electrode. First, all materials were mixed in NMP (1-methyl-2-pyrrolidone, Aldrich) and then cast on an Cu foil current collector (20 μm). The electrodes were dried at 120℃ under vacuum to remove solvents and stored in an Ar-filled glove box. Electrochemical measurements were carried out on CR 2032 coin cell (Hoshen) that was assembled in the glove box. The electrolyte was 1.0 M LiPF6 in a mixture (1:1:1) of ethylene carbonate (EC), ethyl methyl carbonate (EMC), and dimethyl carbonate (DMC; Techno Semichem). The coin cells were assembled with lithium foil (Aldrich) as a negative electrode and a polypropylene separator (Celgard 2400). The charge and discharge tests were performed using a battery cycler (WBCS3000, WonAtech) in the voltage range of 1.0~0.01 V (vs. Li/Li+) at room temperature. After cycling, the electrodes were washed in DMC for XRD and SEMEDS analyses.
The crystal structures of the samples were assessed by X-ray diffraction (XRD, PANalytical, EMPYREAN) with Cu Kα radiation. The sample morphology and the chemical composition were analyzed using transmission electron microscopy (TEM, Techni) and a field emission scanning electron microscope (FE-SEM, Hitachi, S-4800) with energy dispersive X-ray spectroscopy (EDS, Horiba, EX-250). To evaluate Si contents in the composites and oxygen content in Si NP, thermogravimetric analyses (TGA, TA Instrument, SDT Q600) were conducted in an air atmosphere.
Figure 1 shows TEM and SEM images of Si NP and graphite powders, showing < 10 nm and ~ 10 μm particle sizes, respectively. On the TEM image, it can be seen that Si NPs have an almost amorphous structure. Si NPs were dispersed homogeneously in methanol, THF, ethanol and hexane, and mixed with the graphite or carbon black powders. Some of the Si NPs were then physically adsorbed on the surface of the graphite.
The Si NPs showed different dispersion behaviors in different solvents. SEM images of Si NPs on graphite powders are shown in Fig. 2. Si NPs in composites prepared in hexane and methanol (Fig. 2(d) and (a)) were agglomerated but those prepared in ethanol (Fig. 2(c)) were not much deposited on the surface. With THF as the solvent, the Si NPs were better dispersed than with the other solvents.
The oxidation state of Si NP (oxygen content) was calculated from TGA, which measured the weight increase in an air atmosphere at 900℃. It can be presumed that the Si NPs (SiOx) were converted to SiO2 by a reaction with the oxygen in the air and that the weight increase originally came from the incorporation of oxygen. As shown in Fig. 3, the weight of Si NP increased, up to 214.6%, at 900℃ in the air. From this, the chemical composition of the Si NPs was SiO0.0014.
Also, the Si content in Si-carbon composites was measured by TGA, also conducted in an air atmosphere at 900℃. As shown in Fig. 4, the carbon black or graphite in the composite can be burned off at around 675℃ and Si oxide remained. Tables 1 and 2 list the Si loadings in various electrodes and composites. As shown in Fig. 2, the amounts of the Si loadings in the composites prepared from methanol and ethanol were very low compared with those prepared from THF or hexane. Because oxygen may cover the surface of Si NP, by oxidation in air, solvents containing oxygen may prevent an interaction between Si NPs and graphite powders because they cover the surface of Si NPs as a result of their hydrophilic properties.
[Table 1.] Electrode configurations.

Electrode configurations.
[Table 2.] Weight percentage and loading ratio of Si NP for Si deposited on graphite.

Weight percentage and loading ratio of Si NP for Si deposited on graphite.
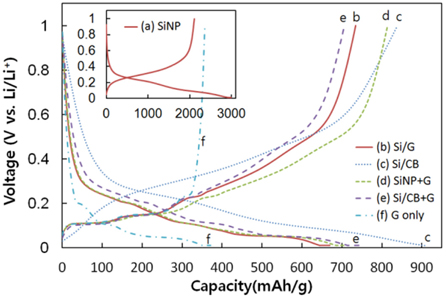
Figure 5 shows voltage profiles of Si-carbon composites and Si NP electrodes for the second cycle. Chg/dchg capacities of the Si NPs (Fig. 5(a)) were 3,000 and 2,110 mAh/g at the second cycle, and Coulombic efficiency was 70%. Si NPs with < 20 nm size have shown capacities of 2,000~3,500 mAh/g in many reports [14-16]. Also, graphite (Fig. 5(f)) shows a capacity of 356 mAh/g, which is close to the theoretical capacity. All composites showed capacities of more than 700 mAh/g regardless of preparation method. The composites with graphite showed typical plateaus, assigned to lithium intercalation and deintercalation into/from the graphene layers [17]. This may indicate that both the Si NPs and graphite maintain their own properties in the composites.
Figure 6 shows cycle performances of Si NP and Si-carbon composite electrodes. Figure 6(b) shows capacities of Si only, except for graphite in the composites which were calculated assuming graphite in the composite had its theoretical capacity (372 mAh/g), because the capacity of graphite in Fig. 6(a) was close to the theoretical value. The inset in Figure 6(a) shows the cycle performance of the Si NPs. After 50 cycles, the capacity of Si NP decreased rapidly to 170 mAh/g, which is similar to the behavior of other Si NPs [18-20]. The cycle performance of Si NP could depend on be subject due to the binder and additives in the electrolyte [21,22]. Capacities of the composites decreased rapidly until 20 cycles and then diminished more slowly. All composites except for Si/CB show a little higher capacity than the graphite, while Si/CB shows similar capacity fading to that of Si NP. In Fig. 6(b), the capacities of Si NPs alone showed that the Si NPs in composites played a significant role. When Si NPs were incorporated with the graphite, their capacities were almost two times higher than those with the carbon black or alone. SEI layers could cover the surfaces of the Si NPs, when they were formed on the graphite. These layers may be smoother than that on Si NP or Si/CB electrodes. Yin et al. also observed similar results. They reported that the graphite powders had a role as a buffer and matrix for the Si NPs during lithium intercalation and deintercalation, and the mechanical stability of the composite was increased [23]. Yang et al. disclosed that the coarse composite powder exhibited higher capacity and better cycle stability than the fine one [24]. They revealed that Si particles were easily detached from a carbon matrix, such as carbon black. Similar to other research, our composites also showed better cycle performance than Si NP and Si/CB alone.
Initial capacity, ICL (irreversible capacity loss), and capacity retention after 50 cycles for various Si-carbon composites are listed in Table 3. ICLs for Si NP, Si/G, and Si+G were 26.0, 27.3, and 23.4% whereas those for Si/CB and Si/CB+G were 52.7 and 32.7%, respectively. Composites containing CB showed higher ICL than others because of the high surface area of the carbon black. Except Si NP and Si/CB, composites containing graphite showed around 60% capacity retention after 50 cycles. As graphite has 100% capacity retention, those of Si NPs in composites with graphite were much higher than the others.
[Table 3.] Summary for cycling of Si-carbon composite and Si NP electrodes.
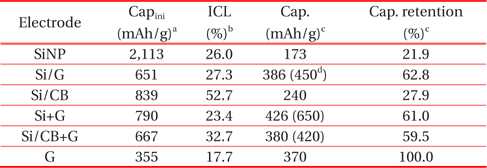
Summary for cycling of Si-carbon composite and Si NP electrodes.
After 50 cycles, coin cells were disassembled to assess the reasons for capacity fading. Si NPs were not detected by XRD analysis because of their amorphous structure (data not shown). It was hard to observe changes in surface morphology of composites after cycling in SEM images (data not shown). Chemical compositions of composite electrodes for carbon and Si are listed in Table 4. The carbon ratio in Table 4 includes carbon black, graphite, polymer binder, and small amount of residue for the electrolyte. Generally, the proportion of carbon to Si was increased after cycling. Si NP may become detached from the carbon support by volume expansion during cycling. This may be why composites showed continuous capacity fading.

Weight percentage of carbon and Si in composites before and after cycling, measured by EDS.
Si nanoparticles were deposited on the surface of carbon black or graphite in solutions. Si nanoparticles were well dispersed and deposited on the surface of carbon in tetrahydrofuran solution. Si NPs showed more than 2,100 mAh/g of capacity at the second cycle. All Si-carbon composite anodes showed above 700 mAh/g of initial capacity, higher than that of graphite (370 mAh/ g). Composites (Si/G, Si+G, and Si/CB+G) containing graphite showed ~60% capacity retention after 50 cycles, although Si NP and composite containing carbon black exhibited 22 and 28% retention, respectively. Lithium intercalation and deintercalation of Si NPs in the composites were improved, by as much as twofold, by the presence of graphite due to the role of graphite as a matrix, in comparison with Si NPs only and Si/CB electrodes.