An all-reflective, simple noncollinear second harmonic (SH) autocorrelator is described for monitoring the shot-to-shot behavior of ultrashort high-power laser pulses. Two mirrors are used for the dispersion-free splitting of a pulse into two halves. One of the mirrors is able to adjust the delay time and angle between two halves of the laser pulse in a nonlinear crystal. We present the possibility of real-time measurement of the pulse duration, peak intensity (or energy), and the pointing jitters of a laser pulse, by analyzing the spatial profile of the SH autocorrelation signal measured by a CCD camera. The measurement of the shot-to-shot variation of those parameters will be important for the detailed characterization of laser accelerated electrons or protons.
With the development of chirped pulse amplification (CPA) [1], high peak intensity on the order of terawatts in a tabletop femtosecond lasers can be easily accessible in many laboratories, resulting in the rapid developments of related research. In characterizing the physical phenomena in different applications, the real-time measurement of ultrashort high-power laser pulses becomes an issue. For example, in laser-induced acceleration of charged particles the parameters of an ultrashort laser pulse and the plasma it generates are a measure of the quality of laser accelerated particles. The shot-to-shot variation of a charged particle beam especially is an obstacle to using laser accelerators as a radiation source or an injector for other applications, and as a result a detailed characterization involving the jitters of ultrashort laser pulses is inevitable.
The intensity autocorrelation method [2, 3], is the simplest and most fundamental approach for measuring the durations of ultrashort pulses. In the 1990, the complete characterization of electric fields with reasonable accuracy was successfully accomplished with frequency-resolved optical gating (FROG) [4, 5] and spectral phase interferometry for direct electric field reconstruction (SPIDER) [6, 7]. Those methods can measure both the phase and profile of a laser pulse in time, but with elaborate alignment and iterative phase retrieval algorithm. For intense femtosecond lasers with low repetition rate, a single-shot autocorrelator based on non-collinear second harmonic generation (SHG) [8, 9] can measure the pulse duration in real-time, by transferring the time profile to a spatial profile in a CCD camera. Most modern techniques, including SHG-FROG, GRENOUILLE, and SHG-SPIDER [10], should consider the elongation effect due to the group velocity dispersion in dispersive optics. To suppress the dispersion problem in ultrashort pulse measurements, an all-reflective autocorreleator has been demonstrated [11-13], but these systems, even commercially available ones, are based on the scanning interferometric method using a photodiode detector, which is not proper for real-time characterization.
We suggest instead using a simple, single-shot noncollinear second harmonic (SH) autocorrelator combined with all-reflective split mirrors and a CCD camera, and have performed experiments to investigate the shot-to-shot variation of intense laser pulses, which is an important parameter in characterizing laser-accelerated charged particle beams. In our experiments, the pointing jitter of a laser was simultaneously observed in addition to the pulse duration and peak power. Even though it gives only the pointing jitter in one direction, either horizontal or vertical, it may give information about the pointing stability of a laser-accelerated electron beam. This real-time measurement system can be utilized in any applications using laseraccelerated charged particles (for example, electron or proton therapy) to estimate the beam parameters.
II. SYSTEM FOR AN ALL-REFLECTIVE SINGLE-SHOT AUTOCORRELATOR
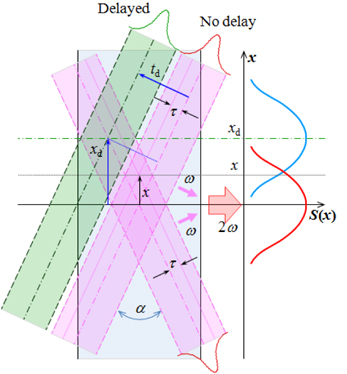
The basic idea of a single-shot non-collinear SH autocorrelation method is to transform the temporal profile of the original pulse into a spatial profile of a second harmonic pulse in a nonlinear crystal, so that a CCD camera can see the entire temporal trace of a single pulse. The SH signal is generated along the bisector of the incident angle between two split beams entering a nonlinear crystal, satisfying the phase-matching condition for SHG. The important conditions are that the spatial distribution of the original pulse should be smooth and wide enough compared to the pulse length. The diameter of the incident pulse should be greater than three times the longitudinal pulse length.
Assuming that the intensities of two incident pulses are spatially uniform and identical, the SHG at a point
For a given pulse duration, a smaller incident angle generates a wider spatial profile of the SH signal. The spatial intensity
where
and thus
where Δ
for which the pulse duration at FWHM Δ
Here,
This can give valuable information in the analysis of the physical phenomena of laser-induced acceleration, since there is no tool to measure the peak power or pulse energy of ultrashort, intense laser pulses in real time. Even though the pulse profile is not an exact secant shape, it is close enough for investigating the contribution of the laser parameters to the generation of laser-accelerated charged particles.
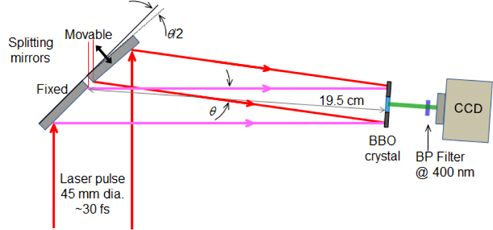
Figure 2 shows a schematic of the all-reflective singleshot autocorrelator. The input beam is spatially split along the y axis into two halves by two rectangular Al-coated mirrors which are separated by a narrow gap
The nonlinear crystal is a 50 μm-thick BBO crystal (10×10×0.05 mm3) which is thick enough to measure a pulse duration of ~50 fs. The angle
The KAERI 30 TW laser system, comprised of an oscillator, stretcher, pre-amplifier, and second and third amplifiers, can provide a pulse of 1.1 J and 300 ps collimated to ~45 mm in diameter at the entrance of the compression chamber [14, 15]. The pulse compression using two of 2×2 inch2 diffractive gratings can be optimized by adjusting the distance between the gratings. A compressed beam of ~25 fs in duration and ~45 mm in size is delivered to the all-reflective single-shot autocorrelator.
Two input beams that are spatially split are identical longitudinally, but not spatially. It is important to use a strongly collimated beam to avoid any modification of pulse duration due to spatial intensity variation. In our case, the contribution due to spatial intensity variation is negligible since the intensity change for the overlapping portion (2∆
Experimental measurements for demonstration were initially performed in the atmosphere after the compressor using a laser beam with pulse energy of 35 mJ. After the performance test of the all-reflective single-shot autocorrelator in the previous section, the pulse compressor was adjusted for the shortest pulse duration before measuring the shot-toshot variation. The photodiode signal measured before the compressor was used as a reference to compare the shot-toshot variation of pulse intensity or energy after the compressor which can give information about shot-to-shot fluctuation of pulse intensity or energy, but not the absolute values. The background due to the SH signal generated only by one half-pulse is subtracted to measure the pulse duration, and the temporal pulse profile is assumed to be a sech2 function, suitable for the 30-TW femtosecond laser at KAERI.
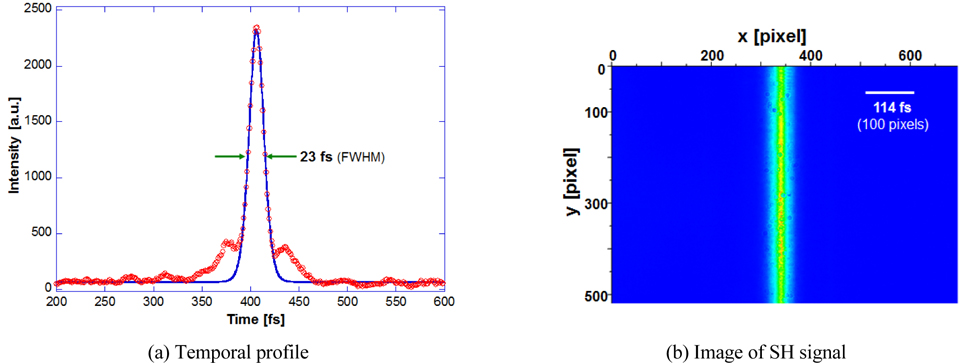
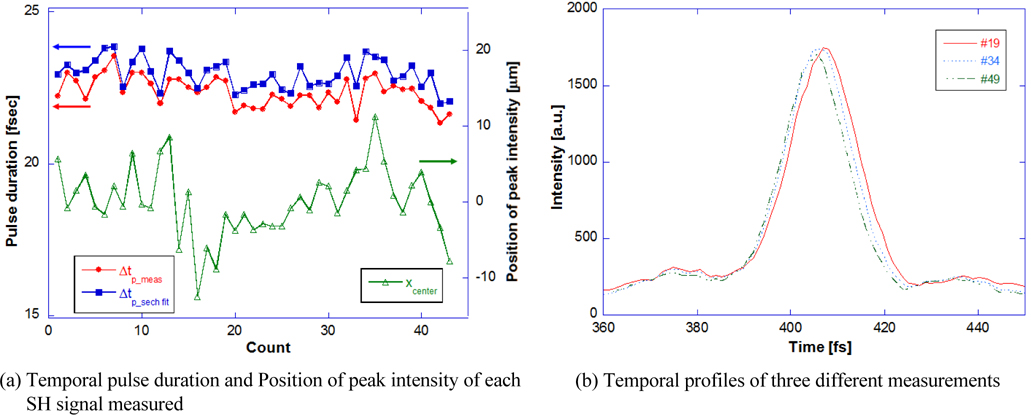
Figure 3(a) shows the measured SH signal after background subtraction (red open circles) and the fitting curve (blue solid line). Figure 3(b) is a typical image of the SH signal captured by the CCD camera. The average pulse duration is 22.4 fs (FWHM) with a standard deviation of 2.2% as measured from the raw data (red solid circles), and 23.0 fs with 2.1% standard deviation as obtained from the fitted curve (blue solid squares), as shown in Fig. 4(a). The slight increase in pulse duration for the fitted curves is mostly due to the appearance of side wings in the SH signals, which could be suppressed by optimizing the alignment of the stretcher and compressor.
It was found that the peak position of the SH signals, as shown in Fig. 4(a) (green open triangles) and Fig. 4(b), changed independently of pulse duration or intensity. The graphs in Fig. 4(b) are three selected SH signals with similar intensities, showing the shot-to-shot variation in pulse duration and peak position. In our splitting configuration, neither the time jitter nor the temporal profile variation can change the peak position of the SH signal; the change seems to be caused by the pointing instability of the main laser. From the geometrical configuration, a pointing angle shift of 1° will change the coincidence point of two halves in time by 3.4 mm in space at the nonlinear crystal. The maximum shift observed is 24 μm, which corresponds to 125 μrad after the compressor, and the pointing jitter in the horizontal direction is about ±24 μrad in the standard deviation. The pointing jitter of a laser pulse at the target gives some information about the pointing stability of a laser-accelerated electron beam.
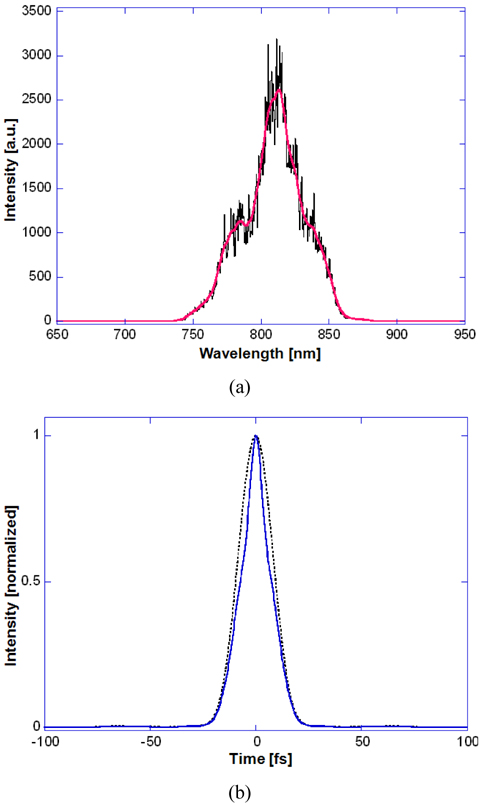
The spectral width Δλ of the laser pulse after compression was measured to be ~54 nm (FWHM); see Fig. 5(a). The pulse duration from Fourier transformation (FT) of the spectrum is much shorter than the measured one due to the assumption of zero phase difference, but the shape is closer to the secant function, as shown in Figure 5(b). With the measured pulse duration of 23 fs for a sech2 pulse shape, the value of the time-bandwidth product Δ
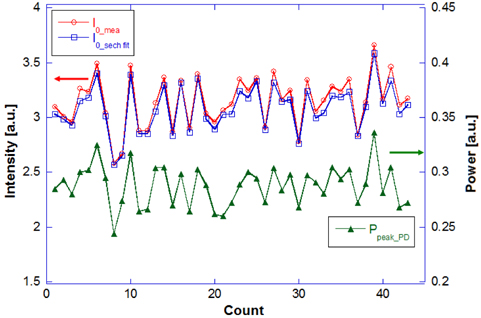
To demonstrate the possibility of measuring energy or intensity jitter, simultaneously with pulse duration using the single-shot non-collinear SH autocorrelator, the SH signals after the compressor were compared to the photodiode signal measured before the compressor. The intensities and energies of the laser pulses from the SH autocorrelator are obtained by fitting Eq. (5) and Eq. (6) to the SH signals, respectively. The shot-to-shot variations measured by the single-shot autocorrelator and the photodiode are in good agreement, as shown in Fig. 6. This result indicates the possibility of real-time monitoring of both pulse duration and energy (or intensity) using the all-reflective single-shot SH autocorrelator. The jitters in intensity obtained from the single-shot SH autocorrelator and the photodiode are 6.9% and 6.5% respectively. The jitters in pulse energy increase to 7.8% and 7.3% respectively, indicating that the jitters in pulse energy and duration are not correlated.
In summary, an all-reflective single-shot autocorrelator developed to measure the femtosecond pulse-width of a 30 TW high power laser can be a good tool for measuring or monitoring the real time variation of pulse duration and intensity and simultaneously the pointing jitter. For our laser, the shot-to-shot variation in peak intensity, 7%, dominates the jitter in pulse duration, 2.2%. This result shows that the position jitter has no correlation with pulse duration or intensity. The expected focal-point shift is roughly ±3 μm for a focal length of 300 mm and shifted pointing angle of ±10 μrad. This may be good enough for proton generation using a metallic target, but not for electron generation via acceleration through the plasma channel of a gas target, resulting in the degradation of the pointing stability of electron beam. The all-reflective singleshot autocorrelator may be used to characterize the performance of laser accelerations.