We present a novel bandwidth measurement scheme for multimode optical fibers. Amplified spontaneous emission (ASE) radiation was utilized for a source of intrinsically modulated light with a wide modulation bandwidth. In our measurement scheme, the continuous-wave (CW) ASE light that passed through a multimode fiber (MMF) under test was analyzed by the fourth-order power with a high-speed photodetector and an electric spectrum analyzer. The modulation transfer function of the multimode fiber could be directly measured with the photoelectric spectra in the modulation frequency domain. The measurement result of our method was experimentally compared to that of the conventional measurement scheme based on the impulse response measurement. It has been found that our scheme provides a stable measurement means of MMF characterization that is suitable for the field testing due to the simplicity of the system.
The multimode fiber (MMF) technology is widely used in short-haul optical networks such as a local-area network (LAN) or a peripheral network [1, 2]. In those optical communication systems, the typical length of the MMF links is a few hundreds of meters or shorter with usual bit rates of 1 to 10 Gbps. The MMF class has relative advantages of larger tolerances in fiber connection and the availability of the high-speed vertical cavity surface emitting lasers (VCSELs) that are better suited to the MMF [1-3]. Accurate evaluation of the MMF performance is indispensible in designing such a system. In contrast to the single-mode fibers (SMFs) where the group-velocity dispersion (GVD) limits the maximum data rates, the chromatic dispersion plays little role in the MMF. It has a plurality of guiding modes that propagate at different group velocities with characteristic intermodal delays [4-6]. The link performance of the MMF can be properly described by the modulation bandwidth which is the frequency-domain measure of the intermodal dispersion. For this, several methods of the MMF bandwidth measurement have been developed and widely used in evaluation of the manufactured MMF cables as the standard methods [5, 6]. It is worth stressing that each MMF cable even from a single preform needs to be evaluated in MMF bandwidth for reliable and predictable transmission performance [2]. By the nature of the MMF, a slight deviation of the refractive index profile can critically affect the modal dispersion in a sensitive manner.
It has been found that a number of factors can affect the actual bandwidth performance of the installed MMF link, not to mention the non-uniformity of the index profile along the fiber axis [4, 6, 7]. The light launch condition, operation wavelength, quality of splices or connectors, fiber bends and polarization states may considerably influence the actual bandwidth of the MMF link because they determine or change the mode power distribution and, consequently, influence the effective intermodal delays. This brings the needs for evaluating the bandwidth performance of the MMF links after the fiber has been installed in the fields. Particularly, field testing is highly demanded in upgrading the installed fiber networks for higher speeds when the information on the old MMF is insufficient. However, the current technologies used for the MMF bandwidth measurements do not provide desired simplicity and can rarely be used in field testing. Furthermore, as the MMF-based networks have evolved to Gigabit or 10-Gigabit systems, the MMF links in the fields usually have very wide bandwidths above several GHz’s or higher [1]. It is technically more challenging than measuring long sections of manufactured MMF cables. A new bandwidth measurement method is demanded with a simpler system configuration and a wider effective measurement bandwidth, definitely above 10 GHz.
In this report, we present an MMF bandwidth measurement scheme that significantly simplifies the system configuration and the related maintenance issues. Our scheme uses a low-cost light source of amplified spontaneous emission (ASE) and a popular radio-frequency (RF) measurement instrument of the electric spectrum analyzer (ESA). Our scheme utilizes the ASE light that intrinsically exhibits random fluctuations of intensity which are determined by the optical spectrum. Due to the wide bandwidth along with the nearly uniform spectral characteristic of the ASE, the transmission characteristic of the MMF can be analyzed with ease by obtaining the photoelectric spectrum detected at the output of the MMF under test. Used in the MMF bandwidth measurement, the practically unlimited bandwidth of the ASE light minimizes the needs for careful calibrations of the light source and the concerns associated with the unwanted deviations. In this work, we successfully demonstrated the MMF bandwidth measurement and compared the result to that of the conventional scheme based on a short-pulse laser. It has been found that our scheme of the ASE-based MMF bandwidth measurement provides a simple and powerful test tool with a good measurement reliability, which will be useful in the field testing of MMF bandwidth as well as for a generic evaluation technique of the MMF cables.
The MMF bandwidth quantifies the modal dispersion that the lightwave signal experiences due to the intermodal delays of the mode-dependent group velocities [5]. Neglecting the chromatic dispersion effect that occurs for each mode, the transmitted signal is broadened in accordance with the modal characteristics. A signal input at an end of MMF is denoted by
where
where
The bandwidth of an MMF partially depends on the light launching condition that determines how the modes are excited. In Eq. (3), it can be represented by the mode power distribution of
Based on the theory of modulation transfer, the MMF bandwidth can be analyzed in either time domain or frequency domain by utilizing a light source of a wide modulation bandwidth [5]. The most popular scheme of the MMF bandwidth measurement is to obtain the impulse response in time with impulse-like short pulses. In an alternative approach, the transfer function can be directly obtained in frequency domain by using a light source modulated sinusoidally with a variable frequency. In both methods, the technical difficulty may arise in the source calibration because the modulation spectrum of the source is not uniform over the whole measurement frequency range and its bandwidth is finite. The modulation bandwidth of those light sources such as a gain-switched diode laser or an intensity modulator-equipped laser gives a few tens of GHz’s at best. Thus, the reliability of the measured result crucially depends on the stability of the modulated light source and the calibration accuracy, especially when the measurement range is wider than 10 GHz.
In this research on the MMF bandwidth measurement, we utilized an ASE light in continuous-wave (CW) operation instead of using a modulated light source. The ASE light consists of continuously distributed spectral components of random phases which produce cross-beating products also known as the relative intensity noise [8]. The modulation spectrum after the down-conversion process of a squarelaw detector can be found by the autocorrelation function of the optical spectrum. Hence, the modulation bandwidth of the ASE is as wide as the optical bandwidth of the spectrum. A very stable modulation characteristic can be obtained when the spectrum is determined by a passive element of an optical filter. Then, the modulation transfer function of an MMF can be obtained by comparing the modulation spectra measured at the different ports of the MMF under test.
The principle of our measurement scheme may need a theoretical justification. The intrinsic intensity modulation of the ASE fields has a different nature from the modulated lightwaves such as a pulsed laser or externally modulated light. It is not automatically accepted that the intensity-modulated contents of the ASE are temporally dispersed in the same way as those of the modulated lightwave signals. A suitable description of the ASE light fields that pass through an MMF is obtained from the
The MMF multi-path inevitably brings an uncontrolled variation of the polarization states and path length fluctuations which may sensitively affect the output fields in conjunction with mode coupling or intermodal interference. The spectral intensity interferometry suggests that, regardless of the field-sensitive process, the fourth-order power spectrum of the resultant field at the multi-path output conveys only the intensity-involved information [8]. This convenience is obtained by a narrow bandwidth of the ASE which must be less than 1/4 of the center frequency of the optical spectrum. The usual ASE light sources surely fulfill this narrow-band condition. Therefore, the photoelectric power spectrum of a photodiode, which is the forth power of the ASE field, is independent of the field-sensitive interference that occurs in the MMF.
Interferometric measurement of the intermodal delays or the modal dispersion of an MMF is not a completely new concept. It has been revealed that the optical frequency-domain reflectometry or the spectral interferometry can measure the modal characteristic in an interferometric configuration [9-11]. However, those second-order interferometers sense the field-sensitive interference so that they are naturally vulnerable to the phase and polarization variations of the modes. Despite some attractive features of the second-order interferometry, the result is hardly translated to the MMF bandwidth without
A more detailed description on our ASE-based measurement method is presented here to clarify the operation principle. Any lightwave of
From Eq. (3), the transfer function of the MMF is derived to be a sum of the transformed delta functions as by the property of the Fourier transform with the mode index
In this investigation, we constructed an ASE-based MMF bandwidth measurement system with an ASE light source and an electric spectrum analyzer. The measurement result was compared to that of the conventional method based on a short-pulse laser. Figure 2 shows the schematic diagrams of the filtered-ASE source (a), our ASE-based MMF bandwidth measurement system (b), and that of the pulse-based measurement system that we used for comparison. As shown in Fig. 2(a), a semiconductor optical amplifier (SOA) produced ASE light and also re-amplified the ASE back-reflected by a fiber-optic reflector for a higher intensity. After an optical isolator, a band-pass filter (BPF) was installed to reduce the optical bandwidth to 20 nm, centered at 1,310 nm in wavelength. The intensity was adjusted with an optical attenuator. All the fiber-optic components in the source part used single-mode fiber for interconnection.
In our measurement system described in Fig. 2(b), the ASE light fed by the source part went through a conditioning MMF for mode scrambling. A series of perturbations including bends and offset splices were applied to the conditioning MMF of a high-NA step-index fiber. The mode-scrambled light was launched to a fiber under test (FUT), a graded-index MMF designed for optical communications, through a fiber connector. A photoreceiver connected to the FUT converted the received intensity signal to the photocurrent and fed it to an electric spectrum analyzer(E4440A, Agilent Technologies Inc.) that acquired the power spectrum of the photocurrent. The photoreceiver used in the system equipped a high-speed photodiode and an internal amplifier with a combined bandwidth of 11 GHz. For comparison, the conventional impulse response measurement system was constructed by using the same mode scrambler and photoreceiver. A gain-switched laser diode of distributed feedback (DFB) laser was used for the short-pulse source while a wideband sampling oscilloscope (DCA86100A, Agilent Technologies Inc.) acquired the received time-domain response. The center wavelength of the DFB laser was 1310.3 nm with a pulse repetition rate of 10 MHz. In both methods, the back-to-back measurements were performed separately to obtain the system characteristic while no FUT was in place.
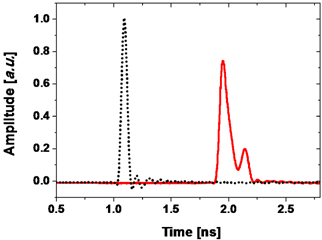
A 550-m long MMF of core diameter 62.5 μm was used as the FUT. The impulse response measured with the system described in Fig. 2(c) showed the intuitive picture of the intermodal delays. Figure 3 shows the acquired impulse response of the MMF (solid line), displayed with the system response measured in the back-to-back condition (dotted line). The measured pulse width of the system response was 55 ps in full width at half maximum (FWHM) for the dotted line of Fig. 3. In the impulse response of the MMF, the clearly observed two peaks suggested that the modal delays were distinguished by two mode groups while each group was dispersed slightly. The Fourier transforms of the responses gave the transfer function of
Our ASE-based measurement system described in Fig. 2(b) directly acquired the power spectrum with the spectrum analyzer. The same FUT was used while the optical power incident onto the FUT was adjusted to 0.5 mW. Figure 4 shows the screen-captured image of the electric spectrum analyzer with three traces: the noise level acquired with no optical input (A), the spectrum measured while the FUT in place (B), and the spectrum without the FUT in the back-to-back condition (C). The decrease of the spectrum C was caused by the limited bandwidth of the photoreceiver which affected commonly both of the photoelectric spectra of B and C. Note that the acquired spectral data were all on the power of the photocurrent or the fourth-order power of the light fields. The optical intensity spectrum could be obtained by taking the square root of the acquired electric power. The transfer function could be obtained in this way. Instead, for minimization of the noise effect, an alternative formula was used which is given as where
Figure 5 shows the normalized transfer functions measured by the two methods of our ASE-base measurement (solid line) and the impulse response measurement (dotted line) for the 550-m MMF sample. Each was normalized so that the amplitude at frequency zero or the vicinity became a unity,
The measurement repeatability was tested for the two methods. From the data obtained by five successive measurements performed in the same condition, a statistical deviation of the measured transfer functions was evaluated for each method. The interval between the consecutive measurements was ~60 seconds. A single back-to-back measurement was performed to obtain
Figure 6 shows the spectral standard deviation of the repeated measurements for the case of the ASE-based system (solid line) and that of the impulse response measurement system (dotted line). Spending similar acquisition times, our ASE-based measurement system exhibited significantly lower deviations especially for the high-frequency region above 10 GHz. The rapid increase of the error in the impulse response measurement could be explained by the limited bandwidth of the system response. Figure 7 shows the spectrum of the system response,
By using our ASE-based system, measurements of a short fiber section were also performed with a 100-m MMF that originated from the same fiber spool. Figure 8 shows the normalized transfer functions obtained by five successive measurements for the 100-m MMF. Very small deviations were observed over the whole frequency range up to 15 GHz. The 3-dB bandwidth was evaluated to be 15 GHz or slightly higher, which makes a bandwidthlength product of ~1.5 GHz · km for the 0.1-km section of the MMF. This agreed with the measurement result of the 550-m MMF, ~1.65 GHz · km. The difference of 10% was accounted for the intermodal coupling effect of the tightly spooled MMF in part [4]. The stable measurement result obtained by our method with the short MMF section demonstrated the feasibility of our measurement scheme in the field test where >10 GHz is needed for the measurement bandwidth.
One more advantage of our ASE-based MMF characterization scheme is found in its wide wavelength adjustability. Due to the wide optical bandwidth of the ASE source spectrum, a wavelength range of ~50 nm can be covered by a single SOA light source, which can easily extended further with multiple SOAs or super-luminescent diodes. The adjustability can be obtained with ease by changing the center wavelength of the optical filter used in the source part. We measured the wavelength dependence of the MMF bandwidth by utilizing four different BPFs with a nominal wavelength spacing of 20 nm. Figure 9 shows the normalized transfer functions measured with the 550-m MMF sample at different wavelengths of 1,272 nm, 1,288 nm, 1,308 nm and 1,326 nm. Here, the wavelength was evaluated by the mean wavelength of the filtered ASE spectrum. The experimental result showed that the transfer characteristic did not vary considerably for the lowfrequency band below 2 GHz but, in contrast, it exhibited noticeable wavelength dependence in the high-frequency range. This feature of our ASE-based measurement scheme must be useful when the wavelength dependence of the bandwidth matters in the applications.
In this research, we showed that our MMF bandwidth measurement scheme has several advantages compared to the conventional measurement techniques. Our method utilizes a low-cost ASE light source without any modulation electronics, which greatly simplifies the measurement system and improves the measurement reliability. The measurement bandwidth can be easily extended to tens of GHz or higher owing to the wide bandwidth of the ASE light and the availability of the wideband electric spectrum analyzer that easily covers 40 GHz or wider. The detected spectral density of the fourth-order power spectra can be further improved by reducing the optical bandwidth for a given total optical power. Then, with a higher signal-to-noise ratio, our system could measure the back-reflected responses of FUTs to double the measurement accuracy in a reflectometric configuration [12].
Our method has two unresolved issues that the present research has not revealed yet, and may need further investigations in separate studies. The first issue is related to the chromatic dispersion effect in the measurement result. In finding the transfer functions, the effect of GVD was neglected for simplicity as the conventional MMF bandwidth measurement also does. It could be justified by the fact that the modal dispersion is usually far larger than the GVD for typical MMFs. An MMF mostly has an intermodal delay definitely larger than 100 ps/km while the chromatic dispersion can be as large as -100 ps/nm/km at the short wavelength band of 850 nm [1]. At the 1,310-nm band, it is surely negligible, below 5 ps/nm/km. But, in some cases, the measured MMF bandwidth can be considerably contaminated by the GVD effect that should be minimized or compensated [1,3]. At least, a rough estimation on the GVD effect should be provided for the ASE field that is obtained through an MMF.
The second issue of our ASE-based method is related to the absence of the phase information in our spectrum measurement. Our ASE-based measurement system detects the amplitude of the transfer function in losing the phase information that is essential for reconstructing the temporal contents of the impulse response via the inverse Fourier transform. In this context, our measurement method is unable to measure the intermodal delays but evaluates the bandwidth only, given in the frequency domain. This limitation may be a critical point of our measurement method because of the importance of the current laseroptimized MMF class for high-speed communications.
It has been found that the laser-irradiated MMF exhibits considerably different performances in actual communication systems from what the OFL bandwidth predicts [6]. The launch condition of the laser light usually makes a restricted mode launch (RML) without a mode scrambling mechanism. The differential modal delay (DMD) has been introduced for measuring the modal delays by differentiating the launch condition. The most well established way of differentiation is to translate the launching beam spot across the end-face of the MMF sample while the probe light is incident through the small beam onto the MMF
To cope with the EMBc standard, we suggest three possible ways of utilizing our ASE-based measurement method for the high-speed MMF links with a particular emphasis on the field testing. The simplest way is to use our ASE-based OFL measurement as a rough estimator for the modal delays in an RML condition. The OFL bandwidth, itself, can still give useful information to compare the MMF installed in the field with the manufacturer’s data. The careful analysis on the cosine fluctuations observed in the transfer function, if any, may give further information that is useful for estimating the actual link performance.
The second way is to introduce an optical mask for simulating a certain type of transmitters. This mask can be inserted between the ASE-irradiating SMF and the FUT and forms an incident field similar to the field distribution of the laser transmitter. An electrically controlled spatial light modulator (SLM) can be used for such a selective mode excitation with a capability of rapidly changing the weighting functions for a direct EMB measurement [13]. This approach can be highly preferable method in the field test, especially when the characteristics of the transmitters to be used are known. The third possible way is to develop an ASE-based measurement system that can measure the phase contents that will allow us to obtain the DMD data through the inverse Fourier transforms. Adding a separate reference arm that delivers the reference light of ASE in an SMF can be considered as in an MZI configuration [8,10,11]. But this approach increases the system complexity and may make our ASE-based method less attractive for the field testing.
In this research on the MMF bandwidth measurement, we introduced a novel MMF measurement scheme based on an ASE light source as a self-modulated light source. Through the experimental studies, we have found that our ASE-based method provides a wide measurement bandwidth with a small variation of the source characteristic when compared to the conventional impulse response measurement method. In our measurement system, the compactness of the source part which consists of passive fiber-optic components reduces the system complexity. In the field testing, the source part could be separated from the detection part being located at the other end of the FUT because of the non-synchronous nature of the measurement. The wavelength adjustability was also found to be an attractive feature of our method for the evaluation of wavelength-dependent MMF bandwidths. Due to those advantageous features, our ASE-based MMF bandwidth measurement scheme can be a promising alternative to the conventional pulse-based techniques. It is worth noting that the 850-nm band is the major transmission window for the dominant high-speed MMF links. Further investigations on the 850-nm ASE-based measurement can enable full-band characterization of the MMF transmission capability.