The effect of surround luminance on perceived image contrast is important, especially in the electronic displays field. A printed image is usually viewed in a fixed condition such as office lighting. However, recently, an image on monitor is allowed to be viewed under various surround conditions from dark room to bright outdoors. Hence, the perceived image contrast is changed according to different surround condition such as different luminance levels. It is a huge issue in color science and image quality engineering.
Several investigators [1, 2] performed brightness scaling studies to explore the background or surround effect. For example, Stevens and Stevens [1] examined the effect of adaptation on brightness scaling. Stevens specified perceived brightness as a power function of surround luminance. The exponent of power function can be explained by contrast. As the adapting field increases in luminance, the power exponent increases. This means that perceived contrast increases as the surround luminance increases. Also, Bartleson [2] examined the surround effect on lightness in light, dim and dark surrounds. The experimental result showed that the power exponents are 0.50, 0.41 and 0.33 for light, dim and dark surrounds, respectively. It indicates that the image viewed in dark surround must be about 1.5 times higher than in light surround. This value of 1.5 can be used as the contrast compensation ratio for dark surround. In the case of dim surround, the contrast compensation ratio is 1.25.
There is much literature [3-6] to verify the contrast compensation ratios. The RLAB color appearance model [3, 4] includes surround dependency to match the color appearance attributes across different viewing conditions. RLAB lightness was modeled based on power function. The power exponents were 0.43, 0.34, and 0.29, for average, dim, and dark surrounds. The corresponding contrast compensation ratios were 1:1.26:1.48 and these are very close to the classical result from Bartleson & Breneman [7]. CIECAM 97s [5] and CIECAM02 [6] have been developed by the CIE. These models are also based on power function to estimate the lightness. The surround parameter for an average surround is 0.69, for a dim surround is 0.59 and for a dark surround is 0.525. Accordingly the surround compensate image gamma ratios are 1:1.17:1.31 for average, dim and dark surround. [8]
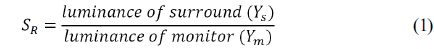
We aim to determine the perceived contrast compensation ratios for a wide range of surround luminance including dark, dim, average, bright, over-bright 1 and over-bright 2 surrounds. In our previous work [9], the change in perceived image contrast for a wide range of surround luminance was measured in Z-scale value. A set of paired comparison experiments was conducted to compare the perception of image contrast under a wide range of surround luminance covering from 0 up to 2087 cd/m2. The results showed that the perceived image contrast changed according to surround luminance and the maximum perceived image contrast was found near a surround ratio (SR) of 1. SR is the surround luminance relative to the display peak white. As SR increases from 0 to 1, black appears darker and darker and white is not very much affected, and the image contrast becomes higher. It can be fully explained by the Bartleson and Breneman effect. [7] However, when SR>1, black becomes stabilized into a certain level but white gets dimmer and dimmer; therefore, observers eventually perceive a lower image contrast. Yet this tendency has not been proved by other researchers. However, recently much research mentioned that CIECAM02 poorly estimates the brightness under bright surround conditions [10-12].
The present work tries to drive the perceived image contrast from the perceived brightness using two definitions. Their results are compared with the visual data of our previous work [7]. In conclusion, the perceived contrast compensation ratios for seven levels of surround luminance are determined.
II. PSYCHOPHYSICAL EXPERIMENT ON BRIGHTNESS PERCEPTION
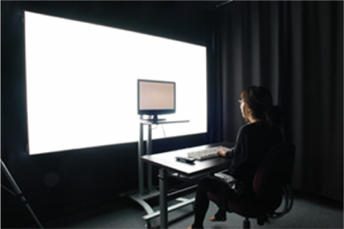
In order to investigate the surround luminance effect on perceived image contrast, a large-format flat illuminator has been built. This illuminator is made up of a cold cathode fluorescent lamp (CCFL), and its physical size is 2400 × 1300 mm. As shown in Fig. 1, the illuminator is attached to the wall to form a surround and an LCD display is placed with its back toward the illuminator to minimize the viewing flare. The experimental viewing room (including the ceiling and the wall) is also painted matte black.
A Minolta CA2000 2D color analyzer is used to measure with measuring angle of 10°. The specifications of seven surround conditions are listed in Table 1.
CCT is the correlated color temperature of illuminated light, and VF the amount of viewing flare. These surround conditions cover the wide range of surround luminance from dark to over- bright:
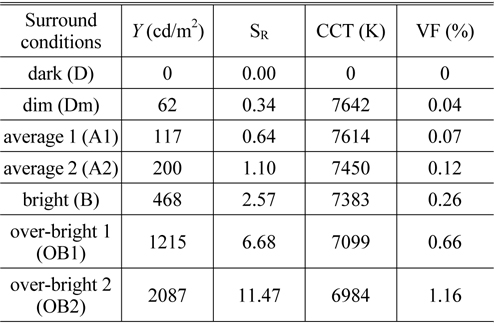
Measurement of surround luminance in terms of luminance, CCT, surround ratio and viewing flare
SR ≈ 0 defines dark surround D, 0 < SR ≤ 0.35 define dim surround Dm, 0.35 < SR ≤ 1 define average surrounds A1 and A2, 1 < SR ≤ 5 define bright surround B and 5
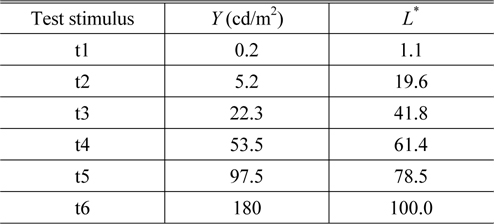
Six neutral test stimuli from black to white are produced on the LCD display. A Minolta CS1000 spectroradiometer is used for measurement. The luminance of display peak white is 180 cd/m2 and the CCT is 6746 K. Because the CCT of LCD display is different from the average CCT of surrounds, the R, G, and B digital values to reproduce each test stimulus are controlled to be about 7500K. Table 2 summarizes the luminance (
[TABLE 2.] The luminance and lightness for each test stimulus

The luminance and lightness for each test stimulus
2.2. Psychophysical Experiment
Ten observers with normal color vision participate in this experiment. There are seven males and three females, whose ages ranged from 20 to 28. Before carrying out the experiment, they are trained to recognize brightness attributes using neutral color patches of Munsell color order system. The viewing distance is set to be 3 meters from the LCD display, as shown in Fig. 1. The viewing angle is about 9° horizontally and 6° vertically.
The magnitude estimation method is considered to estimate the brightness. As a reference, test stimulus t6 is shown to the observer under A2 surround. The observer has to memorize the brightness of the test stimulus for 1 minute, and it is designated to have brightness of 100. At the same time, the observer’s eyes are adapted to the monitor. After the observer is fully memorized and adapted to the test stimulus, surround luminance condition is changed at random order. The observers are asked to assign the degree of brightness of the test stimulus under each surround condition compared to the memory. After the experiment for a test stimulus is over, these processes are repeated for the other test stimuli. The all observations are carried out in random orders. All the experiments are repeated twice and its mean value is used to represent the subjective score. Totally 840 estimation observations (6 test stimuli × 7 surrounds × 10 observers × 2 repeat) are collected in this experiment.
2.3. Statistical Analysis Methods
2.3.1. Coefficient of Variation
To estimate the observer accuracy, the coefficient of variation (CV) has been widely used in color appearance researches. [13] The CV is a statistical measure of the agreement between two data sets (

Where
Pearson correlation is used to measure dependence between two data sets. It can be obtained by dividing the covariance of between a pair of variables (e.g.
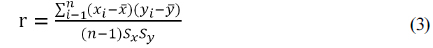
where (
The observer performance was examined using CV values. Table 3 shows the CV values of seven surround conditions for each observer. The last row is the average CV values for each observer. Among ten observers, ob8 observer shows larger CV values than others for all surround conditions, so it was decided to remove ob8 observer’s data. The CV values of each observer showed good performance under 10. The average CV value was 6.2.
[TABLE 3.] Each individual’s performance using CV values
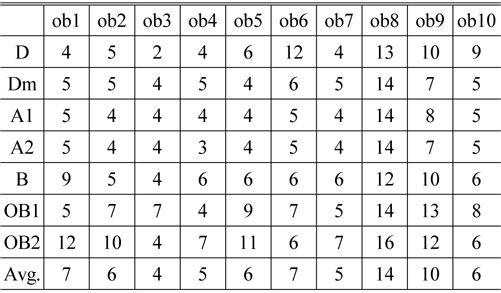
Each individual’s performance using CV values
3.2. Effect of Surround Luminance on Perceived Brightness
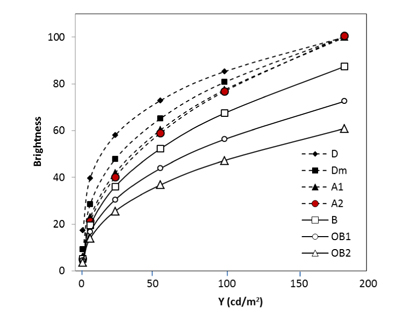
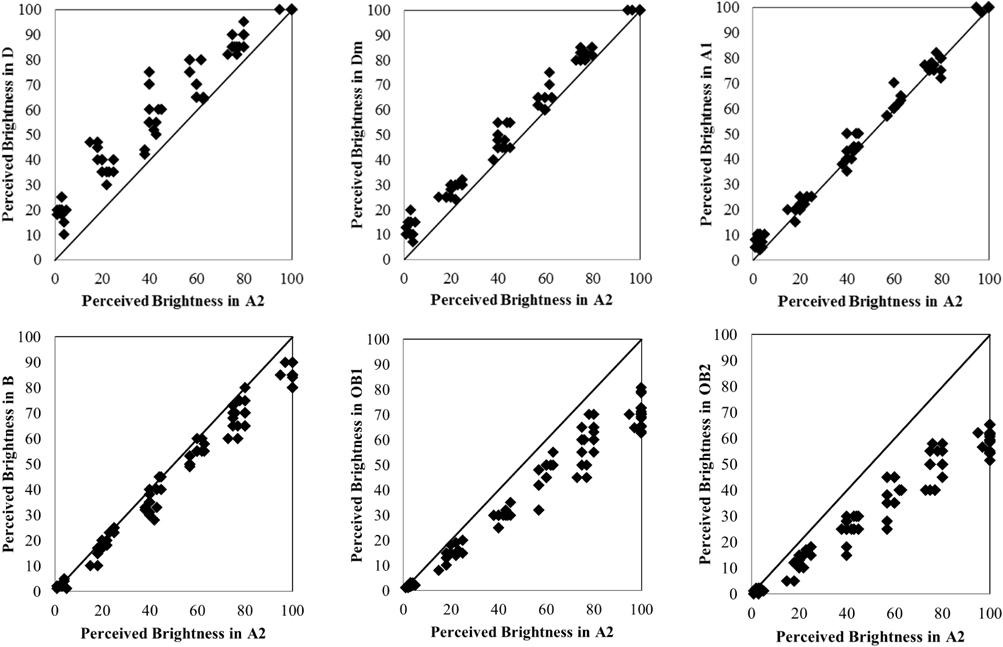
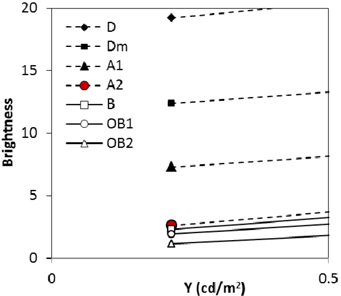
Figure 2 shows the perceived brightness of six stimuli for seven surround conditions. The x-axis is luminance of stimulus and the y-axis is the perceived brightness. The brightness of white stimulus is almost unchanged at nearly 100 when the surround luminance increased from dark surround D to average surround A2 and decreased rapidly from 100 to 50 under over-bright surrounds. Figure 3, in magnified scale, shows that the brightness of black stimulus decreases when the surround luminance increased from dark surround D to average surround A2 and almost unchanged under over-bright surrounds. Figure 4 shows the perceived brightness under each surround plotted against the perceived brightness under average surround A2. In each graph, the number of data points is 54 (6 stimuli × 9 observers). The straight line indicates a 45° line. For dark surround D, data points except white are located above the 45° line. This means that when the surround luminance is changed from dark surround D toward average surround A2, the black appears darker and white is not so much affected. For over-bright surrounds OB1 and OB2, data points except black are far away from the 45° line. This means that when the surround luminance gets brighter from average surround A2 to over-bright surround OB2, the white stimulus appears grayish and the black stimulus is not so much affected.
3.3. The Perceived Contrast Compensation Ratios
To drive the perceived contrast from the perceived brightness, two different definitions of contrast are tried. One is the power exponent of brightness function; the other is the difference in brightness between light and dark areas in a scene.
The brightness functions which describe the perceived brightness data in Fig. 4 are modeled as a power function of surround luminance [1] shown in Eq. 4.

where
[TABLE 4.] The parameters of brightness functions
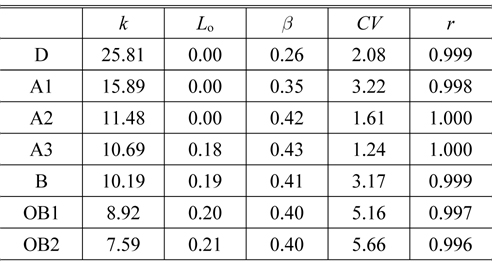
The parameters of brightness functions
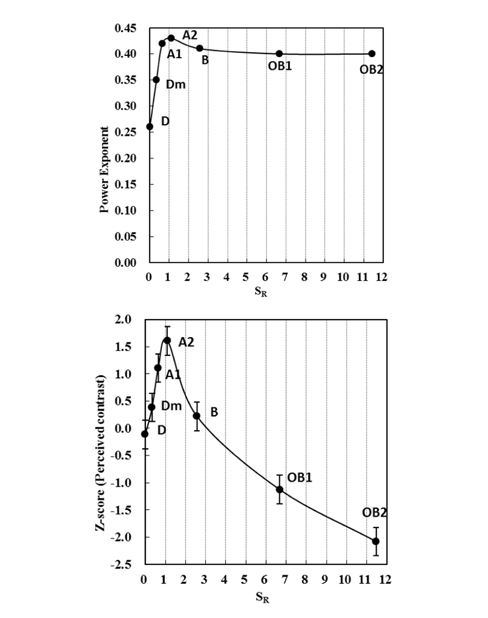
First, the perceived image contrast is defined by the exponent
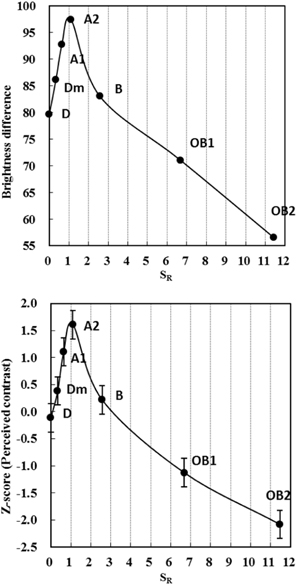
Next, the perceived image contrast is defined by the difference in perceived brightness between white and black stimuli as shown in Table 5. Figure 6 shows the change in brightness difference for seven surround conditions compared with the visual data of our previous work [9]. They are very similar to each other. It is proved that the difference in perceived brightness between white and black stimuli is represented the perceived image contrast for a wide range of luminance from 0 to 12 of SR.
[TABLE 5.] The brightness difference and contrast compensation ratio
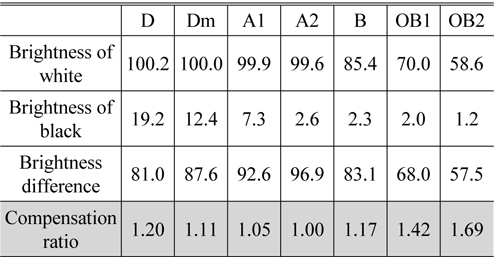
The brightness difference and contrast compensation ratio
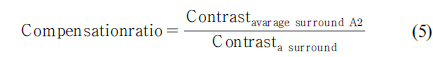
Finally, the contrast ratio for each surround condition is calculated with Eq. 5, and is also listed in Table 5.
The perceived contrast compensation ratios are 1:1.11:1.2 for average, dim and dark surrounds. These are close to CIECAM02 model (1:1.17:1.31). [6] Besides, for average, bright, over-bright1 and over-bright2 surrounds the ratios 1:1.17:1.42:1.69 are determined.
The perceived brightness was measured using the magnitude estimation. There were 6 neutral images as test stimulus. Ten observers (seven males and three females) assessed the perceived brightness for each test stimulus under a set of seven surround luminance conditions. The surround conditions were comprised of a wide range of luminance from 0 to 2087 cd/m2.
To drive the perceived image contrast from the perceived brightness, there were two trials to define the perceived contrast. One was the power exponent
In conclusion, the perceived contrast compensation ratios for seven levels of surround luminance could be determined. The perceived contrast compensation ratios were 1:1.11: 1.2 for average, dim and dark surrounds. These were close to CIECAM02 model (1:1.17:1.31). Besides, for average, bright, over-bright1 and over-bright2 surrounds the ratios 1:1.17:1.42:1.69 were determined. For intermediate or more extreme surround conditions, the compensation ratio will be obtained from the linear interpolation or extrapolation.
This research shows that current color appearance model, CIECAM02, has to be extended to a wide range of surround luminance. Further research on a color appearance model for bright conditions is required.


![The change in perceived contrast (top) based on power exponent and (bottom) visual data of previous work [9].](http://oak.go.kr/repository/journal/13396/E1OSAB_2014_v18n1_89_f005.jpg)

![The change in perceived contrast (top) based on brightness difference and (bottom) visual data of previous work [9].](http://oak.go.kr/repository/journal/13396/E1OSAB_2014_v18n1_89_f006.jpg)