The collapse of Langmuir monolayers of arachidic acid (AA) on water at various rates of molecular area compression has been investigated in situ by imaging ellipsometry (IE). The thickness of the collapsed AA molecules, which are inherently inhomogeneous, was determined by IE with a spatial resolution of a few microns. For the analysis, we determined the dielectric function of AA monolayers from 380 to 1690 nm by conventional spectroscopic ellipsometry. Compression rates ranged from 0.23 to 0.94 Å2/min. A change of multilayer domains was observed in the in situ IE images. Lower compression rates resulted in more uniform collapsed films. Our experimental results correspond with previous theoretical simulations.
Langmuir monolayers provide a unique means to study two-dimensional (2D) materials at asymmetric interfaces. Investigations of Langmuir monolayers have uncovered a rich variety of physical phenomena [1-4]. When a 2D film is compressed to its stability limit, it explores the third dimension by collapse. 2D monolayers of a large number of amphiphiles transform into overgrown 3D structures in a state of metastability and supersaturation [5]. The mode of collapse can be tuned by varying the mechanical properties of the film. Understanding this 2D-to-3D transition is of great importance, as it provides insight into the origin and nature of defects in thin films such as the biological films that protect our eyes [6, 7], ears [8, 9], and the inner surface of our lungs [10-12].
The more common system of fatty-acid Langmuir monolayers forms very rigid films at high pressures, and one can imagine their behavior upon collapse would be different from that of monolayers of lung surfactant [13]. The microscopy and rheology of the collapse phenomenon in a single-component system of fatty acids is a simpler problem, one that has allowed the folding and collapse phenomena to be modeled [14, 15]. The changes in structure of collapsed films of fatty acid molecules having different chain lengths under different compression rates, temperatures, and subphase conditions (pH and salt species) have also been investigated [3, 16-20]. The
In this work we focus on the effect of compression rate. We use imaging ellipsometry (IE) [21-23] to characterize monolayer collapse physically as a function of the rate of molecular area compression from 0.23 to 0.94 Å2/min per molecule. IE is a noninvasive,
For numerous insoluble monolayers, π-
Arachidic acid (CH3(CH2)18COOH, ≥99%, AA for short) is a saturated fatty acid with a carbon chain of 20 atoms. Our material was purchased from Sigma-Aldrich. AA was suspended and stored in a chloroform/methanol (HLPC grade, Sigma-Aldrich) 3:1 mixture in a freezer (−20℃) until use. It was spread onto organic-free deionized water of high resistivity (18.2 MΩ·cm, pH 5.7) in a custom-built Langmuir trough. Compression was begun about 15 minutes after spreading to ensure complete evaporation of the solvent. The Langmuir trough was put in the sample position of the IE and the surface was imaged
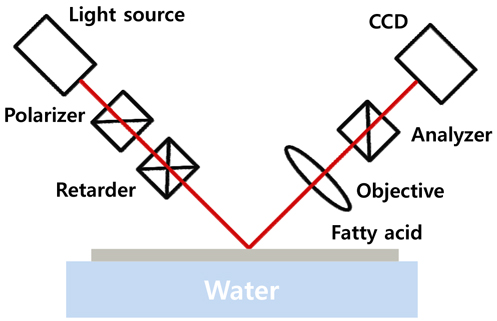
The IE used in this experiment was a rotating retarder type, manufactured by Beaglehole Instruments, Inc., New Zealand. The configuration is shown in Fig. 1. The wavelength was 632.8 nm and the angle of incidence (AOI) was 53.18°, which is the Brewster angle of water. The measured image covered a sample area of 1.8 × 2.7 mm with 200 × 500 pixels. An objective lens with a large numerical aperture (NA) would collect the light from the sample over a wider angular range, but also would increase the uncertainty of the incidence and reflection angles and thus decrease the resolution in the vertical direction (see the IE image of Fig. 5). To compromise between horizontal and vertical resolutions, the numerical aperture was kept at ~0.18. In this configuration each pixel corresponds to ~9 and ~5.4 μm for the vertical and the horizontal lengths respectively, for a wavelength of 632.8 nm. To avoid a large AOI error, we used a test beam a few mm in size in the vertical direction. The error bound of AOI is about ±0.6°. To minimize uncertainty, we averaged 11 chargecoupled device (CCD) images taken at analyzer angles of +45° and −45°. Typical exposure time was 100 ms for each CCD image. It takes 20 seconds to measure one frame of an IE image.
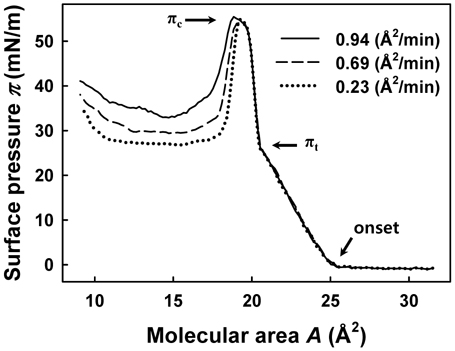
Figure 2 shows π-
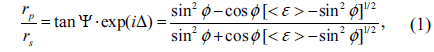
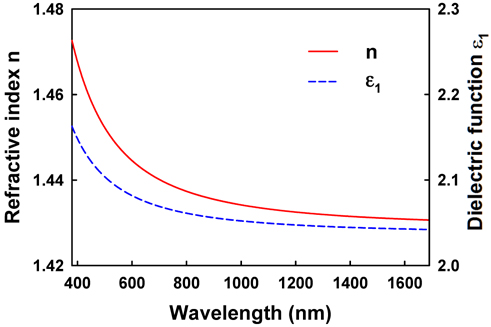
For the analysis of the collapsed monolayers, the dielectric function of AA is required. We obtained this using conventional spectroscopic ellipsometry (SE) [26]. SE measures Ψ and Δ, which are determined from the ratio of the complex reflectances of

where
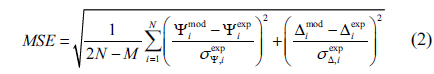
where the number of measured Ψ and Δ pairs is
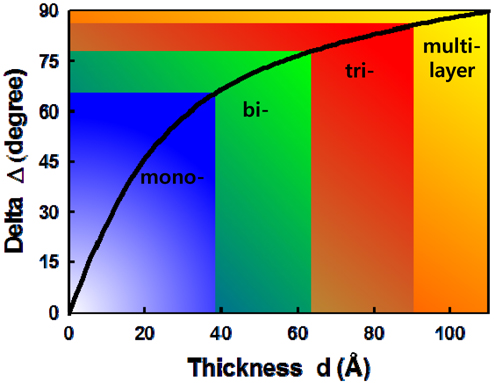
In IE we measured the same parameters introduced for conventional SE above, but a two-dimensional array of the pairs of ellipsometric parameters (Ψ, Δ) are obtained over the sample surface, which assess the properties of the sample at the scale of the resolution of the image. Thus IE is particularly suitable for probing the third dimension of the inhomogeneous layer [30, 31]. For layers appreciably thinner than the wavelength of the probing light, Δ is sensitive to change in layer thickness, while the Ψ value is hardly affected [25, 30]. With
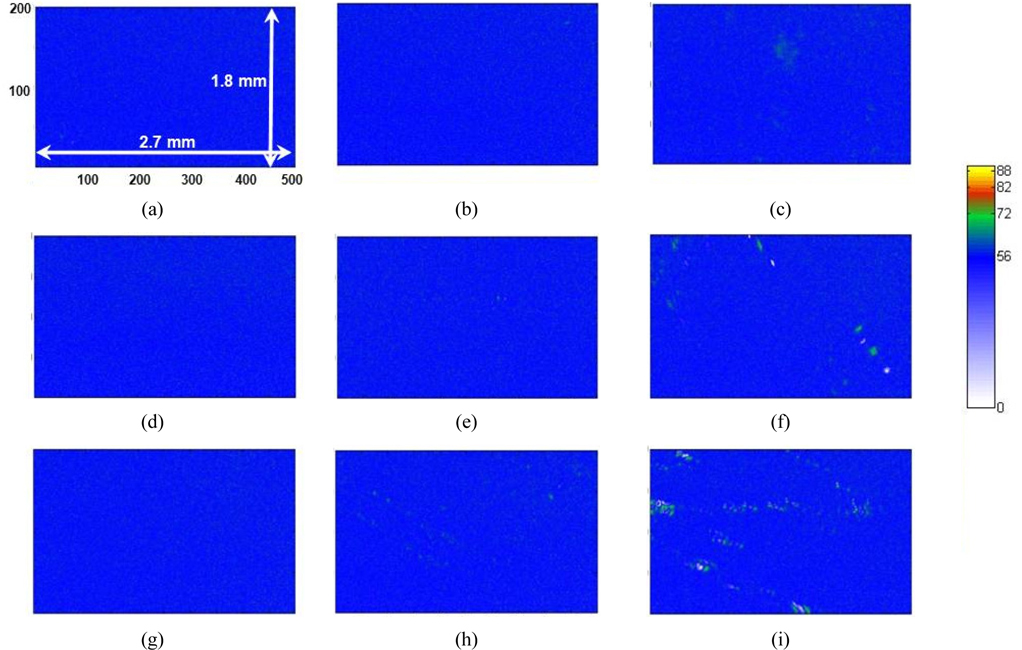
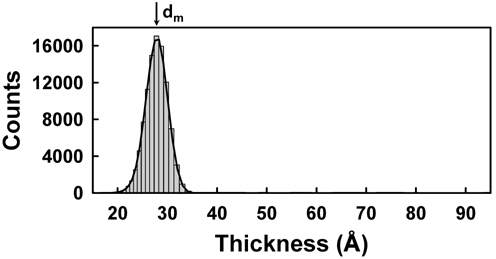
Figure 5 shows Δ images of 200×500 pixels of AA monolayers with several different values of molecular areas in condensed and after-collapse states for areas per molecule of 19.5, 18.6, and 17.5 Å2, respectively. The compression was performed in the vertical direction of the presented IE images. In Figs. 5(a), (d), and (g), the overall blue color of the images indicates that the surface is covered by a monolayer. As the molecular area decreases, a careful examination of Figs. 5(c), (f), and (i) shows that small dots with Δ values appreciably higher than those of the monolayer begin to appear, indicating that the layer thickness is not uniform over our detection area of 1.8 × 2.7 mm. This can be understood as the coexistence of the condensed phase (blue regions) and the collapsed phase (dark green regions). We statistically analyzed the data for the distribution of the AA layer thickness in corresponding areas. Figure 6 shows the pixel histograms of the corresponding image of Fig. 5(a), which consists of 0.1 million CCD pixels. We counted the pixels of equal Δ values with equidistant intervals of 1°, because the Δ is the original experimental data. In Fig. 6 the histogram indicates the distribution of film thicknesses within the probed area. We label the
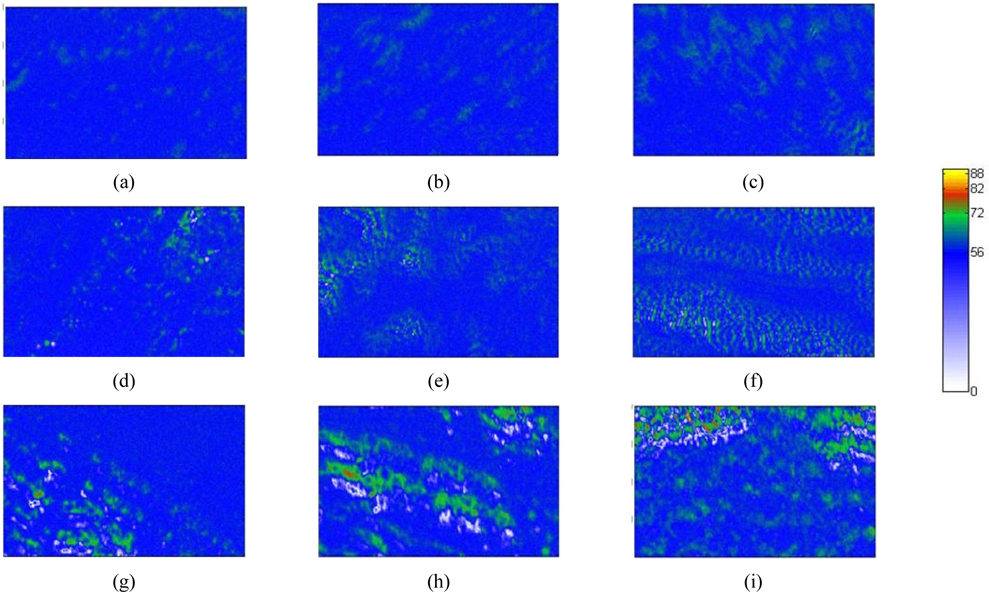
Figure 7 presents a collection of Δ images in the collapsed phase (a-c), (d-f), and (g-i), which correspond to per-molecule compression rates of 0.23, 0.69, and 0.94 Å2/min respectively. The area per molecule in Figs. 7(a), (d), and (g) is 15.6 Å2, that in Figs. 7(b), (e), and (h) is 13.4 Å2, and that in Figs. 7(c), (f), and (i) is 11.5 Å2. Figure 7 shows that some green regions with Δ values appreciably higher than that of the monolayer are present. The image of Fig. 7(a) (0.23 Å2/min per molecule compression rate) shows only a few small, collapsed dark green domains. Increasing the compression rate yields many more collapsed light green domains, appearing particularly in Figs. 7(d) (0.69 Å2/min) and (g) (0.94 Å2/min). Bilayer domains, appearing in green, increase as the film is further compressed. At the compression rate of 0.94 Å2/min some trilayer domains (red) become more numerous, as shown in Figs. 7(h) and (i). Very large Δ values are associated with multilayers. Consequently, the green and red dots in Fig. 7 are assigned to the spontaneous formation of multilayers [5, 19, 32].
The molecular mechanism assumes that over compression leads to bilayer domains merging with monolayer parts, yielding trilayer domains [32, 33]. Consistent with the simulation of Ref. [32] for AA on water, additional AA molecules move onto the AA monolayers, while at the same time head groups of AA molecules combine with each other due to hydrogen bonding. Upon further compression, more AA molecules are present and strong van der Waals forces cluster the hydrogen-bonded AA molecules into trilayers. According to Ref. [33] the combination of AA head groups yields bilayers, which form “towers”, thereby making trilayers on monolayers. Our experimental results correspond more closely to the theoretical simulations in Ref. [32].
It is clear that compression rates strongly affect the formation of multilayers. As expected, molecules that are moved more slowly, i.e., at smaller compression rates, yield more stable multilayers. Moreover, the collapsed regions in Fig. 7 are similar in shape to the light-blue regions associated with water, indicating that molecules in nearby monolayer domains are a reservoir for forming multilayer domains, as shown in a previous report [21].
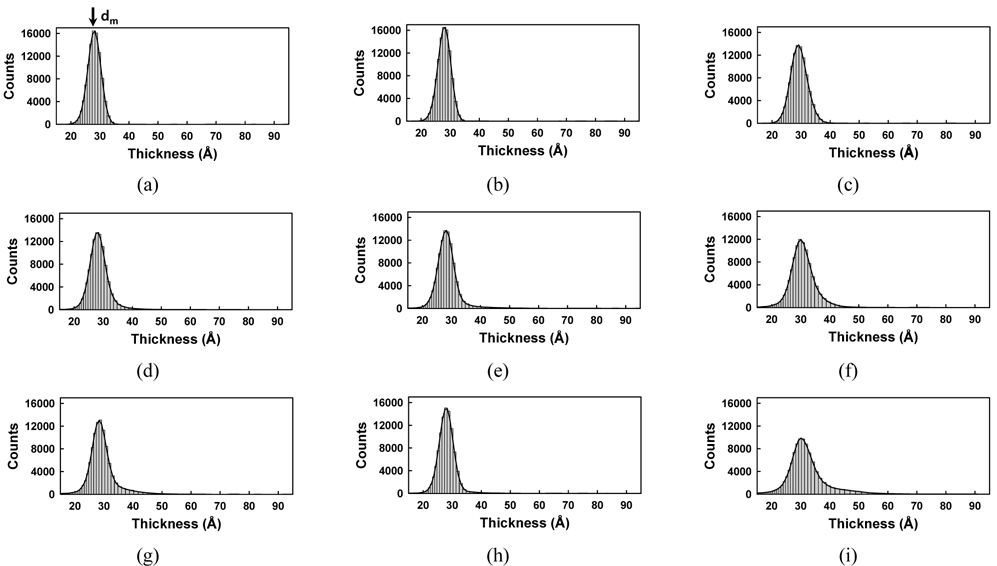
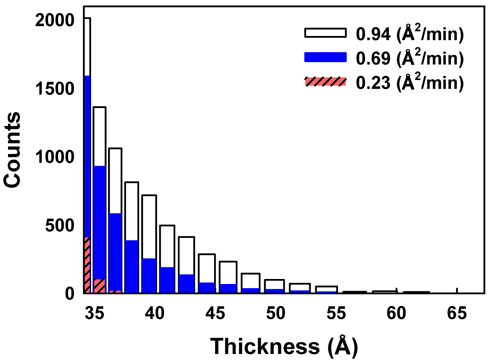
Figure 8 shows the corresponding histograms for the images of Fig. 7. In Figs. 8(d) and (g) the thicknesses have a wider distribution than in Fig. 8(a), which means that the monolayers have collapsed and been transformed to multilayers. The histograms exhibit increasing widths and larger thicknesses with decreasing surface area.
It is interesting to note that the tails of Figs. 8(a), (d), and (g) differ significantly, as shown in Fig. 9, where only the right-hand-side tail parts are compared carefully. In the case of a small compression rate of 0.23 Å2/min (red striped bar) the tail ends quickly, meaning that relatively uniform layers are formed. However, when the compression rate is high (white bar), the tail reaches the maximum thickness value, nearly 60 Å, showing the existence of thick multiple layers. This clearly suggests that AA monolayers spontaneously form multilayer domains more easily at higher compression rate.
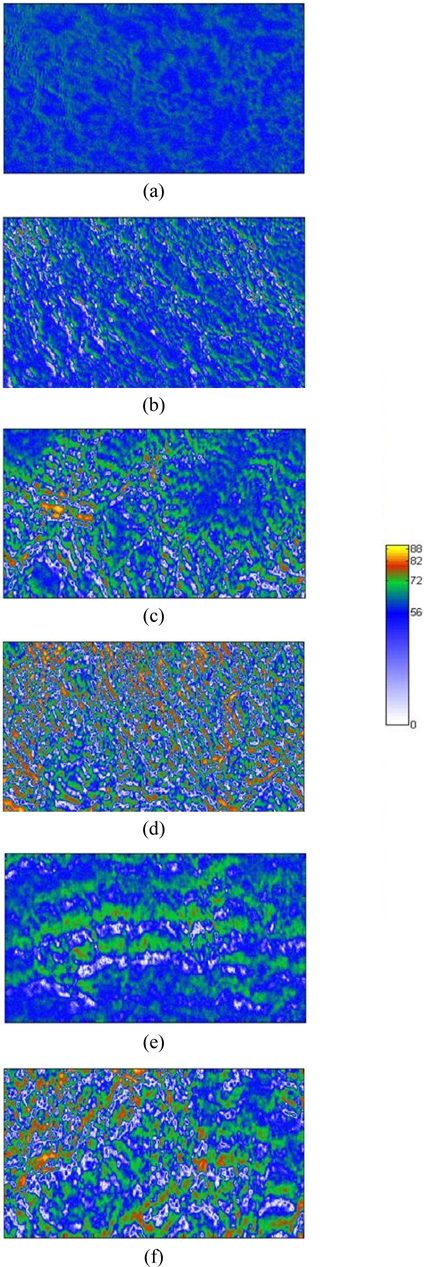
Figure 10 shows the fully collapsed morphology of films with surface areas reduced to 10.4 and 9.5 Å2/molecule. This molecular area is approximately half of the area of the intact monolayer and could not be reduced further, due to the limitations of the trough and the beam geometry of our IE configuration. The image shows that the film is indeed very inhomogeneous, being covered by spatially separated multilayer domains. The average collapsed layer thickness is more uniform for films compressed at a slower rate. Clearly the different compression rates affect both the underlying domain structure and the collapsed phase.
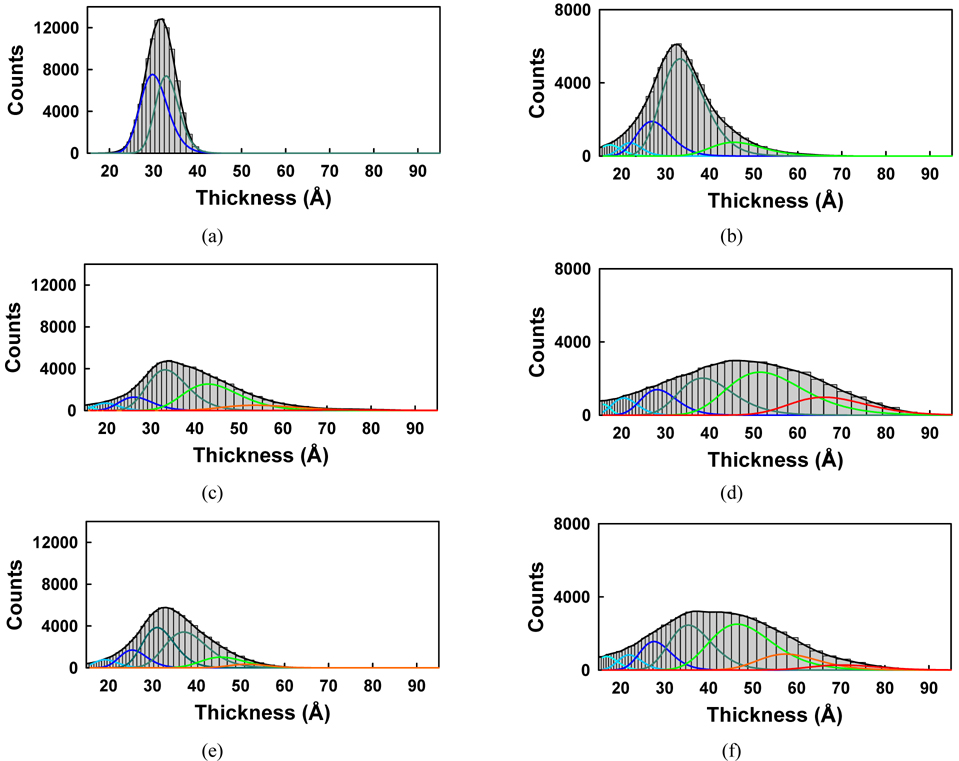
Figure 11 shows the corresponding histograms for the images of Fig. 10. To analyze the thicknesses of these samples more quantitatively, the histograms were fitted with multipeak Gaussian functions. Initially we tried to use only three peaks with
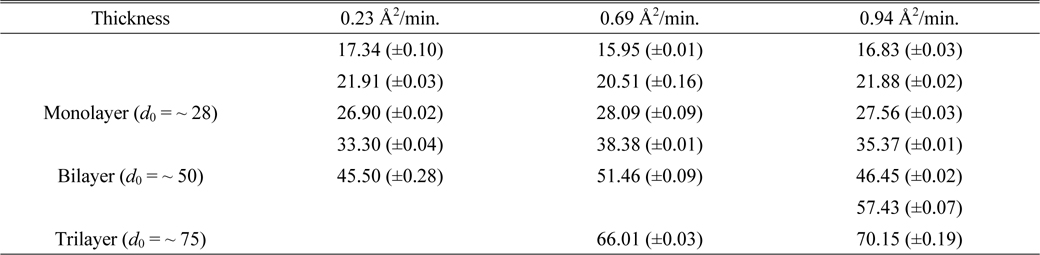
The fitting parameters of the Gaussian peak positions d0 and uncertainties in Figs. 11(b), (d), and (f) of the case of per-molecule area of 9.5 A2
Using IE, we observed detailed images of the thicknesses of AA molecular films on water after collapse with per-molecule compression rates of 0.23, 0.69, and 0.94 Å2/min. To analyze the thicknesses of the AA Langmuir layers we obtained the refractive index of an AA monolayer by conventional SE. The images show that some regions of the monolayer undergo spontaneous collapse more readily at higher compression rates. As the film is further compressed, multilayer domains form and grow as the surface area available to the film decreases. The analysis of the image at the smallest nominal molecular area of 9.5 Å2/molecule indicates that the thickness of collapsed film is more uniform at slower compression rates. In other words, under faster compression rate the film has no time for relaxation to form multiple layers of high thickness. Therefore, this observation suggests the existence of some relaxation mechanism of the AA film, indicating that a further study of the effect of compression rate using IE is needed, to analyze the relaxation time of the film. We find that its imaging capability makes SE an excellent method for studying inhomogeneities in such a system. We expect that in the future SE will find many applications in examining a wide range of subjects such as nucleation, domain structure, and film collapse.