검색 전체 메뉴
PDF
맨 위로
OA 학술지
A Vapor Sensor Based on a Porous Silicon Microcavity for the Determination of Solvent Solutions
  • 비영리 CC BY-NC
  • 비영리 CC BY-NC
ABSTRACT
A Vapor Sensor Based on a Porous Silicon Microcavity for the Determination of Solvent Solutions
KEYWORD
Porous silicon , Microcavity , Optical sensors , Solvent , Electrochemical etching
  • I. INTRODUCTION

    Owing to high specific surface area [1], porous silicon (PS) is an ideal transducer material for sensors of liquids [2-4] and vapors [5, 6]. Recently, PS optical sensors have been designed in the structure of one-dimensional photonic crystal devices such as optical filters [7] and microcavities [8]. The principle of these sensors is a determination of the photonic crystal spectral shift caused by refractive index change of the nano-porous silicon layers in the device due to the interaction with liquid or gas. It is shown from the principle that the response of the sensor is only dependent on refractive index and therefore lacks specificity for the studied substances. Consequently, most of current sensors based on the PS photonic crystal only determine the concentration of a defined substance. It is possible to use a physical or chemical method to overcome this drawback. A commonly used chemical method is the functionalization of the surface of silicon nanocrystals in the porous layers [9, 10]. It is a chemical process to create the new chemical bond that combines selectively with molecules of the studied substances. The number of published works, which used a physical method to identify the analyses, in sensors based on photonic crystals has been limited. Sailor applied temperature cycles to a porous silica photonic crystal embedded in pure chemical vapors and therefore he was able to distinguish between isopropanol, heptane, and cyclohexane [11], Ye presented a multi-beam interferometry method using optical fibers for detection of methane gas with concentration sensitivity of 0.015% [12]. The sensitivity of optical sensors is defined as the ratio of the wavelength shift and the change of the ambience refractive index, and depends on the concentration change of the solution, can be enhanced by designing suitable structural parameters such as thickness, porosity, number of porous layers in the device [13] or creating a stress on the sensor surface [14].

    This paper presents the use of a vapor sensor based on a porous silicon microcavity for the determination of solvent solutions. We set up the measurement, in which the temperature of the solution and the velocity of the airflow containing the solvent gas from solutions of ethanol and acetone control the response of the sensor. As mentioned above, the sensor uses the physico-chemical properties of the analyzed substances as “characteristic signals” involved in the response of the sensor. The sensor response is given by the shift of the resonant wavelength of the microcavity when sensors are immersed in the flow of solvent vapor. We present a study of the dependence of the wavelength shift on solvent concentration, velocity of the airflow and solution temperature. Considering those dependencies, we hope to find out the potential to enhance the sensitivity of the sensors and the specificity of the measurement.

    II. EXPERIMENTAL

    Porous silicon microcavities were fabricated by an electrochemical method in a process that was presented in our previous work [15]. In particular, the electrochemical process was carried out on a (100)-oriented boron-highly doped p-type Si wafer (resistivity is of 0.01-0.1 Ω.cm) in a 16% hydrofluoric acid (HF) solution and ethanol at various current densities. Aluminum was evaporated onto the backside of the Si wafer and then it was annealed at 420℃ in nitrogen atmosphere for 45 min. in order to ensure a good Ohmic contact. The electrochemical process was controlled by computer program using Galvanostat equipment (Autolab PGSTAT 30) so precise control over electrical current and etching time was achieved. Before electrochemical etching, the Si wafer was dipped in 5% HF solution for a minute to remove the native oxide. The electrochemical anodization cell was made of polytetrafluoroethylene (Teflon) resin and was designed to have an exposed etching area of approximately 0.79 cm2. After anodization, the sample was washed with 98% ethanol and dried in primary vacuum. For converting the surface of the silicon nano-crystals from hydrophobic to hydrophilic, we oxidized the as-prepared sample in an ozone atmosphere for 45 min. by using the ozone generator (H01 BKOzone with a capacity of 500 mg/hour).

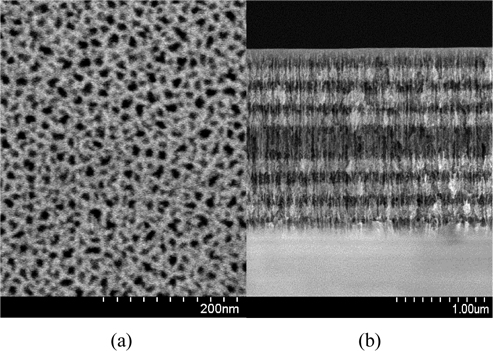
    Cross-sectional and top view images of the porous silicon microcavity were obtained using an ultra resolution field-emission scanning electron microscope (FE-SEM) S-4800. Figure 1 shows plan-view and cross-section images of the microcavity based on (HL)3,5LL (HL)3 porous silicon multilayer structure, where H and L labels correspond to high and low refractive index layers, respectively, 3.5 means three and half pairs of HL. We choose structure with 3 and 3.5 pairs of HL, because this gives a good reflectivity spectrum and easily repeatable electrochemical etching process. The thicknesses of high and low refractive layers were 72 nm and 87 nm with accuracy of ± 2 nm, respectively. This structure was obtained from anodization current density of 15mA/cm2 and 50mA/cm2 and with etching time 5.56 sec and 2.86 sec for high and low refractive index layers, respectively. For measurement of reflective spectra of the samples, we used a spectrometer (S-2000, Ocean Optics) with a resolution of 0.4 nm and a tungsten halogen lamp (Z 19, Narva).

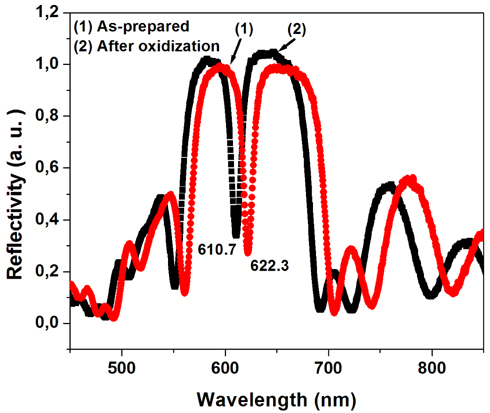
    Figure 2 shows the reflectivity spectra of the microcavity before and after oxidization. The blue shift of the resonant wavelength after oxidization is due to a decrease in the effect of refractive index of the porous layers in the microcavity [16]. From experimental results we calculated refractive indices of 2.1 and 1.75 for high and low refractive index layers, respectively.

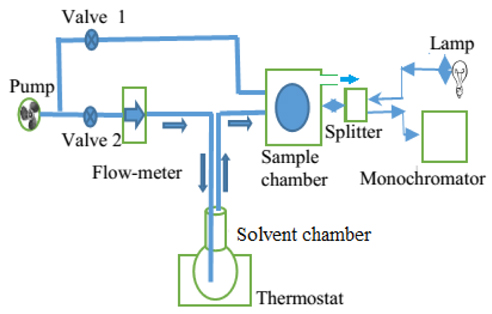
    Figure 3 shows the schematic of the concentration measurement for volatile organics by using a vapor sensor based on a porous silicon microcavity. In this schematic, valve 2 works as a controller of velocity of air stream though the flow meter, the test solvent chamber and the sample chamber. Valve 1 is only open to refresh the porous matrix after measurement. The thermostat controls the temperature of the liquid in the range from room temperature to 100℃.

    In our experiment, we use an optical fiber splitter BIF200 UV-VIS for light irradiation to samples and for collecting the reflective spectrum of the microcavity. We have also used a LM35D integrated circuit for measuring the temperature in the sample chamber. It is shown that this temperature was not affected by the solution temperature nor by the air rate in our experimental setup. For an experimental data run, it takes 5 min. to 7 min. depending on the velocity of the airflow. A standard deviation of the wavelength shift from the average value of 5 experimental data runs is 0.6 nm.

    III. RESULTS AND DISCUSSION

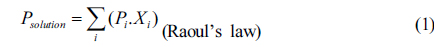
    It is known that the response of the sensor depends on solvent vapor pressure in the sensor chamber [17]. This vapor pressure is related to the vapor pressure of the solvent in the solution chamber through a gas stream flowed through the solution. Assuming that the vapor pressure in the solution chamber obeys the rules of vapor pressure in a closed system, the relation between the wavelength shift (
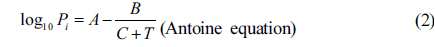
Δλ), the vapor pressure in the solution chamber (Psolution.) and the velocity of airflow (V) is crudely presented as Δλ ~ Psolution.ϑ(V), where ϑ (V) is an empirical function of V, which shows dependence of concentration of solution on the velocity of airflow. The P solution can be calculated by following formulas [18]:

    image
    image

    Where Pi is the vapor pressure of a particular substance, Xi is the corresponding mole fraction of that substance, A, B and C are component-specific constants (the coefficients of Antoine’s equation), “i” is an indexing component that keeps tract of each substance in the solution.

    The equations (1-2) show that Δλ is a function of V, Xi and Pi (T). Below we consider those relations in the experiment.

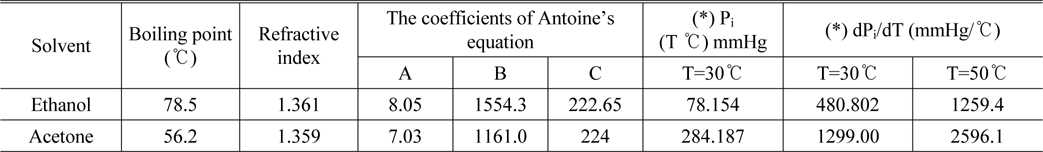
    As mentioned above, we carried out experiments on ethanol and acetone solution. These are very common organic solvents and some of their physical properties such as boiling point, refractive indices and Antoine’s coefficients from [18] are shown in Table 1.

    [TABLE 1.] Physical properties of acetone and ethanol

    label

    Physical properties of acetone and ethanol

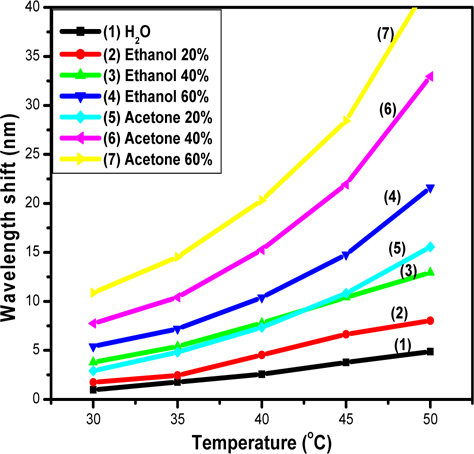
    Figure 4 shows the dependence of Δλ on T, Δλ (T), for acetone and ethanol solutions with various concentrations at the airflow velocity of 0.84ml.s-1. The equations (1-2) show that we can consider the temperature dependence of Δλ (T) as the temperature dependence of Pi (T) modified by multipliers Xi if it was assumed that the contribution of water to solution pressure is small. Experimental data from curve 1, which describes Δλ (T) of the water, shows the validity of this assumption in our measurement. Pi (T) steadily increases as temperature increases (i.e. a monotonically increasing function), so the curves of solvent solutions with various concentrations are separate, for example the curves 2-4 of ethanol solutions or the curves 5-7 of acetone solutions. Using equation (2) we calculated the rate of change of Pi (T) for acetone and ethanol in the range of temperature from 30℃ to 50℃ and its values presented in the Table 1.

    The slope of Pacetone (T) is greater than that of Pethanol (T) in the studied range of temperature (see in the Table 1), so the curves describing Δλ (T) of acetone and ethanol solutions are intersecting with each other not more than one time (for example: the curves 3 and 5), or not intersecting (for example: the curves 3 and 4). Consequently, a curve describing Δλ (T) characterizes the solution of acetone (or ethanol) at a given concentration. In other words, the dependence of the wavelength shift on the solution temperature discriminates between solutions of ethanol and acetone with various concentrations.

    As our previous work [4], we have tested the response of the sensors immersed to liquid phase solution of 100% acetone and denatured ethanol using a Cary 5000 spectrometer system with a resolution of 0.1 nm. A difference of 0.5 nm in the resonance wavelength shift of cavity for these two solvents was obtained due to the small difference in their refractive indices.

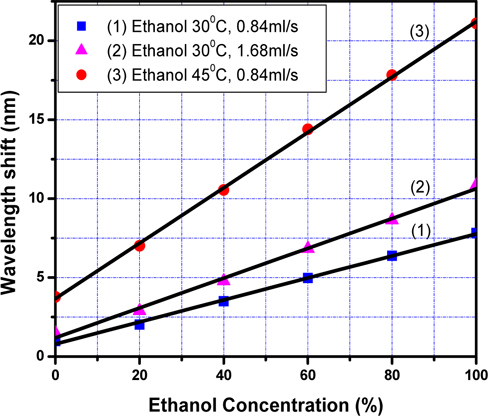
    Figure 5 shows the dependence of the resonant wave-length shift Δλ(C) on ethanol concentration, when velocity of the airflow (V) and temperature of the solution (T) work as parameters in the measurements. It can be seen in Figure 5 that the curve described by Δλ(C) is linear and its slope, i.e. sensitivity of the measurement, increases as V and T increase. Those remarks are also deduced from equations (1-2) when Xi is a variable, and T and V are parameters. Linearity of this dependence is a favorable condition for determination of solvent concentration. The increase of the slope creates an increase in sensitivity received from the measurement. From data in the curves 2 and 3, which were received from the measurement with parameters T and V at 45℃ and 0.84ml.s-1, and at 30℃ and 1.68ml.s-1, we obtain the difference of Δλ of about 18.5 nm and 10.0 nm, respectively, between the 0% and 100% ethanol. Whereas having measured with this sensor in the liquid phase in this concentration range, we obtained the Δλ difference of about 5 nm only [19]. Therefore, the sensitivity received from the measurement in the vapor phase with the value of T and V at 45℃ and 0.84ml.s-1, and at 30℃ and 1.68ml.s-1 increases 3.7 and 2.0 times, respectively, as compared with that in the liquid phase. We expect that the sensitivity of the measurement can be strongly improved with a reasonable combination of both parameters T and V.

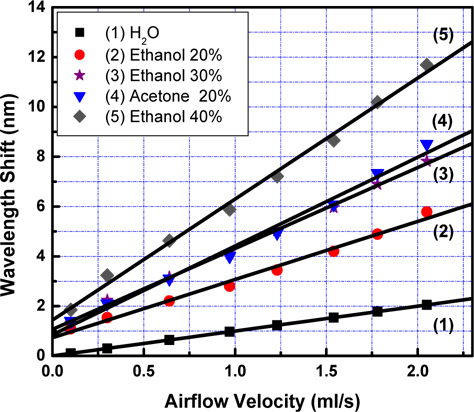
    Figure 6 shows the dependence of Δλ on V, Δλ (V), at a temperature of 30℃ when concentration of ethanol and acetone work as the parameters. It can be seen in Fig. 6 that curves describing Δλ (V) are separate straight lines with different concentrations of acetone and ethanol. This shows that empirical function ϑ (V) is a linear function of V. Now, we consider properties of the slopes of curves in Fig. 6. According to equation (1), slope of the curve describing Δλ (V) increases as Pi and Xi increase. We apply the obtained results for curves 2 and 3 received from measurements with ethanol and acetone solutions at the same concentration (20%). It can be seen that the vapor pressure of acetone is larger than that of ethanol (see in the Table 1), so the slope of curve 3 is larger than that of curve 2.

    We also apply those results for curve 2 and 4 received from measurements with ethanol concentrations at 40% and 20%. Slope of curve 4 is larger than that of curve 2 due to the greater value in concentration. It is deduced from Fig. 6 that dependence of the wavelength shift on velocity of the airflow is linear, and the slopes Δλ/ΔV are 2.4 nm/ml.s-1 and 3.7 nm/ml.s-1 for the same concentration of 20% ethanol and acetone solutions, respectively. In addition, when the concentration of organic solvent increases, the slopes Δλ/ΔV would be enhanced (for example, the value of Δλ/ΔV enhanced from 2.4 nm/ml.s-1 to 3.4 and 5.1 nm/ml.s1 when the concentration of ethanol increased from 20% to 30% and 40%, respectively). Based on this phenomenon, we can simultaneously determine the kind and concentration of organic content in the solutions. For example, 40% ethanol and 20% acetone have similar temperature dependence (see Fig. 4) but can be discriminated by their air flow velocity dependence, and while 30% ethanol and 20% acetone have similar air flow velocity dependence (as can be seen from Fig. 6), they can be discriminated by their temperature dependence.

    IV. CONCLUSION

    In conclusion, we successfully built a high sensitivity measurement system for the determination of solvent solutions by using a vapor sensor based on a porous silicon microcavity. In this measurement, the sensor response is controlled by temperature of the solution and velocity of the air stream flowing though the solution. We studied the dependence of the wavelength shift on solvent concentration, velocity of the airflow and temperature solution for the solutions of ethanol and acetone with various concentrations and in order to enhance the sensitivity and specificity of the measurement. The dependence of the wavelength shift on concentration is linear and sensor sensitivity increases with temperature of the solution and velocity of the air stream. Solution temperature and air flow velocity determine the equilibrium of partial vapor condensation in the pores and then contain characteristics of specific solvent vapor pressure and liquid refractive index that allows discrimination between ethanol and acetone and determine the concentration. This suggests a possibility for simultaneous determination concentration and type of solvent.

참고문헌
  • 1. Bayliss S. C., Amato G., Delerue C., von Bardeleben H. J. 1997 The structure of porous silicon from XAFS and ES;Structural and Optical Properties of Porous Silicon Nanostructures, Chapter 12. google
  • 2. Badilla J. P., Rojas D. C., Lopez V., Fahlman B. D., Ramirez-Porras A. 2011 Development of an organic vapor sensor based on functionalized porous silicon [Phys. Stat. Sol. (a)] Vol.208 P.1458-1461 google
  • 3. De Stefano L., Moretti L., Rendina I., Rosi A. M. 2003 Porous silicon microcavities for optical hydrocarbons detection [Sens. Actuators A] Vol.104 P.179-182 google
  • 4. Pham V. H., Bui H., Hoang L. H., Nguyen T. V., Nguyen T. A., Pham T. S., Ngo Q. M. 2013 Nano-porous silicon microcavity sensors for determination of organic fuel mixtures [J. Opt. Soc. Korea] Vol.17 P.423-427 google
  • 5. De Stefano L., Malecki K., Della Corte F. G., Moretti L., Rea I., Rotiroti L., Rendina I. 2006 A microsystem based on porous silicon-glass anodic bonding for gas and liquid optical sensing [Sensors] Vol.6 P.680-687 google
  • 6. Kim H. J., Kim Y. Y., Lee K. W., Park S. H. 2011 A distributed Bragg reflector porous silicon layer for optical interferometric sensing of organic vapor [Sens. Actuators B] Vol.155 P.673-678 google
  • 7. Jalkanen T., Torres-Costa V., Salonen J., Bjurkqvist M., Mokilo E., Martinez-Duart J. M., Lehto V. P. 2009 Optical gas sensing properties of thermally hydrocarbonized porous silicon Bragg reflectors [Opt. Express] Vol.17 P.5446-5456 google
  • 8. De Stefano L., Moretti L., Rendina I., Rossi A. M. 2004 Quantitative optical sensing in two-component mixtures using porous silicon microcavities [Phys. Stat. Sol. (a)] Vol.201 P.1011-1016 google
  • 9. Meskini O., Abdelghani A., Tlili A., Mgaieth R., Jaffrezic Renault N., Martelet C. 2007 Porous silicon as functionalized material for immunosensor application [Talanta] Vol.71 P.1430-1433 google
  • 10. Hiraoui M., Guendouz M., Lorrain N., Moadhen A., Haji L., Oueslati M. 2011 Spectroscopy studies of functionalized oxidized porous silicon surface for biosensing applications [Mater. Chem. Phys.] Vol.128 P.151-156 google
  • 11. King B. H., Wong T., Sailor M. J. 2011 Detection of pure chemical vapors in a thermally cycled porous silica photonic crystal [Langmuir] Vol.27 P.8576-8585 google
  • 12. Ye J. S., Li Z. 2013 A method for the measurement of methane gas based on multi-beam interferometry [J. Opt. Soc. Korea] Vol.17 P.481-485 google
  • 13. Moretti L., Rea I., De Stefano L., Rendina I. 2007 Periodic versus a periodic: Enhancing the sensitivity of porous silicon based optical sensors [Appl. Phys. Lett.] Vol.90 P.191112 google
  • 14. Park S. H., Kim Y. Y., Lee K. W. 2013 Sensitivity improvement of free-standing porous silicon rugate filters for isopropanol vapor detection by applying lateral pressure differences [Sens. Actuators B] Vol.176 P.437-442 google
  • 15. Do T. C., Bui H., Nguyen T. V., Nguyen T. A., Nguyen T. H., Pham V. H. 2011 A microcavity based on a porous silicon multilayer [Adv. Nat. Sci.: Nanosci. Nanotechnol.] Vol.2 P.035001 google
  • 16. Chapron J., Alekseev S. A., Lysenko V., Zaitsev V. N., Barbier D. 2007 Analysis of interaction between chemical agents and porous Si nanostructures using optical sensing properties of infra-red Rugate filters [Sens. Actuators B] Vol.120 P.706-711 google
  • 17. Salem M. S., Sailor M. J., Fukami K., Sakka T., Ogata Y. H. 2008 Sensitivity of porous silicon rugate for chemical vapor detection [J. Appl. Phys.] Vol.103 P.083516 google
  • 18. Lange N. A., Dean J. A. 1999 Lange’s Handbook of Chemistry google
  • 19. Pham T. S., Bui H., Nguyen T. V., Ngo Q. M., Nguyen T. A., Hoang T. H. C., Do T. C., Le Q. H., Pham V. H. 2013 Liquid sensors based on porous silicon microcavity [Proc. Adv. Opt. Photo. Spec. & Appl. VII] P.754-759 google
OAK XML 통계
이미지 / 테이블
  • [ FIG. 1. ]  (a) SEM plan-view and (b) cross-section images of a microcavity design in the (HL)3.5LL(HL)3 structure.
    (a) SEM plan-view and (b) cross-section images of a microcavity design in the (HL)3.5LL(HL)3 structure.
  • [ FIG. 2. ]  Reflective spectra of the porous silicon microcavity as-prepared (curve 1) and after oxidization in the ozone ambience (curve 2).
    Reflective spectra of the porous silicon microcavity as-prepared (curve 1) and after oxidization in the ozone ambience (curve 2).
  • [ FIG. 3. ]  Schematic of the concentration measurement for volatile organics by using a vapor sensor based on the porous silicon microcavity. Valve 1 and valve 2 are used to guide the airflow from a pump into the sample chamber. The arrows indicate the direction of the air or vapor flows.
    Schematic of the concentration measurement for volatile organics by using a vapor sensor based on the porous silicon microcavity. Valve 1 and valve 2 are used to guide the airflow from a pump into the sample chamber. The arrows indicate the direction of the air or vapor flows.
  • [ ] 
  • [ ] 
  • [ TABLE 1. ]  Physical properties of acetone and ethanol
    Physical properties of acetone and ethanol
  • [ FIG. 4. ]  The dependence of the wavelength shift on the solution temperature for pure H2O (curve 1), 20 - 60% ethanol (curves 2-4), and 20-60% acetone (curves 5-7) at V=0.84ml.s-1.
    The dependence of the wavelength shift on the solution temperature for pure H2O (curve 1), 20 - 60% ethanol (curves 2-4), and 20-60% acetone (curves 5-7) at V=0.84ml.s-1.
  • [ FIG. 5. ]  The dependence of the wavelength shift on ethanol concentration when the velocity of air flow (V) and temperature of solution (T) work as parameters in the measurements. The curves 1-3 received from measurements with pairs of these parameters such as V= 0.84ml.s-1 and T=30℃, V=0.84ml.s-1, T=45℃, V=1.68ml.s-1 and T=30℃, respectively.
    The dependence of the wavelength shift on ethanol concentration when the velocity of air flow (V) and temperature of solution (T) work as parameters in the measurements. The curves 1-3 received from measurements with pairs of these parameters such as V= 0.84ml.s-1 and T=30℃, V=0.84ml.s-1, T=45℃, V=1.68ml.s-1 and T=30℃, respectively.
  • [ FIG. 6. ]  The dependence of the wavelength shift on the airflow velocity in the range 0-2.5ml.s-1.
    The dependence of the wavelength shift on the airflow velocity in the range 0-2.5ml.s-1.
(우)06579 서울시 서초구 반포대로 201(반포동)
Tel. 02-537-6389 | Fax. 02-590-0571 | 문의 : oak2014@korea.kr
Copyright(c) National Library of Korea. All rights reserved.