Lipids play important roles in biological systems; they store energy, play a structural role in the cell membrane, and are involved in cell growth, signal transduction, and apoptosis. Phospholipids (PLs) in particular have received attention in the medical and lipidomics research fields because of their involvement in human diseases such as diabetes, obesity, atherosclerosis, and many cancers associated with lipid metabolic disorders. Here I review experimental strategies for PL analysis based on nanoflow liquid chromatography-electrospray ionization-tandem mass spectrometry (nLC-ESI-MSn). In particular, discussed are lipid extraction methods, nanoflow LC separation of PLs, effect of ionization modifiers on the ESI of PLs, influence of chain lengths and unsaturation degree of acyl chains of PLs on MS intensity, structural determination of the molecular structure of PLs and their oxidized products, and quantitative profiling of PLs from biological samples such as tissue, urine, and plasma in relation to cancer and coronary artery disease.
Lipidomics is a rapidly growing research area with the major research goals of understanding lipid metabolism and developing biomarkers for human diseases by studying disease-related changes in the compositions of various lipids.1 Lipids are water-insoluble molecules with a variety of polarities and are essential components of cell membranes; phospholipids (PLs) in particular are the major components of biological membranes. PLs play crucial roles in cellular systems including energy storage, signal transduction between cells, cell growth, proliferation, and apoptosis.1,2,3 Recent reports have demonstrated that PLs are potential biomarkers of a number of adult diseases including breast cancer,1,2,3,4 ovarian cancer,1,2 colorectal cancer,11 prostate cancer,12,13 and coronary artery disease (CAD).14
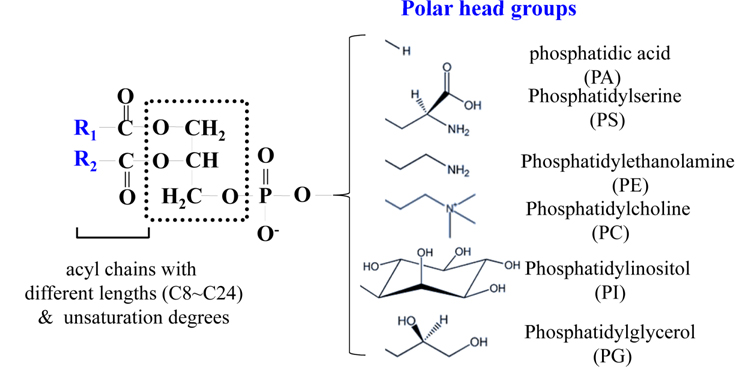
PLs contain a polar head group along with one or two acyl chains attached to glycerol. Their compositions are diverse due to diversity in polar head groups, different lengths (C8~C24) of the acyl chain, and variations in the degree of unsaturation, as shown in Figure 1. PLs with only one acyl chain at either the sn-1 or sn-2 position are referred to as lysophospholipids (LPLs). PLs are named after the head group,
This review deals with the practical use of nanoflow LCESI- MS/MS for the characterization of various PLs from biological samples. Discussed topics are extraction of PLs from biological samples, preparation of capillary columns and nLC separation, effects of ionization modifiers on PL detection during ESI, utility of LiPilot, which is a computer algorithm for structural determination of PLs, quantitative analysis of PLs, and characterization of urinary PLs from breast cancer and prostate cancer patients along with plasma PLs from CAD patients.
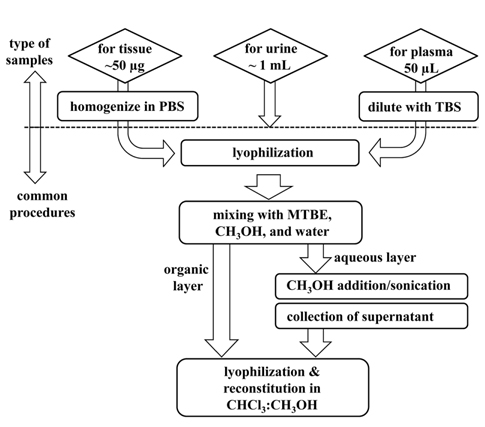
Due to variations in the electrical propensities of lipids, it is often difficult to extract all lipids at once with high efficiency. PLs have been extracted using the Folch method,28 which employs a mixture of chloroform and methanol (2:1, v/v), or with the Bligh and Dyer method,29 which is based on a reduced solvent to sample ratio compared to the Folch method. In addition to the toxic use of chloroform, the Folch method has often been criticized because it provides relatively low yields of some lysophospholipids. Folch method has been modified using methyl-
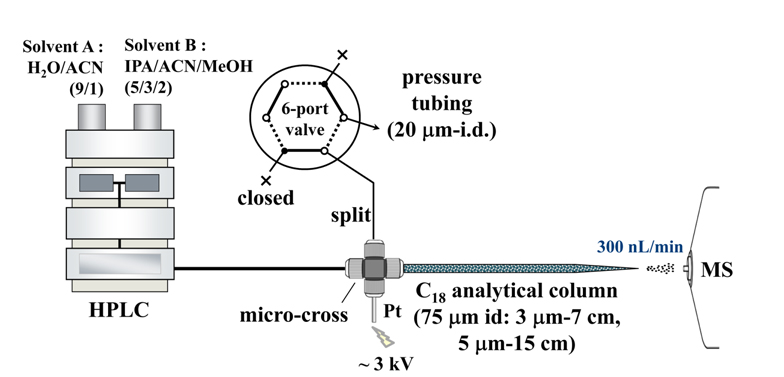
For nLC-ESI-MS/MS analysis of lipids, a pulled-tip capillary RPLC column without a separate emitter for MS can be simply prepared in the laboratory. First, a fritless capillary column can be made by pulling one end of a fused silica capillary tube (75 μm i.d., 360 μm o.d.) while applying a flame to make a cone-shaped emitter end (~10 μm i.d.). The pulled-tip capillary is then packed with a methanol slurry of reversed-phase C18 resin beads (100 A pore size, 15 cm for 5 μm beads or 7 cm for 3 μm) under He at 1000 psi. Capillary column is connected with a HPLC pump system with a PEEK micro-cross from IDEX Health & Science (Oak Harbor, WA, USA), in which the other two ends of the micro-cross are connected to Pt wire as an electrical source and to a (split or pressure) capillary tube (20 μm i.d., 360 μm o.d.) for splitting pump flow, as shown in Figure 3. The (split or pressure) tube is controlled using a six-port valve. During sample injection, the six-port valve is set-up as shown in Figure 3 so that the split tubing is closed and the lipid sample is loaded onto the capillary column directly from the autosampler at 0.6 mL/min. For LC separation, gradient flow is delivered from the HPLC pump with the six-port valve using the dotted line configuration so that the pump flow (7~10 μL/min) is split into the analytical column at 300 nL/min while the rest of the flow exits via the pressure tubing. Flow rate of the analytical column is adjusted by varying the length of the pressure tubing (20-μm i.d.). Typical compositions of mobile phase solutions used for gradient elution are H2O:CH3CN (90:10, v/v) for mobile phase A and isopropanol/ CH3CN (90:10, v/v) for B. A 0.1% solution of formic acid is added to these in positive ion mode and 0.05% ammonium hydroxide is added in negative ion mode to enhance ionization during ESI. Sample loading is performed using mobile phase A and gradient elution begins with mobile phase B, which is increased from 0% to 40% over 1 min, and then to 100% over 60 (negative ion mode)~90 min (positive). For column clean-up and reconditioning, mobile phase B is maintained at 100% for 10~30 min and then resumed to 0%. ESI voltages are 2.5 (positive) and 3.0 kV (negative). For collision-induced dissociation (CID), data-dependent analysis of the three most intense precursor ions is carried out under 40% (positive) and 45% (negative) normalized collision energies. MS ranges suggested for lipid detection are 400-1000 amu for precursor scans and 200-900 amu for MS/MS scans.
2.3. Separation and characterization of PLs by nLCESI-MS/MS
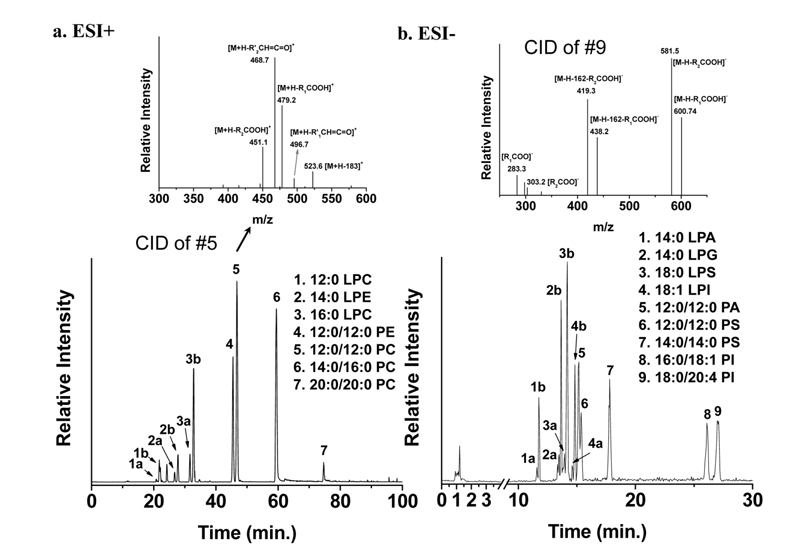
While MS analysis of most PL classes (especially anionic PLs such as PE, PS, PI, PG, and PA) is performed using the negative ion mode of MS, neutral polar (polar but electrically neutral) PL classes such as PC and sphingomyelin (SM) together with PE are efficiently detected in positive ion mode. Base peak chromatograms (BPCs) of PL standard mixtures obtained by nLC-ESI-MS/MS in a) positive ion mode and b) negative ion mode along with CID spectra of 12:0/12:0-PC and 18:0/20:4-PI are shown in Figure 4.31 Information about the acyl chain structures can be obtained from the CID spectra shown in the inset of Figure 4. As shown in Figure 4a, LPC elutes earlier than PC, and 12:0/ 12:0-PE elutes earlier than PC with the same acyl chain structure, indicating that elution depends on the hydrophobicity of lipid molecules and the type of head group. Typically, in reversed phase LC, PLs with longer and saturated acyl chains have a longer retention time than those with shorter and unsaturated acyl chains. Molecular structures of lipids can be determined from CID spectra; an example for each ion mode is presented in Figure 3. For the case of PC in Figure 4a, the CID spectrum shows a typical fragment ion at
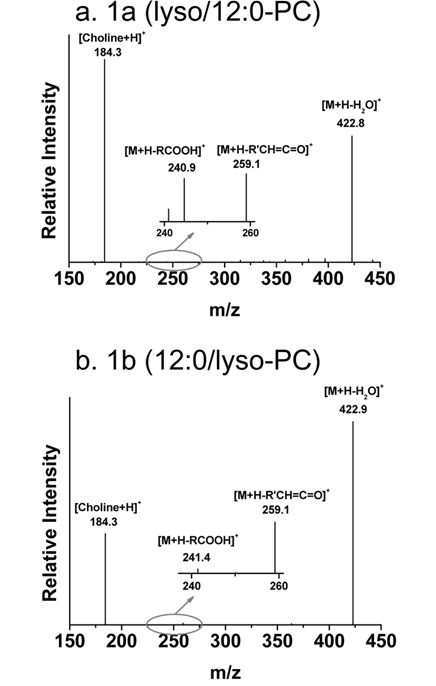
Figure 4 also shows separation of regioisomers of LPLs based on differences in the hydrophobic interactions of the following LPL standards with the C18 stationary phase: LPC, LPE, LPA, LPG, LPS, and LPI. For instance, peaks 3a and 3b in Figure 4a represent the separation of two regioisomers (lyso/16:0-PC and 16:0/lyso-PC). Lyso/16:0- PC stands for the hydroxide attached to the sn-1 carbon of the glycerol backbone, while the acyl chain is located at the sn-2 position. Because there is a difference between the geometrical structures - LPC with the acyl chain located at the sn-1 position is more extended and therefore interacts more with the stationary phase than LPC with the acyl chain at sn-2- its retention time is longer. Therefore, peak 3a is from lyso/16:0-PC. Identification of regioisomers can be confirmed not only by the separation time, but also by data-dependent CID experiments during nLC-ESI-MS/MS. An earlier systematic analysis of regioisomers reported that CID spectra of regioisomers showed the same fragment ions, but that the fragment ions had different intensities.31 Figure 5 shows two CID spectra of 12:0-LPC regioisomers during nLC-ESI-MS/MS in positive ion mode; there is a difference in the ratio of two prominent fragment ions:
2.4. LiPilot: a computer software package for PL identification
Identification of the molecular structures of PLs often requires a manual examination of CID spectra, because no commercial software is available. Recently, in our laboratory, we developed “LiPilot”,30 a computer-based algorithm for identifying PL molecules, which utilizes entire sets of raw data generated from nLC-ESI-MS/MS experiments, including precursor ion MS scans and datadependent MS/MS spectra. Developed software is flexible in producing and retrieving library files for PLs with different head groups and acyl chain structures that contain customized fragment ion patterns specific to MS instruments, and it compares differences between theoretical and experimental
2.5. Effect of ionization modifiers on the ESI of PLs
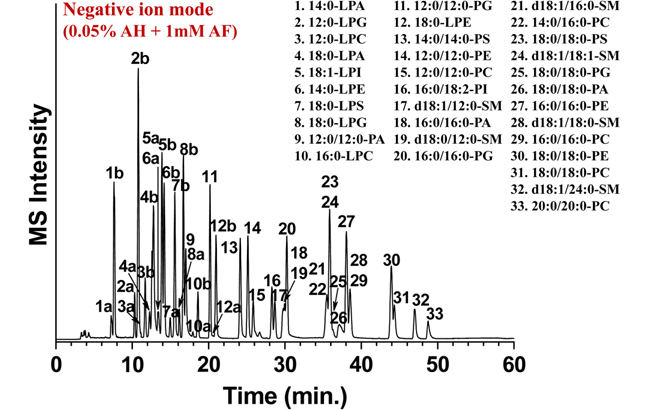
While lipids are often analyzed using two separate nLCESI- MS/MS runs, one in positive ion mode and one in negative ion mode, this approach may not be optimal when a number of samples have to be quantified. There have therefore been efforts to develop an effective ionization modifier for simultaneous analysis of all classes of PLs in negative ion mode to facilitate rapid analysis. Systematic evaluation of ionization efficiencies of 13 different PL classes using a variety of ionization modifiers (0.05% NH4OH, 5 mM NH4CH3CO2, 5 mM NH4HCO2, and 0.05% NH4OH + 5 mM NH4HCO2) revealed that addition of ammonium formate (AF) to ammonium hydroxide (AH) resulted in a significant increase in ionization efficiency of neutral polar lipids to levels similar to those observed for anionic lipids.32 Optimization of the concentration of ammonium formate resulted in the selection of 0.05% AH plus 1 mM AF for simultaneous separation and detection of 33 PL standards in negative ion mode, as shown in Figure 6. While the mixed ionization modifier (0.05% AH plus 1 mM AF) allowed simultaneous analysis of 13 different sub-categories of PLs in negative ion mode, it should be noted that PLs with choline head groups, such as PC and SM, were detected as the formate adduct form ([M+HCOO]− ) in negative ion mode. MS2 experiments of this precursor ion (formate adduct) predominantly yielded the [M-CH3]− ion, therefore MS3 (MS/MS/MS) experiments are required to obtain characteristic fragment ions for structural determination. The developed method was applied to a human urinary sample, and resulted in identification of 85 PL species identical to those obtained from a positive run and a negative run.
2.6. Quantitative analysis of PLs by nLC-ESI-MS/MS
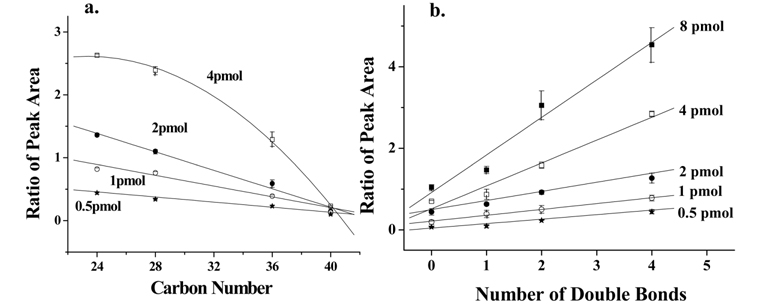
PLs can be quantified by calculating the relative ion intensity of the PL molecule compared to those of single or multiple internal standards (IS), or by calculating the peak area from neutral loss scan.33,34 Because ionization of PLs depends strongly on the numbers of carbon and double bonds, however, it is often difficult to determine the concentration of PLs. It is known that ionization of lipids with shorter acyl chains is more favorable than those with longer chain due to differences in surface activity.35 In addition, double bonds in unsaturated acyl chains could weaken intermolecular interactions at the droplet surface, enhancing evaporation of the droplet during ESI. As shown in Figure 7a, relative peak area (vs. IS) of PC standards obtained from nLC-ESI-MS decreases as the total carbon number of acyl chains increases, and the dependence of chain length decreases with the amount of individual species down to 0.5 pmol for each species. In this case, the limit of detection (LOD) was calculated to be 2.22 ± 0.33 fmol (
For simple quantification of PLs, measurements of relative peak intensity (more likely peak area) of target PL molecules vs. IS can be taken when the relative change of a certain species needs to be determined among samples of different disease status in comparison to control samples. Peak area measurements of target PLs can be obtained directly from precursor ions or from the selected reaction monitoring method (SRM) once target molecular ions and their characteristic fragment ions are identified by CID experiments. The latter method yields more reproducible results than the former method when the complexity of the lipid sample is greater.
3. Analysis of PLs from tissue and urine samples
Feasibility of nLC-ESI-MS/MS for PL analysis was demonstrated with PC extracts24 from soybean, bovine brain, and liver, resulting in the identification of 28, 25, and 39 PCs and simultaneous characterization of their molecular structures by data-dependent CID experiments. nLC-ESI-MS/MS was then applied to liver tissue samples for quantitative profiling of PCs and PEs. PL extracts were obtained from a rat liver steatosis/fibrosis model induced by chronic administration of carbon tetrachloride to rats for 30, 60, and 90 days. By utilizing the 3D calibration of PC and PE with multiple standard addition and an internal standard, 37 PCs and 19 PEs identified by nLC-ESI-MS/MS were quantitatively profiled, demonstrating that relative regulation of individual PC and PE species can be traced under different physiologic and pathologic cellular states. Total PC and PE concentrations decreased by ~51 and ~34%, respectively, during the development of cirrhosis. 26,36
When nLC-ESI-MS/MS was applied to analyze urinary phospholipids, it was found that it was challenging to extract PLs successfully from small volume urine samples. While human urine samples are generally large volume samples, sample volumes from animal models are usually limited. Therefore, an efficient extraction method to extract PLs successfully from small volume urine samples needs to be developed. In a preliminary study,38 75 PLs from six different PL categories were successfully identified from only 1 mL of human urine by adopting a lyophilization step rather than ultracentrifugation to remove water from the urine prior to use of the Folch method. Quantitative analysis of human urinary PLs from breast cancer (BC) patients and controls using the 3D calibration method resulted in structural identification of a total of 55 PLs;37 the majority of PC and PE species that showed a significant increase in patients had 16:0 or 18:0 acyl chains at the sn-1 position and 18:1 or 18:2 chains at the sn-2 position. These findings are similar to a literature report39 in which the StarD10 protein, known to be overexpressed in BC, preferentially captured lipids species with 16:0 (palmitoyl) and 18:0 (stearoly) chains at the sn-1 position and 18:1 or 18:2 chains at the sn-2 position. Studies also demonstrated that the total concentration of PCs and PEs in BC patients increased by 44 and 71%, respectively, compared to control samples but decreased significantly by 20 and 78% after surgery, respectively.
4. Analysis of PLs in human plasma
4.1 PLs in plasma lipoproteins by flow field-flow fractionation and nLC-ESI-MS/MS
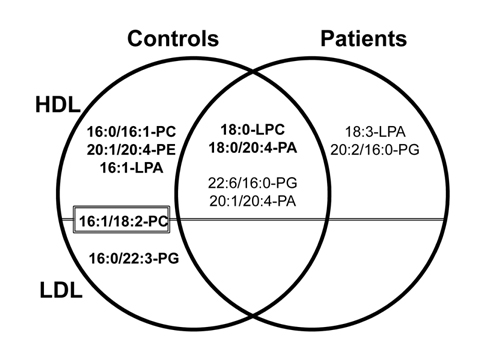
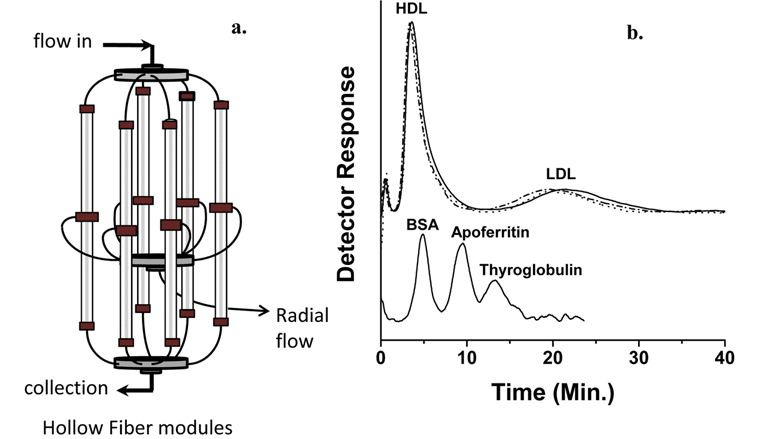
Phospholipid analysis of plasma sample with nLC-ESIMS/ MS can be carried out in two different ways: by extracting PLs from whole plasma31 using extraction methods described in Section 2.1 or by extracting PLs from different lipoprotein subclasses preliminary fractionated by size using flow field-flow fractionation (FlFFF).14,40 Lipoproteins are globular particles in blood that contain neutral lipids such as triglycerides (TG), diglycerides (DG), and cholesteryl esters (CE) in the core of the particle and polar lipids like PLs with some proteins in the exterior; their roles are to transfer fats and cholesterol through the body. Lipoproteins are classified by density as high density lipoprotein (HDL), low density lipoprotein (LDL), and very low density lipoprotein (VLDL), and their sizes increase with a decrease in density. Because low levels of HDL and high levels of LDL with a size reduction of LDL are known to be strongly related to coronary artery disease (CAD),41,42 elucidating the different patterns of lipids from HDL and LDL fractions may help in clarifying the involvement of lipid metabolism in cardiovascular disease. By utilizing FlFFF, HDL and LDL particles can be size-sorted and separately collected for the further analysis in both qualitative and quantitative purposes after lipid extraction. Figure 8a shows the multiplexed hollow fiber FlFFF (mHF5) channel assembly40 developed for semi-preparative scale separation of HDL/LDL from plasma. Six hollow fiber channels are connected in parallel to increase the injection amount (up to 50 μL per injection), and the fractogram shown in the top of panel b demonstrates the baseline separation of HDL and LDL particles along with standard protein separation at the bottom.14 HDL/LDL fractions were collected for lipid extraction followed by nLC-ESIMS/ MS analysis, resulting in identification of 93 PLs. Among these species, quantitative analysis with statistical treatment yielded 11 PL species that showed significant changes (> 5 fold) in their relative amounts; these are shown in Figure 9. For example, three species (16:0/16:1- PC, 20:1/20:4-PE, and 16:1-LPA) were found exclusively found in HDL from control subjects, while 18:3-LPA and 20:2/16:0-PG were present only in LDL from patients; these are therefore good candidate CAD markers.
4.2. Characterization of oxidized PLs in oxidized LDLs
A recent study characterized oxidized LDLs (Ox-LDLs), defined as oxidatively modified LDLs, at the molecular level using nLC-ESI-MSn.43 Oxidation of LDLs occurs primarily at the unsaturated acyl chain of PLs, resulting in the production of short chain products and long chain products. Oxidized PLs (Ox-PLs) are known to induce physical changes in biological membranes and to be involved in the formation of plaques in the inner walls of blood vessel, leading to atherosclerosis.44,45 To understand the patterns of Ox-LDL at the molecular level, bilayer vesicles prepared with a single PL standard were oxidized with a Cu2+ solution first, and the resulting Ox-PL products were systematically examined with nLC-ESI-MSn. Figure 10 shows the separation of a) a mixture of 8 PL standards and b) Ox-PA products from the oxidation of bilayer vesicles prepared with standard 18:0/22:6-PA species (peak #8 in panel a) along with c-g) CID spectra of Ox-PA products.43 Figure 10b shows numerous Ox-PA products that eluted between 15-30 min, indicating that oxidized species have a shorter retention time due to addition of hydroxide or hydroperoxide, or lack of an acyl chain. Each of the numbered species in Figure 10b was examined by CID spectra. Figure 10c shows the CID spectra of the intact 18:0/22:6-PA species. Typical fragment ions including free carboxylate anions (fragments (1) and (2)) and loss of acyl chains in the form of carboxylic acid (fragments (5) and (3)) or ketene (fragments (6) and (4)) from both sn-1 and sn-2 chains, respectively, were observed. Fragment ions with varied m/z values due to the shortness of the sn-2 chain or oxygen addition to the sn-2 chain were observed in the CID spectra of Ox-PA products. Figure 10d shows additional fragments resulting from dissociation of O2 from the parent ion [M-H-O2]− at
In the present review, described are the merits of nLCESI- MS/MS for the separation and characterization of lipid mixtures from various biological sources, and noted are some experimental necessities that should be considered for successful analysis. Because lipids have complicated and diverse electrical propensities, it is difficult to establish a universal extraction method for simultaneous retrieval of all kinds of lipids from biological samples or design a universal analytical platform for simultaneous analysis of different categories of lipids. Recent advancements in MS have facilitated the accurate determination of mass values of lipid molecules along with sound information on their molecular structures; however, sample complexity still needs to be reduced using an on-line separation method to enable successful detection of each species without biasing quantitative information. Nanoflow LC separation (~300 nL/min) prior to ESI-MS/MS has advantages for lipid analysis. Detection limit can be lowered to the low fmol level, and low abundance lipid species can be detected better because ion suppression can be substantially reduced by resolution enhancement in a microscale separation system. In addition, the amount of lipids injected can be minimized, because all the LC effluent is infused directly to the ESI without splitting flow and without using a sheath gas. Minimization of the amount of lipid injected is important for MS detection of lipid species, because the influence of the unsaturation degree of the acyl chain on MS intensity is negligible at below 1 pmol. However, separation still needs to be improved due to the complexity of the lipidome. Efforts to improve separation that involve multidimensional separation, such as normal phase LC (NPLC)46 or strong anion exchange (SAX)47 in the first dimension connected online to RPLC in the second dimension to enhance lipid identification are made recently. However, a comprehensive separation method to improve lipid analysis is required, as are systematic developments in the bioinformatics of lipids.


![Base peak chromatograms (BPCs) of a) eight PL standards, b) Ox-PA species obtained from oxidative modification of 18:0/ 22:6-PA standards (peak #18), data-dependent CID spectra of Ox-PA species: c) peak #8, d) peak #10, e) peak #12, f) peak #13a and g) peak #13b. Spectra c)-e) show the same fragment ions as (1) [R1COO]? , m/z 283.4, (3) [M-H-R2COOH]? , m/z 419.2, and (4) [M-HR2’ CH=C=O]-, m/z 437.3. The same type of fragment ions with varied m/z values for each spectra are (2) [R2COO]?, (5) [M-HR1COOH]?, (6) [M-H-R1’CH=C=O]?, and (7) [M-H-H2O]?. Permission to reproduce obtained from the publisher of ref. 43.](http://oak.go.kr/repository/journal/13373/E1MPSV_2014_v5n1_1_f010.jpg)