Matrix-assisted laser desorption/ionization time-of-flight mass spectrometry (MALDI-TOF MS) is generally used in analyses of samples such as proteins, peptides, polyethylene glycol (PEG) polymers, and carbohydrates. Different types of analyte molecules often require different matrices for optimal results. Common matrices are 2,5-dihydrobenzoic acid (2,5-DHB), α-cyano-4-hydroxycinnamic acid (CHCA), and sinapinic acid (SA). A binary matrix of two such matrix materials is reportedly superior to a single matrix due to improved homogeneity of the sample surface.1,2
Due to its unique properties, including non-toxicity, non-immunogenicity, hydrophilicity, and high flexibility, PEG is commonly used in drug delivery strategies,3 nanoparticle coatings,4 and cross-linkers.5 PEG polymers have been analyzed via MALDI-TOF MS with matrices of 2,5-DHB,6,7 2,6-DHB,8 norharmane,9 or dithranol.10
In this study, three different matrix materials were combined to form a tertiary matrix that was then applied to MALDI-TOF MS analyses of PEG polymers with number average molecular weights (Mn) ranging from 400 to 10000. The effectiveness of these tertiary matrices was compared with those of single and binary matrices of the same materials.
PEG (average Mn ~400), PEG (average Mn ~1450), PEG (average Mn ~3350), PEG (average Mn ~8000), PEG (average Mn ~10000), 2,5-dihydroxybenzoic acid (2,5-DHB), 2,6-dihydroxybenzoic acid (2,6-DHB), α-cyano-4-hydroxycinnamic acid (CHCA), sinapinic acid (SA), trifluoroacetic acid (TFA), acetonitrile (ACN), and sodium trifluoroacetate (NaTFA) were purchased from Sigma-Aldrich (St. Louis, MO, USA). The MALDI plate was obtained from Hudson Surface Technology, Inc. (Newark, NJ, USA). All mass spectra were acquired using an Axima CFR MALDI-TOF-MS (Shimadzu Biotech) equipped with a 337-nm N2 laser in positive reflectron mode for PEG-1450 and PEG-3350 or in positive linear ion mode for PEG-8000 and PEG-10000. The S/N ratios were obtained using the Shimadzu Biotech Launchpad software (v.2.9.2).
To prepare single matrices, each of 10 mg DHB, CHCA, or SA was dissolved in 1 mL of 50% ACN/0.1% TFA in distilled water. To prepare binary matrices, each of 10 mg matrix material (a total of 20 mg matrix) was dissolved in 1 mL of 50% ACN/0.1% TFA in distilled water. The tertiary matrices were prepared by dissolving each of 10 mg matrix (a total of 30 mg matrix) in 1 mL of 50% ACN/0.1% TFA in distilled water. PEG samples (1.0 mM) (Mn 1450, 3350, 8800, 10000, and 20000) were prepared by dissolving 1 μmol PEG in 1.0 mL of 0.5% TFA in water.
Each PEG sample was mixed with each matrix at an equal volume ratio. To load the sample, 1 μL of the mixture was loaded onto a stainless steel plate. After the spots were completely dried, 1 μL of 10 mM NaTFA was loaded on top of the spots. The amount of PEG polymer loaded onto each sample spot was 500 pmol.
Two tertiary matrices, 2,5-DHB+CHCA+SA and 2,6-DHB+CHCA+SA, were prepared along with four single matrices, 2,5-DHB, 2,6-DHB, CHCA, and SA, and five binary matrices, 2,5-DHB+CHCA, 2,5-DHB+SA, 2,6-DHB+CHCA, 2,6-DHB+SA, and CHCA+SA. Four different PEG polymers (PEG-1450, PEG-3350, PEG-8000, and PEG-10000) were analyzed with each matrix.
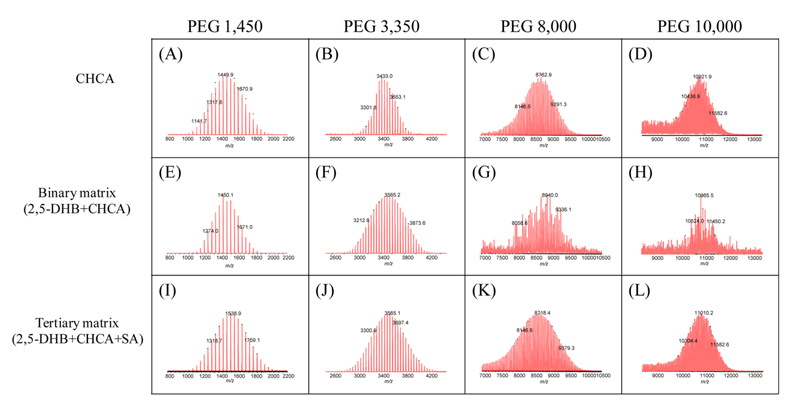
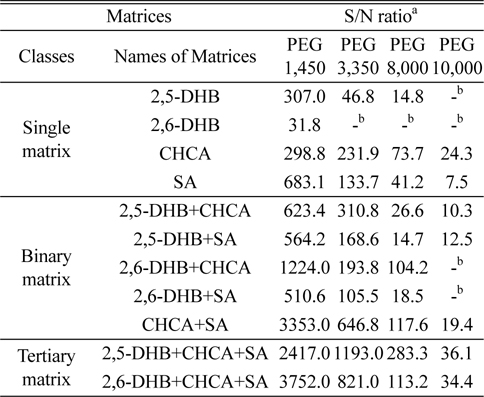
Table 1 presents the S/N ratios obtained for the various PEG polymers in MALDI-TOF MS analyses using the 11 matrices described above. Figure 1 shows the MALDI mass spectra obtained with representative matrices in each class: CHCA, 2,5-DHB+CHCA, and 2,5-DHB+CHCA+SA. The most effective matrix among all of the investigated matrices was the tertiary matrix 2,5-DHB+CHCA+SA. The most effective single matrix was CHCA, followed by SA. The addition of CHCA to any matrix significantly increased S/N ratios. Binary matrices containing CHCA yielded higher S/N ratios than their counterpart binary matrices without CHCA.
[Table 1.] Summary of S/N ratios for PEG polymers in different matrices

Summary of S/N ratios for PEG polymers in different matrices
The 2,6-DHB matrix provided lower S/N values compared to the 2,5-DHB matrix, which is different from our previous investigation,8 when 2,6-DHB provided better detection for the MALDI-TOF MS analysis of PEG polymers. The sample preparation methods presumably affect the effectiveness of the detection of PEG polymers, whereby 2,6-DHB is effective with a three-layer preparation method as shown in our previous study. The importance of MALDI sample preparation method was already demonstrated whereby a different optimum sample preparation method was observed for each protein digest.11
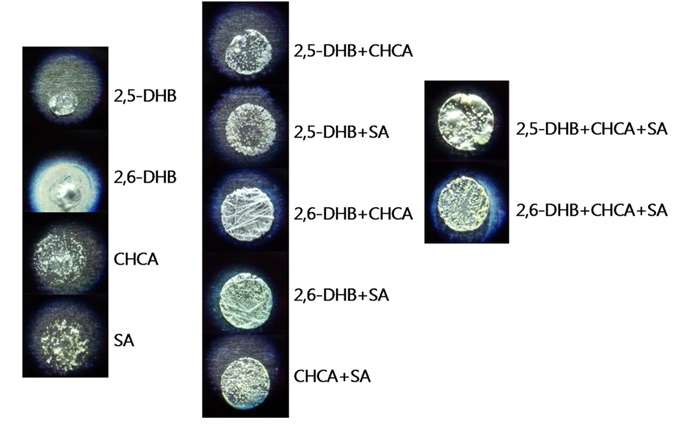
Figure 2 shows the images of the MALDI sample spots for the 11 different matrices with PEG-1450. Very similar patterns were observed from the sample spots of single matrices of CHCA and SA, in which scattered small white aggregations were observed. More uniform small aggregations were observed in the binary matrix of CHCA+SA, whose spot provided the most uniform pattern among the binary matrices. The spots of the two tertiary matrices also showed a uniform pattern, which is believed to be from the contribution of CHCA and SA. Here, we believe this uniform morphology results in homogeneous sample distribution and contributes to the increased sensitivity. In addition, the observation that slightly improved performance from the tertiary matrices (DHB+CHCA+SA) compared to the binary matrix of CHCA+SA could be explained by the contribution of DHB matrices, resulting in a synergic effect.
Mixtures of three different matrices, which are 2,5-DHB+CHCA+SA or 2,6-DHB+CHCA+SA, provided an improved sensitivity in the analysis of PEG polymers using MALDI-TOF MS. The improvement is believed to be due to the uniform morphology by mixing CHCA and SA matrices, along with the unique contribution from DHB matrices.
![MALDI mass spectra of PEG-1450, PEG-3350, PEG-8000, and PEG-10000 in the matrices of (A-D) CHCA, (E-H) binary matrix (2,5-DHB+CHCA), and (I-L) tertiary matrix (2,5-DHB+CHCA+SA). The y-axis shows the relative intensity. Mainly [PEG+Na]+ ions were observed, where PEG indicates HO-(-CH2CH2O-)n-H.](http://oak.go.kr/repository/journal/13370/E1MPSV_2014_v5n2_49_f001.jpg)