The expression and activity of the enzymes associated with steroid metabolism have major implications in the development and progression of various hormone-related diseases in humans, including congenital adrenal hyperplasia (CAH), hypertensive events, androgenic alopecia, and various cancers.1-8 In addition, divergent expression and/or activity of key steroid enzymes, such as 7-reductase, 24-reductase, and cytochrome P450 side-chain cleavage enzyme, eventually lead to differential accumulation of cholesterol in steroidogenesis.9-11 Abnormal cholesterol metabolic pathways are associated with neurodegenerative diseases.12-14 Steroid hormones regulate various body functions and are components of the endocrine system, which coordinates the physiological responses to various biochemical stresses. Many endocrine disorders can be attributed to defects in these enzymes, which lead to hormonal imbalances and have serious consequences.
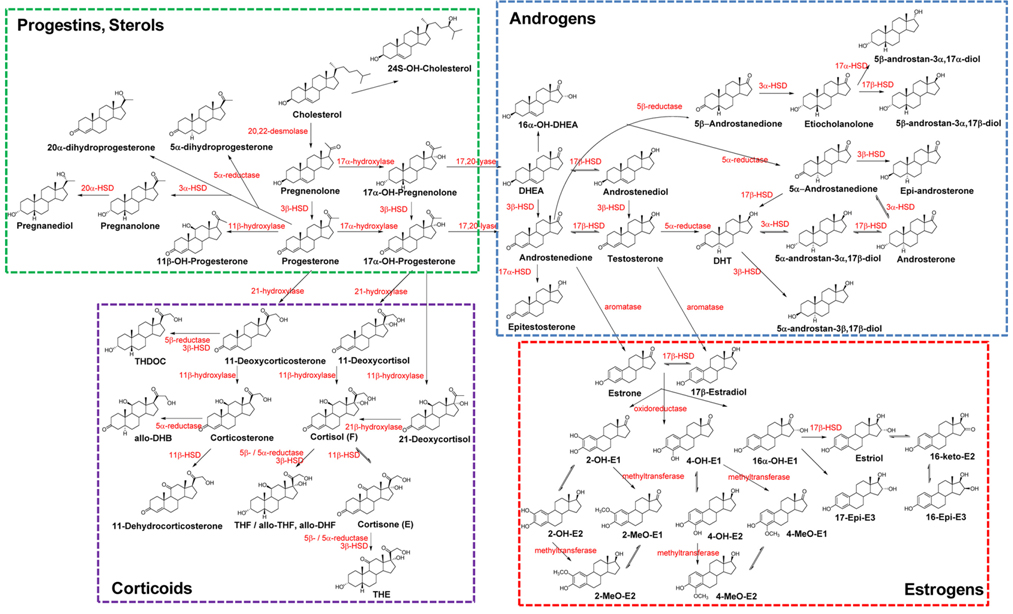
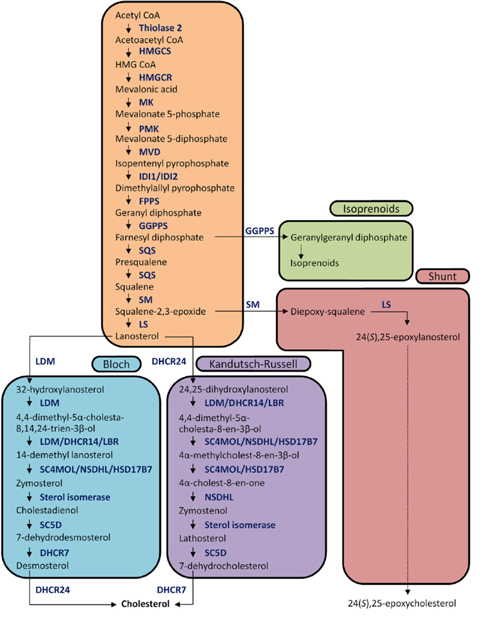
The biochemical expression of steroid hormones depends on the rate of metabolism of cholesterol (Figure 1),15 which is biosynthesized via the mevalonate pathway. The mevalonate pathway leads to the production of lanosterol, which can then be converted to cholesterol through either the Bloch pathway, via desmosterol, or the Kandutsch-Russell pathway, via 7-dehydrocholesterol (Figure 2).16 Quantitative analysis of steroid hormones is crucial for predicting the overall biological impact that steroids have on peripheral target tissues and their potential role in the development and progression of hormone-dependent diseases.
In general, biologically active steroids are present at very low concentrations in the biological specimens, such as urine, blood, and tissue, used in clinical applications. Steroids are categorized as sterols, progestins, corticoids, androgens, and estrogens. All steroids have similar chemical structures, but different chemical and physical properties, especially estrogens, which have aromatic resonance in their A-ring (Figure 1). They also exhibit some behaviors (e.g., free forms, conjugated forms, and protein-binding forms); therefore, their different chemical properties should be considered when developing analytical methods. Due to the high sensitivity and selectivity, mass spectrometry-based steroid profiling combined with gas chromatography and liquid chromatography (GC-MS1,4,10,15 and LC-MS2,9,17,18, respectively) is widely used to analyze metabolites and their precursors in steroid metabolism and determine the ratio of steroid metabolites to their precursors as an indicator of enzyme activity.
This review presents an overview of the function and expression of the steroidogenic enzymes that are associated with hormone-dependent diseases. Steroidogenic enzyme function and expression can be evaluated by determining both the concentration of individual steroids and their metabolic ratios. Such analyses can be performed with MS-based steroid profiling techniques, which are the focus of this review; comparative studies of the crucial aspects have been included to facilitate understanding of the methods developed.
Metabolic enzymes associated with CAH
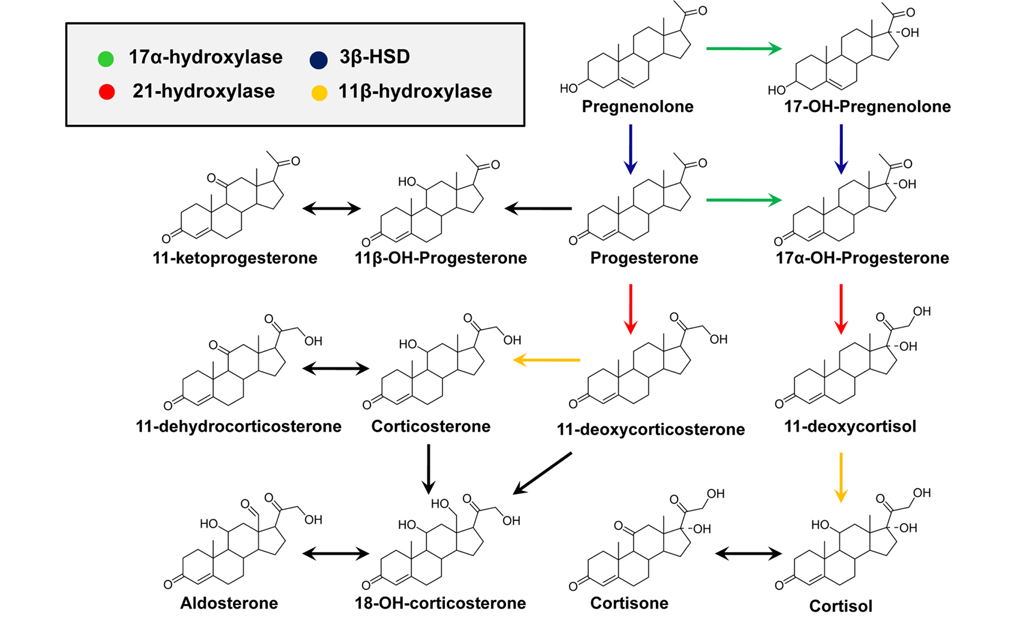
CAH is an autosomal recessive disorder characterized by a deficiency in one of four enzymes that are necessary for the biosynthesis of adrenal cortisol (Figure 3).1,2 CAH is usually diagnosed by measuring blood levels of adrenal steroids and their precursors; however, approximately 95% of cases result from a deficiency of 21-hydroxylase activity, which inhibits cortisol production and leads to the accumulation of 17-hydroxyprogesterone (17-OHP) and androstenedione.19 Accurate measurement of 17-OHP is required for the diagnosis of CAH due to 21-hydroxylase deficiency, and GC-MS-based analytical methods have been developed for this measurement.1,19,20 However, time-consuming sample preparation steps, including chemical derivatization, prevent its use as a routine screening assay; therefore, LC-MS methods have been established for the detection of plasma 17-OHP.21 In recent, an LC-MS method using a dried blood spot (DBS) was developed for use in newborn screening.22 Despite the proven diagnostic benefits for CAH, implementation of CAH screening protocols has been limited due to the significant resources required for the follow-up of false-positive results.2
Immunoaffinity-based screening assays for 17-OHP are hampered by the cross-reactivity of 17-OHP antibodies with other steroids that have similar chemical structures, particularly 17-hydroxypregnenolone, which tends to be present at very high levels in newborns.23 To improve assay performance, it is necessary to examine steroid metabolism from a “birds-eye” view, which can be achieved by metabolite profiling with enhanced specificity that are applicable for population screening. Metabolite profiling can help understand disease mechanisms, identify new diagnostic markers, and increase the chance of predicting biological variations.24 MS-based steroid profiling of adrenal insufficiency showed 100% accuracy for discriminating primary adrenal insufficiency from both normal status and secondary adrenal insufficiency.25 In addition, it was also useful for the differential diagnosis of non-classical forms of CAH, which may not be distinguishable by clinical presentation.25-27 Compared to MS profiling combined with chromatographic separation, matrix-assisted laser desorption ionization (MALDI)-MS has the advantage of high sample throughput, making it attractive for clinical applications. In addition, it has been successfully applied to measure 10 adrenal steroids, including 17-OHP, in the serum of CAH patients.28 The high speed of analysis and overall analytical sensitivity of MALDI-MS make it an attractive alternative to the traditional methods used for steroid analysis.
11β-HSD isoenzymes in corticoid metabolism
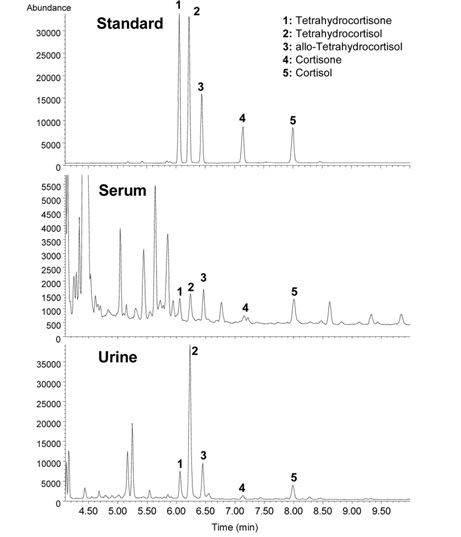
Adrenal cortisol regulates carbohydrate metabolism, enhances vasoconstrictor response to catecholamines, and increases water clearance at normal physiological concentrations.29 The major metabolic pathways of cortisol (F) include interconversion of F to cortisone (E) through the activity of 11β-hydroxysteroid dehydrogenase (11β-HSD) isoenzymes and the reduction of the double bond in the A-ring by either 5β- or 5α-reductase to yield 5β-tetrahydrocortisol (THF) or 5α-THF (allo-THF; Figure 1). Homozygous inactivating mutations in the 11β-HSD type 2 isoenzyme result in cortisol-mediated hypertension or apparent mineralocorticoid excess (AME).30 Patients with AME excrete lower amounts of cortisone metabolites, i.e., tetrahydrocortisone (THE), than cortisol metabolites, i.e., THF and allo-THF.3132 When GC-MS-based steroid profiling was applied to rule out the possibility of AME in two patients with hypokalemic hypertension, the results showed low levels of plasma renin activity and aldosterone, normal urinary excretion of glucocorticoid metabolites, and elevated ratios of allo-THF+THF/THE and F/E, although the levels of THE and E were slightly low (Figure 4). These results differentiate AME syndrome from other hypertensive diseases with clinical features indicative of mineralocorticoid excess.4
Blood vessels are target tissues for both glucocorticoids and mineralocorticoids. The pathogenesis of hypertension is closely associated with excess sodium intake. Because steroid hormones modulate renal sodium retention, it is likely that variations in 11β-HSD type 2 activity are responsible for the sensitivity of blood pressure to dietary salt.33
There are seasonal variations in many endocrine systems, as well as in the prevalence of cardiovascular events. Glucocorticoid activity was assessed in healthy men, as measured by the plasma levels of F, E, THF, allo-THF, and THE in different seasons.34 The results showed that plasma cortisol levels and tissue sensitivity to glucocorticoids are higher in winter, but cortisol production rate is lower. These variations are associated with 11β-HSD type 1 activity and may offer a possible reason why increased glucocorticoid activity contributes to the increased prevalence of disease during the winter.
5α-Reductase in male-pattern baldness
The growth of axillary, pubic, and beard hair is stimulated by androgens; however, the responses to androgens in the scalp are variable, which shortens the anagen phase of the hair growth cycle and may accelerate hair loss.35 Hair follicles contain predominantly follicular epithelial cells that can metabolize testosterone to dihydrotestosterone (DHT; via 5α-reductase type 2), the most biologically potent androgen. The degree of baldness is not correlated with the density of hair on the trunk and limbs. This indicates that the normal levels of circulating testosterone present after puberty are sufficient for maximal production of DHT and suggests that hair loss is associated with quantitative differences in the number of androgen receptors (ARs) and 5α-reductase activity in the scalp.36 Because both testosterone and DHT bind to the same AR, understanding the mechanism of androgen action in human hair follicles associated with male-pattern baldness (MPB) is of great interest.37
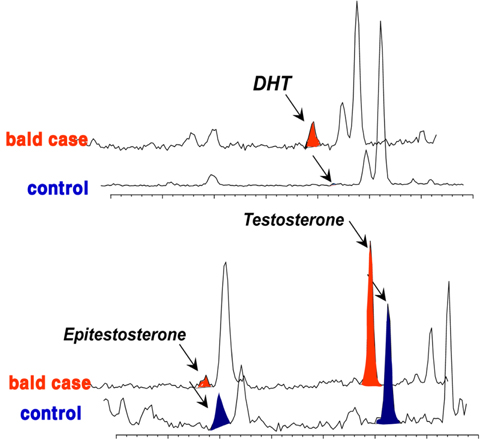
Although many studies have provided details about the amounts of ARs and/or 5α-reductase in hair follicle tissues associated with androgenetic alopecia,3839 the etiology of MPB is not clear, and no correlation has yet been found between androgen plasma levels.40 Therefore, a better understanding of androgen levels and metabolism at the pilosebaceous level may help understand the process involved in alopecia. Based on hair androgen levels measured by GC-MS, 41 the levels of DHT, testosterone, and epitestosterone in the vertex hair of the balding group (balding fathers [aged 28-55 years] and their sons [aged 8-16 years]) were compared to those in the hair of a control group comprising age/sexmatched non-balding subjects.6 The results showed a representative chromatographic window to screen for potential baldness by GC-MS analysis of these three measured steroids in hair (Figure 5). This chromatogram provided a fairly complete distinction between the balding group and the non-balding group. In the hair of balding subjects, an abundant amount of DHT was found, whereas in the control group, a noticeably high level of epitestosterone was detected. In contrast, there was no significant difference in testosterone in the mass chromatogram, although the level was slightly higher in the hair of the balding subjects.
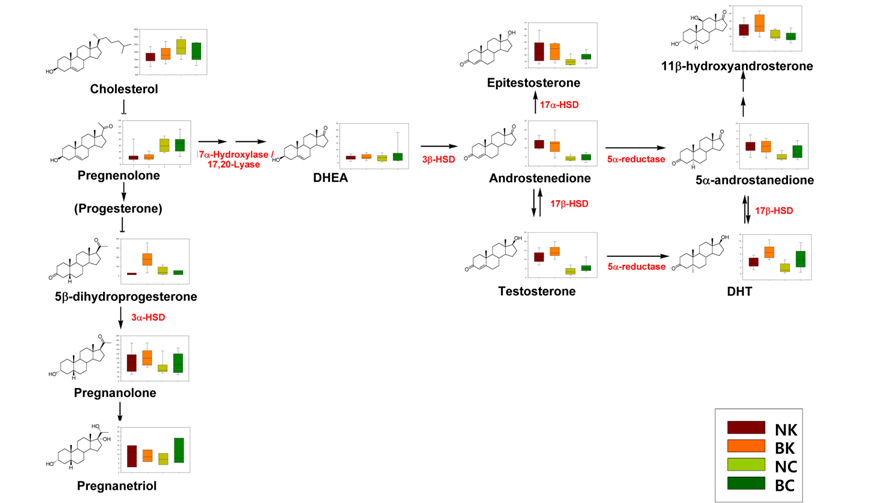
Although the androgen-associated mechanism of hair loss in MPB has been well established, there is little information on the racial differences in the expression of steroids in hair follicles. Based on a heat-map of visualized steroid signatures in hair,42 racial differences in steroid metabolism were examined.43 In contrast to serum levels of testosterone and DHT,4445 the hair levels of both of these steroid hormones were higher in the Korean group than in the Caucasian group. Although the hair levels of these MPB effectors were significantly higher in Koreans, clinically apparent MPB is more common in Caucasians than in Asians.46 The higher levels of DHT detected in the Korean group, which has a lower incidence of MPB, suggest that the Caucasian population has higher affinity androgen receptors. In addition, the lower levels of epitestosterone, an anti-androgen, in Caucasians could also explain the difference in incidence. The different androgenic potential was not only indicated by the hair levels of these individual steroids but also by the balance of their metabolic enzymes, mainly 5α-reductase, 3β-HSD, and 17β-HSD, which are associated with androstenedione, a precursor of testosterone (Figure 6).
Hydroxylation of estrogens in women
Although estrone and 17β-estradiol are primarily responsible for female reproduction, their metabolites cause many of the positive and negative effects of estrogens. Modulation of estrogen hydroxylation is essential, as some of the other metabolites increase the risk of breast and other hormone-related cancers. Oxidation of estrogens occurs at the C-2, C-4, and C-16 positions to yield 2-hydroxy (2-OH) estrogen, 4-hydroxy (4-OH) estrogen, and 16α-OH-estrone, respectively. It has been proposed that a shift toward the 2-hydroxyestrone pathway from the 16α-hydroxyestrone metabolic pathway may be inversely associated with breast cancer risk because 2-hydroxyestrone is thought to be less genotoxic and estrogenic than 16α-hydroxyestrone. However, there is no supporting evidence for an association between the circulating levels of 2-OH-estrone and 16α-OH-estrone and the risk of breast cancer among postmenopausal women.47,48 Microsomes in normal tissue obtained from either breast cancer patients or patients who underwent reduction mammoplasty operations expressed comparable estradiol 2- and 4-hydroxylase activities. Therefore, an elevated ratio of 4/2-hydroxyestradiol in neoplastic mammary tissue may be a useful marker of malignant breast tumors and suggests a mechanistic role for 4-hydroxyestradiol in tumor development.49 Individual hydroxyestrogens may play distinct roles in the onset and clinical progression of breast cancer.50
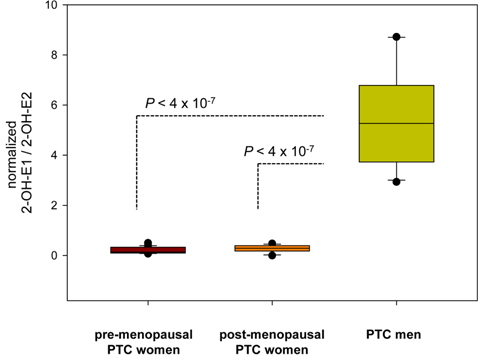
Estrogen metabolism might also be associated with the physiopathological development of papillary thyroid carcinoma (PTC). To evaluate the differences in estrogen metabolism between benign and malignant PTC, GC-MS-based estrogen profiling was applied to urine samples from postmenopausal patients diagnosed with benign tumors and malignant stage I and stage III/IV PTCs. The results showed that increased 16α-hydroxylation, a decreased 2/16α-ratio, and increased reductive 17α-HSD could be used as potential biomarkers.51 Quantitative steroid profiling combined with GC-MS was used to measure the urinary concentrations of 84 steroids in premenopausal and postmenopausal female and male patients with PTC. Statistically significant differences were found in the ratio of the estrogen metabolites 2-hydroxyestrone and 2-hydroxy-17β-estradiol, which could indicate that there are 17β-HSD differences between women and men with PTC (Figure 7).52
Biochemical tests have been the basis for studies on disorders affecting steroid hormones and their metabolic enzymes. In the future, MS-based profiling may offer improvements over the current assays in terms of improved specificity and accuracy that will aid in the differential diagnosis of related diseases, help elucidate the causes of common clinical problems, and further our understanding of the developmental milestones in hormone-dependent diseases.