Glycated hemoglobin is a form of hemoglobin used as a control index for diabetes mellitus, and measures the average plasma glucose concentration over a prolonged period. Hemoglobin A1c (HbA1c) is the major component of glycated hemoglobin, which is formed by the nonenzymatic attachment of glucose to the
There are more than 30 assay methods to measure HbA1c,4,5 causing interlaboratory variability, and thus, an effort to standardize. To achieve uniform international standardization, the international federation of clinical chemistry and laboratory medicine (IFCC) has established a working group to coordinate activities worldwide.6-8 The working group has developed a reference system, a reference measurement method,9 as well as reference material10 to be used as the basis for international standardization. It quantified
In this study, some parameters of enzyme digestion for HbA1c were optimized. Those were the quantity and volume of sample and enzyme, pH of buffer, dilution reagent, and enzyme variation. Additionally, the synthetic peptides were certified using amino acid (AA) analysis via acid hydrolysis to establish traceability to SI units and to ensure the accuracy of HbA1c quantification. Optimized sample preparation procedures were applied to produce HbA1c certified reference material (CRM). This method could be applied in the development of similar proteolytic digestion procedures.
>
Preparation of hemoglobin sample
Human blood hemolysate with an indicative value of 62.9 ± 1.8 g/kg (high resolution HPLC; MonoS™) was purchased from IRMM (Geel, Belgium)14 and reconstituted with distilled water following the manufacturer’s instructions. It was then divided into 100 μL aliquots for single use, and stored at -70°C before use. Total hemoglobin concentration was 15 g/L after reconstitution as indicated by the manufacturer.
Ammonium acetate (AmAc), formic acid (FA), and endoproteinase Glu-C were purchased from Sigma-Aldrich (St.Louis, MO, USA). Hemolyzing reagent (Tina-quant HbA1c Gen. 2) was purchased from Roche Diagnostics (Rotkreuz, Switzerland). The AA mixture used for calibration was a CRM comprising AAs in 0.1 M hydrochloric acid (HCl) from the NIST (2389a; Gaithersburg, MD, USA). Isotope labeled AAs L-proline (U-13C5,98%;15N,98%; Pro*) and L-leucine (U-13C6,98%; 15N,98%;Leu*) were obtained from Cambridge Isotopes Laboratory (Andover, MA, USA). Hydrochloric acid (HCl) was purchased from Junsei (Tokyo, Japan), and acetonitrile (ACN) was purchased from Thermo Fisher Scientific (Waltham, MA, USA). Other reagents and solvents used were of analytical grade. Water used to prepare the standard solutions, sample solutions, and mobile phase was purified using a Millipore Alpha-Q water purification system (Millipore, Billerica, MA, USA), and solvents were filtered through a membrane filter (pore size 0.2 μm).
The synthetic peptides Hexa (694.36 Da), VH[
>
Peptide hydrolysis and amino acid analysis
Two hundred microliters of VHLTPE (Hexa) and G-VHLTPE (G-Hexa) solution as well as 200 μL of isotope-labeled AA mixture were placed gravimetrically into a glass tube (15 mL, PYREX screw cap culture tubes with Teflon-lined phenolic caps, cat # 9826-16x; Corning, NY, USA) and mixed well. A final concentration of 8 M was reached by addition of 1.6 mL of 10 M HCl. The tubes were sealed, the solutions mixed, and peptides hydrolyzed at 130°C for 6 h. The acid was evaporated under nitrogen gas and the residue was dissolved in 400 μL of 0.1 M HCl, filtered through a disposable syringe filter, and then injected into the LC-MS system. The AA analysis by liquid chromatography-tandem mass spectrometry (ID-LC-MS/MS) was carried out as per Jeong et al.15 The certified hexapeptide solutions were divided into small aliquots of 100 μL for single use, and stored at -70°C before use.
>
LC-MS conditions for peptide analysis
The LC-MS/MS analysis was performed using an ACQUITY series UPLC system coupled in-line to a Xevo TQ-S MS system (Waters, Massachusetts, USA). Chromatographic separation was performed using a KINETEX C18 column (150 mm × 2.1 mm I.D., 2.6 μm particle size; Phenomenex, Torrance, CA, USA) connected to a guard column (Security Ultra, Phenomenex). Mobile phase A comprised 0.1% (v/v) FA and mobile phase B comprised 0.1% (v/v) FA in ACN. Gradient elution was performed using mobile phases A and B at a flow rate of 300 μL/min as follows: The initial condition was 94% mobile phase A. After injection, a linear gradient to 89.8% mobile phase A was reached over 5 min. The column was cleaned with 30% mobile phase A for 1.5 min, then returned to initial conditions and re-equilibrated for 1 min. Total run time was 7.5 min per 3 μL injection, and the column oven temperature was maintained at 40°C. The peptides were quantified on a triple-quadrupole mass spectrometer equipped with a turbospray in multiple reaction monitoring (MRM) mode. The precursor-to-product ion transitions
The reconstituted sample was taken from the refrigerator and equilibrated at room temperature for at least 1 h, then diluted tenfold with distilled water. Ten microliters of working sample was placed into a vial and mixed with 30 μL of 100 mM AmAc buffer (pH 4.2) fortified with isotope-labeled peptide standards. The solution was well mixed and centrifuged for spin-down. Ten microliters of 0.2 mg/mL Glu-C was added to the sample and the reaction was kept at 37°C for 20 h under gentle agitation. The final sample volume was 50 μL, and the mass ratio of Glu-C-to-HbA1c was approximately 1:50 in this study.
Each parameter of enzyme digestion such as buffer pH, enzyme-to-sample ratio, dilution reagent, and enzyme type was optimized for accuracy and precision of measured values and for reproducibility.
>
Determination of standard peptides
The synthetic peptides were determined by AA analysis coupled with ID-LC-MS/MS via acid hydrolysis. Prior to determination, the hydrolysis conditions were optimized for the object peptides. Through the optimization process, hexapeptides were found to be optimally hydrolyzed when treated with 8 M HCl at 130°C for 6 h at a 5 μmol/kg sample concentration. Because the chemical properties of each residue are different, the hydrolysis rates and stabilities can be altered under various hydrolysis conditions.16 Consequently, the results agreement between different residues can represent the reliability of the hydrolysis process. In this study, the AAs Pro and Leu were determined from hexapeptides hydrolysate. The ratio of unlabeled AA to isotope labeled AA versus the hydrolysis time reached a plateau when the hydrolysis was continued for more than 6 h. This was similar with G-Hexa (data not shown). In a previous study, human growth hormone was completely hydrolysed over 48 h under the same conditions,15 leading us to believe that molecular size influences hydrolysis time.
>
Separation of Hexa and G-Hexa
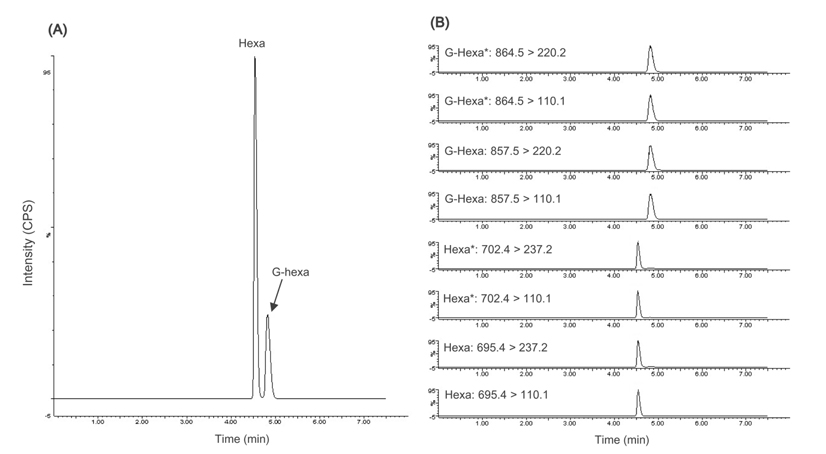
Hexa and G-Hexa were clearly separated by gradient elution within 8 min. Figure 1 shows typical total ion chromatogram (TIC) (A) and MRM scans (B) of the standard mixture of Hexa and G-Hexa. Total run time, including re-equilibration, was 7.5 min, and that was 3 times shorter than that used in the IFCC reference measurement procedure.9 Each injection has cleaning step in the gradient elution program using an increased solvent strength to elute highly nonpolar compounds, such as additional proteolytic peptides and proteins from enzymes or hemolysates. In some applications of UPLC using a fast flow rate, the lack of sufficient time for mass transfer can cause carryover and resolution degradation. A blank sample was injected after each sample injection to check for carryover, and no additional peaks were detected in the eluent of the blank.
>
Optimization of the enzymatic digestion
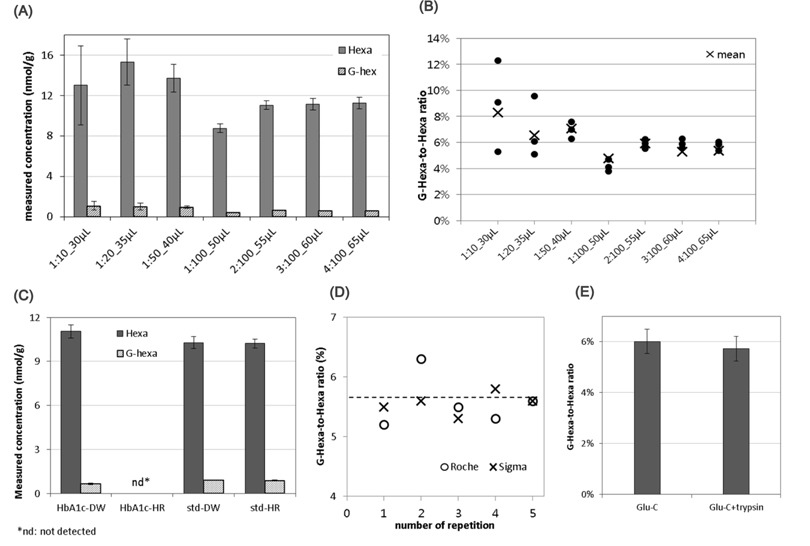
The HbA1c samples were digested in AmAc buffer solution (pH 4) at 37°C overnight (longer than 18 h). Based on these conditions, the specific points that could affect repeatability and reliability in enzyme digestion were investigated. Glu-C is a serine endoproteinase, that hydrolyzes peptide bonds on the carboxyl side of glutamyl and aspartyl residues.17 The enzyme preferentially cleaves glutamyl bonds in both AmAc buffer and ammonium bicarbonate buffer (pH 8). Both were tested for the greatest signal intensity and stable results. The AmAc buffer was selected as the superior choice (data not shown). Using this buffer, the enzyme-to-HbA1c ratios were tested across a wide range, from 1:10 to 1:100, in different sample volumes. Figures 2A and B summarize the results. While the signal intensities of Hexa and G-Hexa, as well as the G-Hexa-to-Hexa ratio fluctuated when the sample volume was small (< 50 μL), the results of higher volume samples was repeatable. The results of enzyme-to-HbA1c ratios greater than 1:50 were not significantly increased. This means that the enzyme-to-HbA1c ratio was not critical to quantification because Glu-C had a wide range of enzyme activity, covering a wide range of proteins. To reduce the consumption of costly Glu-C, a 1:50 (approximate) ratio of Glu-C-to-HbA1c was recommended.
In some cases, an analytical bias can occur in standards and patient samples in the clinical laboratory.18 That was the reason why they used different dilution reagent: distilled water for the standard but hemolysing reagent for the patient sample. Two reagents were tested as diluents of intact HbA1c. Except dilution solvents, all other experimental conditions were same. Sample preparation procedure was explained in the Experimental section. When using hemolysing reagent, enzyme activity was significantly diminished (Figure 2C). Compared to the standard solution, hemolyzing reagent did not affect LC separation or the MS signal. This will be a point to check when the commutability of HbA1c CRM to routine analytical methods using typical hemolyzing reagents was tested.
There are several commercial Glu-Cs; Glu-C products from Roche (Product No. 114203999001) and Sigma (Product No. P6181) were cross checked (Figure 2D). While there was no significant difference in mean measured values between them in five repetitive experiments, (as depicted by the dashed line in Figure 2D), the reproducibility was better when using Glu-C from Sigma.
Finally, some enzymes become more active when in the presence of other enzymes. The digestion efficacy of hexapeptides in Glu-C alone and in Glu-C combined with trypsin was tested. The added volume and concentration of enzymes were 10 μL of 0.2 mg/mL Glu-C, and 10 μL of 0.2 mg/mL trypsin, respectively. The final sample volume was 50 μL of Glu-C only and 60 μL of Glu-C and trypsin combined sample. As shown in Figure 2E, no improvement was found when using the combined enzymes.
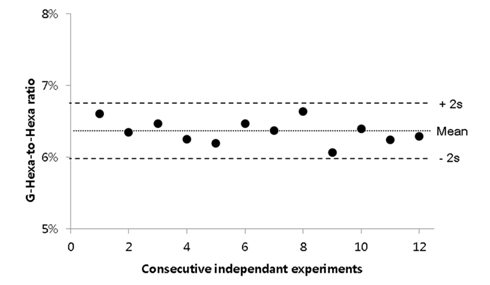
Under these optimized conditions, repeatability and reproducibility tests were perfomed using twelve repetitions. The optimized sample preparation procedure was explained in the Experimental section. As shown in Figure 3, the relative standard deviation of G-Hexa to Hexa ratio was successfully maintained at 2.6%. In summary, throughout the optimization process, some issues in practical experiments, such as total volume, enzyme-to-sample mass ratio, enzyme manufacturer, etc., were proposed. As a result, the final measured value was not significantly improved, but reproducibility was improved with optimization (Figures 2A and 2B). Further study for commutability or analytical bias using specific hemolyzing reagents is required (Figure 2C). Additionally, the manufacturer of Glu-C and the use of multiple enzymes with Glu-C did not significantly affect HbA1c quantification results (Figure 2D and 2E).
Sample preparation procedures were optimized to achieve reliable ID-LC-MS/MS results as a higher order measurement procedure for quantification of HbA1c. Synthetic peptides used for reference materials were also certified with ID-LC-MS/MS to establish traceability to SI units, and some specific parameters were investigated to assure reliability of enzyme digestion. Through this study, analytical throughput was improved by shortening run time, and experimental stability and SI traceability was also achieved. This protocol is suitable for the accurate quantification of HbA1c, and should satisfactorily serve as a reference measurement procedure for certification of CRM and verification of secondary reference materials.