Ships are extremely complex systems comprised of many smaller but equally complex subsystems that often have unforeseen interactions and interdependencies. This paper introduces a network theory based approach to quickly model and analyze the design of these systems and their interactions. The goal of this work is provide a new way of handling ship and ship system design information in the early design stage. All too often, information about the interactions of ship systems is only captured in detailed CAD models that are not available in the early stages of design. The lack of knowledge of these interactions can lead to substantial redesign in later stages or, in extreme cases, unforeseen failures in completed ships.
The paper will begin with a brief introduction to relevant network theory concepts, the network representations of three ship systems are developed and each system is analyzed individually. The systems to be analyzed are a passageway system with a focus on evacuation and personnel movement, an electrical system with focus on robustness, and a fire fighting system also with a focus on robustness. The individual systems will be analyzed using the network concepts of density, centrality, and community structure. Following the individual analysis, the three systems will be analyzed as a whole using a multiplex network which will enable the evaluation of disparate systems in a common framework. The paper will conclude with a brief summary and a discussion of possible directions for future research.
Existing general arrangement tools are capable of generating feasible layouts, but lack the underlying knowledge regarding why layouts are configured as they are. Network based methods, developed at the University of Michigan (Gillespie, 2012), can be used to bridge this gap as they provide a unique perspective to the traditional view of ship arrangements by relying on the relationships between ship board elements and components. A network analysis expands the scope of the general arrangement process and helps to manage complexity by revealing underlying character and structure, providing insight into the function of a complex system. Quality three dimensional distributed system layouts are difficult to generate, thus the ability to evaluate the design drivers prior to the general arrangement process through a network approach would be of value. Identifying the disparate ship design information in the form of design drivers captures the abstract concept of designer intent while modeling design rules and best practices. These metrics indicate the underlying personality and style of the design (Pawling et al., 2013). By modeling ship systems as networks, the designer can evaluate network metrics to further understand the design space.
Graph theory also has been shown to be useful as a model for the facilities layout problem (Hassan and Hogg, 1987; Singh and Sharma, 2005). Graph theoretic principles can also be combined with optimization methods for solving the facilities layout problem for single floor facilities (Azadivar and Wang, 2000) and multi-floor facilities like ships (Lee et al., 2005). These methods tend to focus on layout generation whereas the method and tools presented in this paper concern themselves with analysis, though it would not be difficult to integrate the metrics introduced in this paper into an optimization framework to aid in ship layout generation.
While graph theoretic and network science based approaches employ the same modeling framework, graph theory applications tend to be small and rely on the graph to be planar (Fleck, 2013). Network science provides methods for understanding the complex layout problem on a larger scale while addressing the disparate and uncoordinated set of rules and guidelines that are evolutionary over a period of time within a ship design. As a result, network based approaches are appropriate for complex ship design systems and for bridging the gap between space-only arrangements and distributed system layouts (Gillespie and Singer, 2012).
Network theory can also be used to model the structure of design tools (Parker and Singer, 2013) and give insight into the fundamental relationships between variables with those tools. These relationships can be used to predict the outcomes of larger design structures. This paper will focus more on the modeling the design rather than the tools used to create said design but will be cognizant of the designer bias that may drive the design to a specific solution.
This section serves to introduce basic network theory nomenclature and metrics used in this paper. For a more comprehensive discussion of network and graph theory the authors recommend the textbook written by Newman (2010).
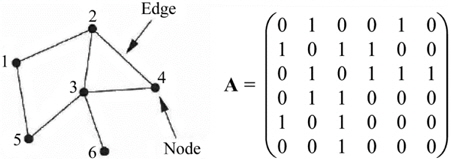
Networks, which are also called graphs depending on the context, consist of a collection of nodes connected by edges. The networks described in this section and the next are known as simplex networks in that the nodes and edges represent only one type of entity and connection, respectively. For this work, networks will be represented mathematically using an adjacency matrix A, which represents the connections between the nodes. The two most basic kinds of networks are undirected and directed networks. In an undirected network the adjacency matrix is symmetric and the links between nodes represent any connection between them. A directed network on the other hand has an asymmetric adjacency matrix and the edges represent a link from one node to another.
Fig. 1 displays an unweighted, undirected network with its adjacency matrix. In this kind of network, an edge is represented by the number 1 in some element of the matrix showing a connection from node
The degree of node


Where degree measures are concerned with the edges into and out of one node, path measures are concerned with the edges that connect various nodes. The most basic, and easiest to overlook, path dependent measure is connectivity or whether or not each node is connected to each other node through some path. Every network presented in this work should be a fully connected network otherwise, for example, there could be spaces that are inaccessible from other spaces. Next, one can analyze the shortest path or longest path characteristics between nodes. In an evacuation scenario, the shortest path between a berthing space and a muster station for lifeboats would be of utmost importance. The diameter of a graph is the length of the longest, shortest path between any pair of nodes and is a useful for quickly judging the size of a network. Longest paths are useful for determining upper bounds for the time or size of network based processes.
Centrality is a way of addressing which are the most important nodes within a network. The simplest measure of centrality, mentioned above, is the degree of a node. But for this work, a more advanced concept of centrality called betweenness centrality, or simply betweenness, will be used.
Betweenness is the measure of the extent a node lies in the paths between other nodes (Freeman, 1977) and is not concerned with the degree of the nodes. A node with a degree of two could easily have the highest betweenness in a network because it is the only connection between all the other nodes. More generally, it can be said that nodes with high betweeness have the most control over traffic across the network because the most amount of traffic must pass through them. They can be considered choke points and their removal from the network would cause the most disruption of traffic flow across the network. The betweenness, bi, of node i is the ratio of the number of shortest paths, ni, between node s and node t that cross node i to the total number of shortest paths, gst, between s and t Eq. (4).

It is natural to try and breakdown networks into smaller groups or communities to see how the different groups interact. There are two ways of going about this: graph partitioning or community detection. Graph partitioning seeks to divide a network into a predetermined number of groups or into groups with a fixed sized while minimizing the number of edges between the groups. Partitioning can be used to aid in creating a logical general arrangement (Gillespie, 2012).
Community detection, on the other hand, does not start with a predetermined number or size of groups. The community detection approach will be used in this work as we assume a basic general arrangement or series of general arrangements have already been completed and now a designer is attempting a tradeoff study between them. This work will consider a subgraph (a smaller part of the network) a community if the intensity of the interactions among nodes in the subgraph is higher than what would be expected in a random graph (Barigozzi et al., 2011). In this paper communities will be found via spectral modularity maximization using the Louvain method (Blondel et al., 2008). The method seeks to maximize a quality function (Eq. (5) for simplex networks (Lambiotte et al., 2009)) by first maximizing modularity in local communities then creating a new network based on these communities. The process is repeated until no increase in the overall quality function is possible.

In Eq. (5),
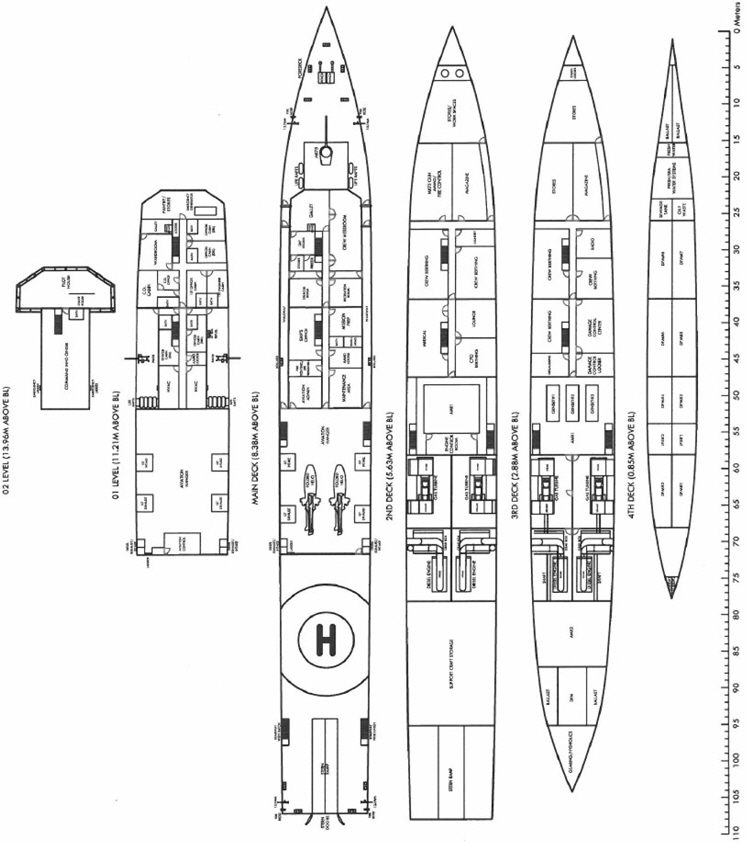
In this section, a nominal warship’s general arrangements will be used to create network representations of the ship’s passageway, electrical, and firefighting systems. This ship design is a senior design project from the University of Michigan Department of Naval Architecture and Marine Engineering’s capstone design class. While the general arrangements are complete, the distributed system design is not and has been approximated using by the authors of this paper. The ship is a 108
The passageway network of a ship is nearly identical to that of the road network of a city; as such, many of the techniques for modeling and analyzing passages have been borrowed from the urban planning and traffic engineering disciplines. Road or passage networks are called spatial networks because nodes represent something in a physical space and edges are equipped with some sort of physical metric. Typically the space is a two dimensional space and the metric is Euclidean distance (Barthélemy, 2011). There are two ways of representing such systems as a network: either passage segments are denoted as edges and intersections are nodes or the reverse where the intersections are treated as edges connecting the nodes representing road segments. For this analysis, the former representation where the passage segments are edges and the intersections of the segments are nodes was used as it is a more intuitive structure when dealing with personnel movement and evacuation. A node is placed at each doorway from a space or stairwell as well as anywhere that two passages intersect, nodes are then connected by edges representing the connecting passages. Edge weights are equal to the distance, in meters, between the intersections. The 02 level was not included in the passageway network as it only had two functional spaces. Fig. 2 displays a small section of the ship with the passage nodes and edges shown. This representation also was chosen because it can easily be adapted into a discrete event simulation (Teknomo and Fernandez, 2012) where the movement of agents throughout the passage system can be visualized. The goal of this work is not simulation but rather an easy-to-use metric for comparing multiple designs. Table 1 displays some key properties of the passage system networks of the example ship.
It is not possible to tell if a network is sparse or dense by only considering one network on its own, rather one must calculate
[Table 1] Characteristics of ship passage networks.
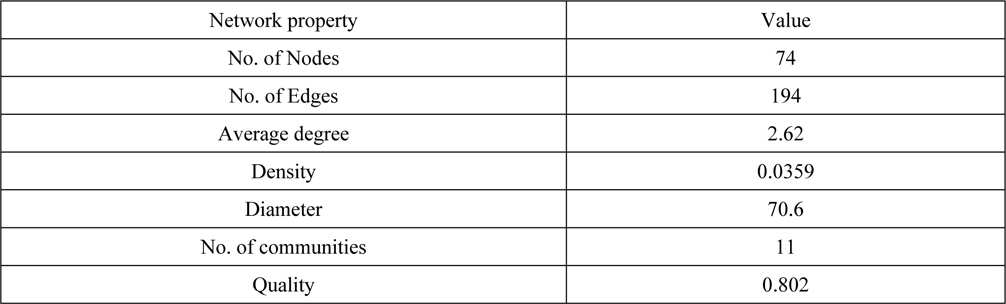
Characteristics of ship passage networks.
When planning egress routes, the first thing to look for is the shortest path from any space to an evacuation point. This is achieved by using the shortest path principle. Of the 60 spaces on the example ship, the furthest space from an evacuation point is the forward storeroom on the 3rd deck which is 36.6
Betweenness centrality is a useful metric when looking at the overall flow of the personnel through a passageway system (Altshuler et al., 2011). It is hypothesized that ladders that connect the main deck to other decks will have the highest betweenness as they are the only thing connecting decks to each other. This is confirmed as true. Unsurprisingly, passageways at the fore and aft ends of the ship have the lowest betweenness score out of all the passageways (functional spaces will always have a zero betweenness as they are “dead end” nodes that connect only to a passage node).
While betweenness can give an overall picture of where choke-points could occur if personnel moved about the ship randomly, it does not give as much of an understanding of what could happen in real events such as a catastrophic damage to the ship causing it to need to be evacuated. To easily analyze choke-points in this event, an evacuation betweenness metric is proposed. This metric is found using the product of the shortest path from an intersection to an evacuation point and the number of other shortest paths that go through that intersection. For example, if a node was 16
For the community detection algorithm it was necessary to take the inverse of each element of the adjacency matrix. This was done so that nodes that were closer to each other, which had lower value for the edge weights connecting them, appeared to have stronger community connections than those nodes which were spread further apart. Elements in the matrix that were initially 0, representing a lack of connection between two nodes, were kept as zero.
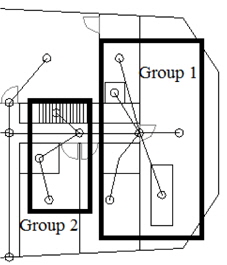
The quality function always returns values less than or equal to 1, so the score of 0.802 for the passageway system is quite high meaning the communities are well defined. The 11 groups were split in an intuitive fashion according to the proxymity to a stairway. The groupings are shown using an inboard profile in Fig. 3, where the shades of gray serve only to denote the extent of each community. These groupings could be used for evacuation simulations where instead of having to simulate many individual agents moving through the entire passage system, less agents representing a group of crew members could move through a simplified network based on these passage system groups. This would significantly reduce the cost and time of the simulations, making them more useful in the early design stage. Additionally, the groups could be used for the placement of distributed systems hubs, fan rooms, and damage control lockers as well as production decisions like where to split blocks and modules.
The electrical system network was created by placing a node in each space, at each passage intersection, and at each passage dead end. Longer passageways also had a node place at their midpoint. Additionally, nodes were placed where major deck machinery and weapons systems are located. The network assumes three voltage levels which are used for assigning edge weights: a 120
[Table 2] Electrical system edge weight factors.

Electrical system edge weight factors.
[Table 3] Characteristics of ship electrical networks. Deck No. of Nodes No.

Characteristics of ship electrical networks. Deck No. of Nodes No.
The network structure of each deck followed a hub and spoke pattern akin to that of an airline network or the internet. This gives the networks approximately a scale-free degree distribution, meaning the degree distribution follows a power law. In one sense this is an attractive feature as scale-free networks are more resilient to random failures. Unfortunately, a targeted attack that can destroy one of the main hubs will be more affective at causing the entire network to fail (Zhao and Xu, 2009). Additionally, the hub and spoke structure means the hub nodes have very high betweenness whereas the spoke nodes have low or zero betweenness.
The groups for each deck were split around these major hubs (Fig. 4) as is expected. The groups were in the same space across every deck which means switchboards and circuit breakers can be placed in roughly the same location throughout the ship and the ship can be easily split up into electrical zones. The community structure for each deck’s network is shown in Table 4.
[Table 4] Electrical system network communities.
Electrical system network communities.
The electrical system network used for the network is understood to be rather simplified and better approximates a commercial ship’s electrical system than that of a military vessel. The goal for this work was not to design the perfect electrical system, but rather to show that network theory can be useful to quickly analyze a distributed system. In this example it quickly became evident that the electrical system design was inadequate for the ship’s mission.
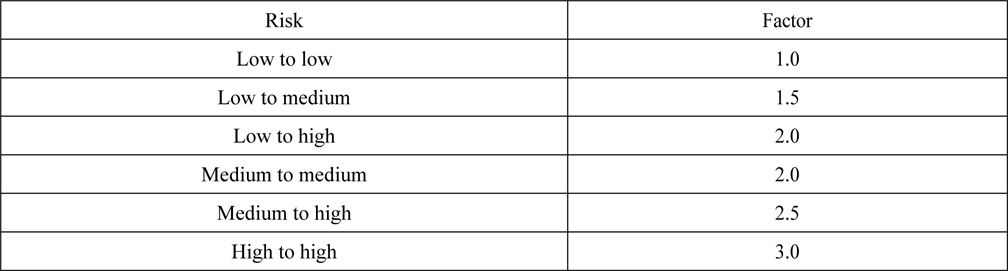
The fire fighting system network representation used the same nodes and edges as the electrical system with different weighting factors on the edges. The edge weights for the fire fighting system are the distances between nodes multiplied by a risk factor. Each node was assigned one of three levels of risk: high, medium, and low based on a combination of the nodes likelihood of damage and the nodes importance to ship’s operation. High risk spaces include engine spaces, damage controls spaces, and magazines. Medium risk spaces include galleys and the steering gear room. Berthing and general storage spaces are considered low risk. Table 5 shows the weighting factors for the fire fighting system. The fire fighting system will be driven by the location of critical mission equipment and major machinery.
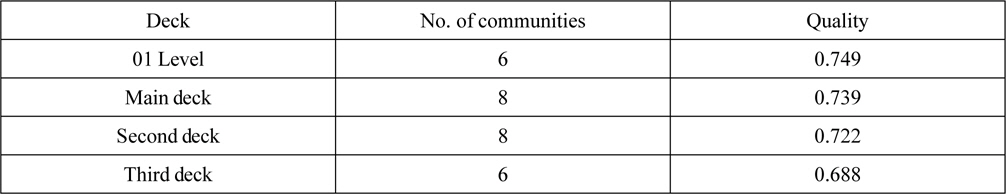
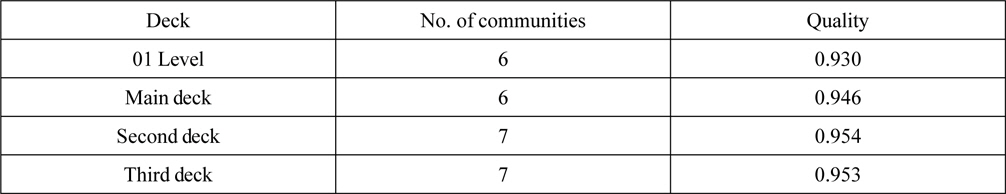
Since the fire fighting system network is a re-weighting of the electrical system network the number of nodes and edges as well as the average degree and density are the same as those reported in Table 3. The betweenness scores for the nodes are also similar: the hub nodes have high betweenness while the spoke nodes have low to zero betweenness. The fire fighting system network has the same robustness issues as the electrical system in that it is susceptible to targeted attacks due to its scale-free degree distribution. While the fire fighting and electrical networks share many similarities, they have different community structures and quality values as can be seen in Table 6.
The electrical system and fire fighting system on the 01 Level have same community structure with only a minor difference in quality due to the low voltage spaces on that level also being low fire risk spaces and high voltage spaces being high fire risk spaces. The same can be said about the communities on the second deck. The main deck has the largest difference between communities and quality due the deck machinery and weapons systems outside of the deck house which do not receive as high of a fire risk factor, almost detaching them from the rest of the main deck’s fire fighting system. On the third deck, the fire fighting system has an extra community because it breaks the port and starboard gas turbine spaces and the aft auxiliary machinery room into three different groups whereas the starboard gas turbine space and aft auxiliary are in the same electrical community.
[Table 5] Fire fighting system edge weight factors.

Fire fighting system edge weight factors.
[Table 6] Fire fighting system network communities.
Fire fighting system network communities.
AGGREGATION OF SHIP SYSTEMS
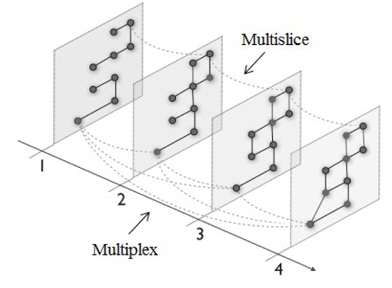
All the networks used so far in this work have been simplex networks, each node represents one type of entity and each edge represents a specific connection. These networks also can be combined together in to what is called a multislice or multiplex network. Typically, multislice networks represent time dependent changes where each slice of a network is connected only to the slices directly proceeding and following. Multiplex networks are used to represent networks where edges represent different connections between the same node. This second representation is more akin to an already-created ship design and will be used for aggregating the networks previously discussed in this paper. A brief discussion of the use of multislice networks for keeping track of design changes will follow in the future work section. Fig. 5 shows a visual representation of both a multiplex and multislice network.
Community detection in multiplex networks uses the same Louvain method as community detection in simplex networks but with a different quality function Eq. (6).

The multiplex quality function is an expanded form of the simplex function where
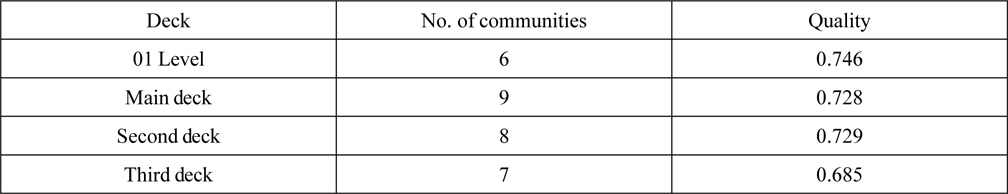
For this paper, there are three interaction networks, the previously discussed electrical system and fire fighting systems as well as a modified passageway network that uses the same nodes as the other two networks. The communities and quality for the multiplex network for each deck are presented in Table 7 with a discussion of the results following.
[Table 7] Multiplex network communities.
Multiplex network communities.
While the addition of multiplex couplings did not change the actual communities significantly, the quality of said communities increased dramatically. There are two reasons for this: first, the electrical and fire fighting system networks are similar to each other as they are built on the same nodes and edges with only a variation of edge weights to distinguish them. Second, the passageway system served to further couple the electrical and fire fighting system networks together, increasing the quality. The additional coupling added by the passageway system network also accounts for the reduction in number of communities on the main, second, and third deck. This shows that even though a system may have many independent communities when it exists on its own, once it has to interact with other systems unexpected interdependencies can occur. This additional connectedness could further reduce the systems’ robustness to targeted attacks.
When ω = 0, meaning there was no interslice connection, each individual was placed in four communities, one community for each network slice. For ω greater than 0, each node was placed in the same community across all network slices. The value of ω did not have an impact on the interslice communities; any value greater than zero yielded the same communities. This is contrary to what was found by Mucha et al. (2010) where nodes were placed in between one and four communities depending on the value of ω. The lack of variation of communities in the ship systems multiplex network for intermediate values of ω is attributed to the small network size (roughly 40 nodes versus 1640) and the relative similarity of the nominal ship system networks used in this paper.
In this paper it has been shown that network theory can be used to quickly model and analyze disparate ship systems. This network-based approach is useful in the early design stage because it can be used to evaluate ship systems, both individually and in aggregate, without relying on detailed CAD or physical models that are often too time or cost intensive in this early stage. Additionally, these concepts can be used for any ship system and limited only by a designer’s creativity in representing said system with a network.
The passageway, electrical, and firefighting systems for a nominal corvette-sized naval combatant were modeled and analyzed using basic network concepts. Using the concept of evacuation betweenness, introduced in this paper, it was found that a berthing area on the third deck was unacceptability hard to escape from. Additionally, it was determined, using betweenness centrality, that stairwells are the most important connections for a passageway system a extra care should be taken when placing them in a general arrangement. A community detection algorithm also showed the ship spaces were grouped around stairwells, once again pointing to their importance. It is believed the groups generated by this community detection algorithm can be used for simplifying discrete event simulations for egress, separating the ship into damage control zones, or in planning block breaks for ship construction.
Due to their hub and spoke nature, which is vulnerable to targeted attack, the electrical and firefighting systems proposed for this ship were found to be inadequate for the ships mission. Additionally, the community structures of both systems were found to be nearly identical. This is not acceptable as it would be very easy to simultaneously lose electrical and firefighting capabilities in one area of the ship.
Combining the networks into a multiplex network and again using a community detection algorithm identified essentially the same community structure as was found for the electrical and firefighting systems individually. The quality of the multiplex communities was higher than the quality for the communities in the individual networks which means the communities more strongly delineated for the multiplex network. This increase in quality is due to the electrical and firefighting systems being similar as well as an additional coupling, via passageways, between the two systems. This additional interconnectedness of the electrical and firefighting systems could further reduce the robustness of these system to targeted attack by making the major hub nodes even more important to the overall system.
There are two major avenues of future work. One is using the results here as a guide for automatically generating general arrangements and their respective distributed systems. Much work has already been done on creating general arrangements (Pawling, 2007; Nick, 2008; Oers, 2011), but the generation of the distributed systems within those designs has been lacking. Additionally, analysis of early stage personnel movement through these general arrangements relies heavily on 3D models and simulation (Casarosa, 2011) which is time consuming and requires a more detailed model than many concepttual or initial designs can provide.
The other possible route for future work is tracking design changes by way of a multislice network. If the structure of the multiplex ships systems networks from this paper were kept, this would entail connecting a series of multiplex networks through time which can be visualized as a series of three dimensional matrices in sequential order. It is proposed that at the most initial design only the most general of ships networks would be filled in, and as a design progressed the networks for the more specialized systems would be created. Community detection for such a model would require a new and more complex quality function. Knowing how the communities changed or did not change would be valuable for designers, as they could keep track of when adding new information or systems to a design no longer changed the overall structure. Additionally, designers could use such a system to either try to keep like parts together for production reasons (keeping all of certain subsystem contained within a production block for example) or spread the different subsystems or parts of subsystems through the ship for survivability.