Although a safety assessment of damaged ships, which considers environmental conditions such as waves and wind, is important in both the design and operation phases of ships, in Korea, rules or guidelines to conduct such assessments are not yet developed. However, NATO and European maritime societies have developed guidelines for a safety assessment. Therefore, it is required to develop rules or guidelines for safety assessments such as the Naval Ship Code (NSC) of NATO. Before the safety assessment of a damaged ship can be performed, the available damage scenarios must be developed and the safety assessment criteria must be established. In this paper, the parameters related to damage by accidents are identified and categorized when developing damage scenarios. The need for damage safety assessment criteria is discussed, and an example is presented. In addition, a concept and specifications for the DB-based supporting system, which is used in the operation phases, are proposed.
In the last decade, ships have become larger and more diversified, however, ship accidents, such as collisions and groundings, continue to occur regardless of how a ship is designed, constructed, and operated. Therefore, damage safety has become a major issue from a design and operation viewpoint. The International Maritime Organization (IMO) also requires the use of goal-based standards (GBSs) to ensure safety against major hull damages. Classification rules, such as DNV and ABS, have been established regarding the extent and location of deterministic damage due to collision and grounding (Choung et al., 2011). Chapter II-1 of SOLAS contains a regulation regarding IMO’s probabilistic damage stability requirements (IMO, 2009).
There are some safety standards or codes for naval ships such as the Naval Ship Code. This code requires adequate reserve of buoyancy and stability in all foreseeable intact and damage conditions, and also describes operational and environmental limitations (NSA, 2012). In Korea, ships including navy are designed and constructed in compliance with the guidelines of design and construction based on empirical data, which guidelines do not require damage safety assessments that consider environmental conditions such as waves and wind. In particular, in the operation phase, it is important to know whether a ship is safe in case of damage in waves. Therefore, damage safety should be considered from the design phase, and guidelines to assess damage safety are necessary.
Generally, there are two methods to ensure safety: preventing the accidents from occurring and mitigating the damage caused by accidents. The former is only available in the operation phase, whereas the latter is available in both the operation and design phases. Therefore, to increase the safety of damaged ships, designers focus more on damage mitigation than accident prevention. Focusing on damage mitigation requires prediction of the damage stability, the structural integrity, and the motion analysis for damaged ships in waves (Lee et al., 2004). Furthermore, pertinent damage scenarios must be developed prior to the damage safety assessment. However, there are insufficient data and guidelines for developing such scenarios. Instead, damage scenarios are developed from the discussion and agreement among designers, owners, or authorities, but are not always available.
This paper proposes a set of parameters that should be considered when developing the damage scenarios as well as the methods for assessing damage safety.
>
Definition of damage scenarios
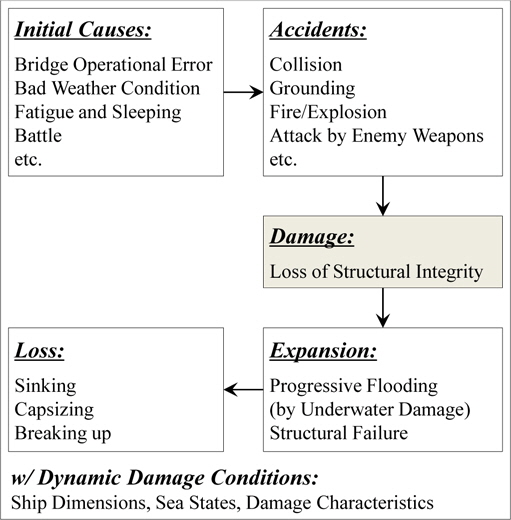
When a ship accident occurs because of several causes, both the hull and structures are damaged. These damages cause the ship to flood, which can lead to sinking, capsizing, or breaking up, as shown in Fig. 1.
In general, larger ships have sufficient strength to resist a considerable amount of structural failure. Even on smaller ships, the margin of strength can typically be augmented by executing appropriate measures after the damage occurs. Therefore, some types of structural failure can be considered minor damage compared to flooding. However, structural failure can be more critical in the case of grounding because statistically, the damage caused by grounding has major effects on the midship region (Zhu et al., 2002).
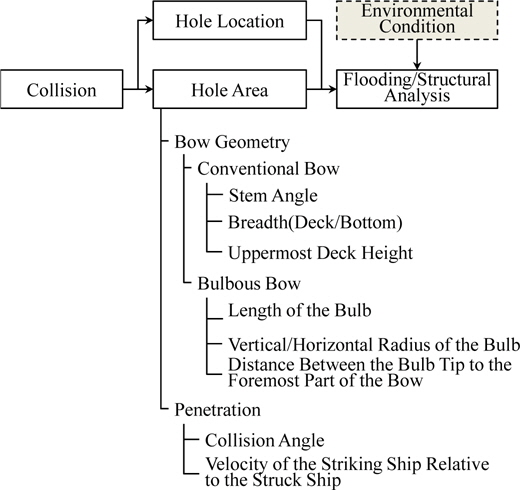
Damages can be defined as a function-failed condition of ships caused by these accidents. Accidents can be caused by operational errors, crew fatigue, sleeping, bad weather, or battle, and there are numerous potential accident categories. However, statistically, collision and grounding are the most common accidents (HARDER, 2003), and attack by enemy weapons are the most common accidents for naval ships. Therefore, in this study, damages are defined as hull damages caused by these three accident types. The definition of damage scenarios is a limited set of conditions, which comprise the ship dimensions, sea states, and damage characteristics, to predict the damage severity and assess the safety of the damaged ship. The damage conditions used to predict the expansion of and loss due to damage are composed of a combination of the ship dimensions, sea states, and damage configurations, such as the location and extent of a damage hole. The ship dimensions can be represented by the loading conditions and geometrical characteristics, such as the hull, length, breadth, draft, KG, and compartment arrangement. The sea states refer to the wave conditions of height, length, and period. Furthermore, the angle of wave heading also has to be considered because it is a critical characteristic from a ship motional perspective.
>
The accident parameters of damage scenarios
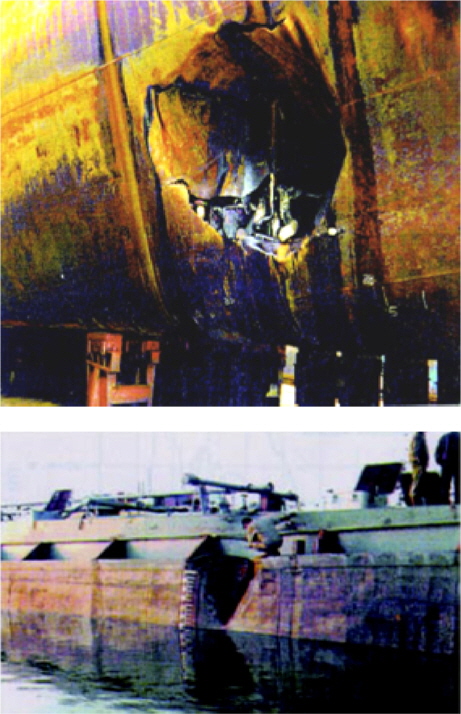
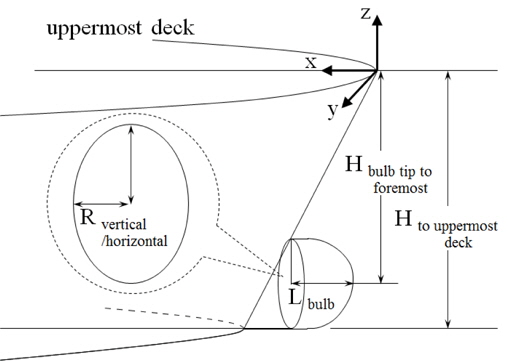
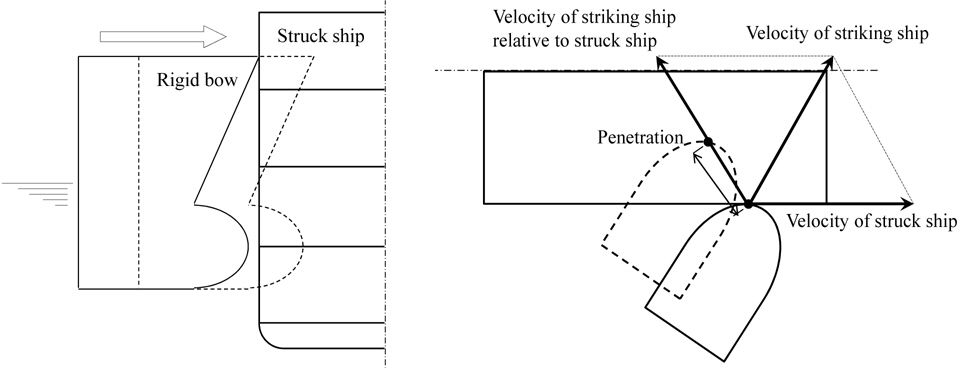
From studies of pictures of previous collision accidents (considering only ship-ship collisions), the damage hole has the bow shape of the striking ship, as shown in Fig. 2 (Lützen, 2001). Therefore, when developing the damage scenarios, the parameters related to the damage caused by a collision are the geometry of the bow of the striking ship and the collision angle and velocity of both vessels. The bow can be separated into conventional and bulbous bows. The bulbous bow can be divided into conventional bows and bulbs. The basic data used to describe the geometry of the bulb consist of the length and vertical/ horizontal radius of the bulb and the distance between the bulb tip and the foremost part of the bow, as shown in Fig. 3 (Lützen, 2001). The penetration is determined using the collision angle and velocity of the striking ship relative to the struck ship (Zhang, 1999).
In other words, it can be assumed that the collision damage configurations are determined using the bow geometry of the striking ship and the penetration conditions, as shown in Figs. 4 (Zhang, 1999) and Figs. 5.
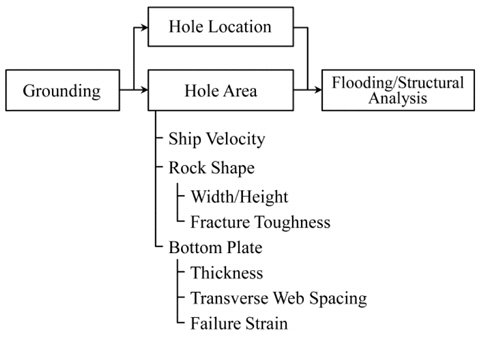
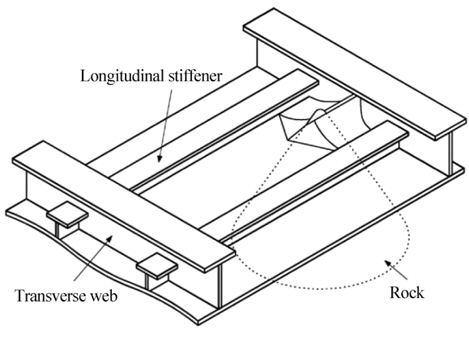
Grounding damages are described using the longitudinal location of the damage and the number of spaces affected. According to the statistics (Zhu et al., 2002), for more extensive damage, the distribution is as expected: most grounding incidents cause damage around the midship and midship-to-fore region because most ships operate with a bow up trim. This observation has significant strength implications because damage to the midship region will significantly reduce the global strength capability, which will be important when recovering from a grounding incident. The damage extents are defined as the longitudinal damage length and width, which are determined using the ship velocity, underwater rock width/height/toughness, thickness of the bottom plate, transverse web spacing, and failure strain, as shown in Fig. 6 and Fig.7 (Zhu et al., 2002).
For naval ships, it is necessary to consider the attack damage caused by enemy weapons in addition to collision and grounding. At the moment, design rules for naval ships apply the criteria only to evaluate the adequate damage stability performance based on the righting arm curve. The damage safety of naval ships in reference to IMO research is gaining interest (Riola and Perez, 2009).
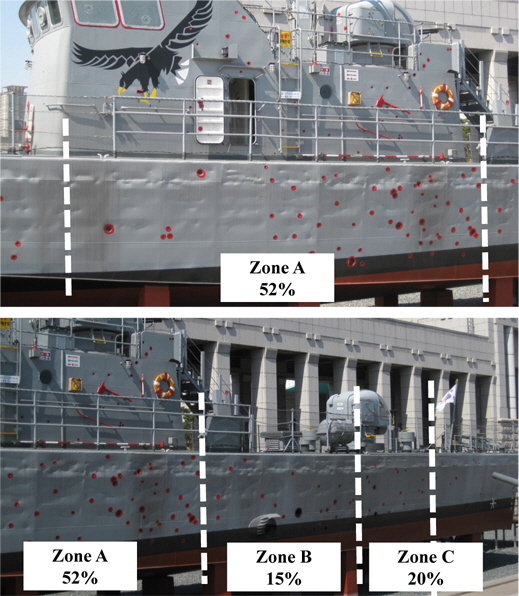
There are two methods to consider attack damage in naval ships. The first method is to consider the damage by threat weapons of individual ships, such as a missile, torpedo, or mine. When a naval ship is designed, the possible damage sizes of the explosion ellipsoid volume and pressure (weapon strength) by the threat weapons are identified and the response strategies are developed. If these damages are considered and assessed from the design phase, it can improve the survivability. The other method is to consider multiple simultaneous attacks by the guns of a warship (see Fig. 9), which is a major threat for smaller naval ships that engage in an approaching battle. For instance, Fig. 8 illustrates the battle case for a medium-sized patrol boat (approximately 150
For instance, from pictures as shown in Fig. 8, total damaged area is 0.157
There are only fragmentary cases to support this methodology. However, if these types of cases are collected and managed systematically and consistently, they can provide a feasible alternative for assessing the damage safety of naval ships.
SAFETY ASSESSMENT OF DAMAGED SHIPS
>
Proposal of a criterion for damage safety assessment
As mentioned earlier, the damage configurations used to predict damage severity can be estimated using theoretical models, empirical formula, accident statistics, and experiments.
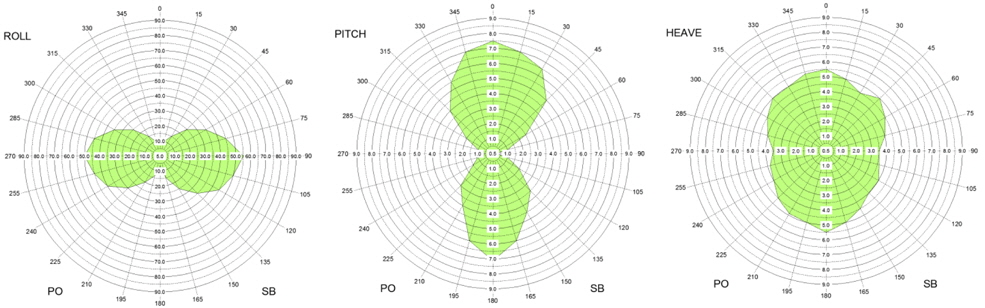
However, there are no references or guidelines to assess whether a ship is safe after damage. Therefore, a criterion that uses the concept of a polar chart is proposed as shown in Fig. 10. This criterion is only applicable when assessing damage safety from a behavior perspective.
The polar chart is plotted by developing the damage scenarios and quantifying the ship motions depending on the wave heading angles. These motional graphs can be expressed as the behavior safety areas
>
Concept of an onboard supporting system for damage safety operation
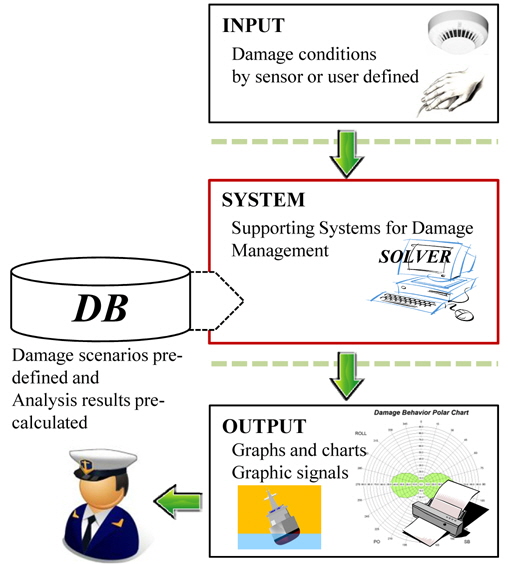
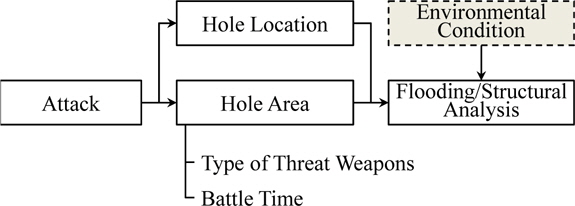
The traditional methods of damage management are labor intensive and time critical. The Damage Control (DC) officer must receive, filter, analyze, and react to information from multiple sources, which can sometimes be contradictory. To help the DC officer to make a decision, several DC supporting systems are developed and provided based on the rapid advancements of computer-based systems in this area (Yvan and Jan, 2010). These types of supporting systems should guarantee high reliability, rapid response, easy usage, and simple maintenance. Although computer technology has advanced, it is still difficult to assess the damage safety using real-time analysis because of the calculation time, equipment reliability, and lack of engineering knowledge among the captain, officers, or crews.
The existing DC systems such as the Battle Damage Control System, L-3 MAPPS (BDCS) provide information of emergency situations and communication by integration with several types of sensors, CCTVs, large monitors and so on. These integration systems cannot work if the systems fail due to damage. Therefore, a pre-defined and analyzed support system based on a database can be a good solution if it operates in parallel with the existing DC systems, as shown in Fig. 11.
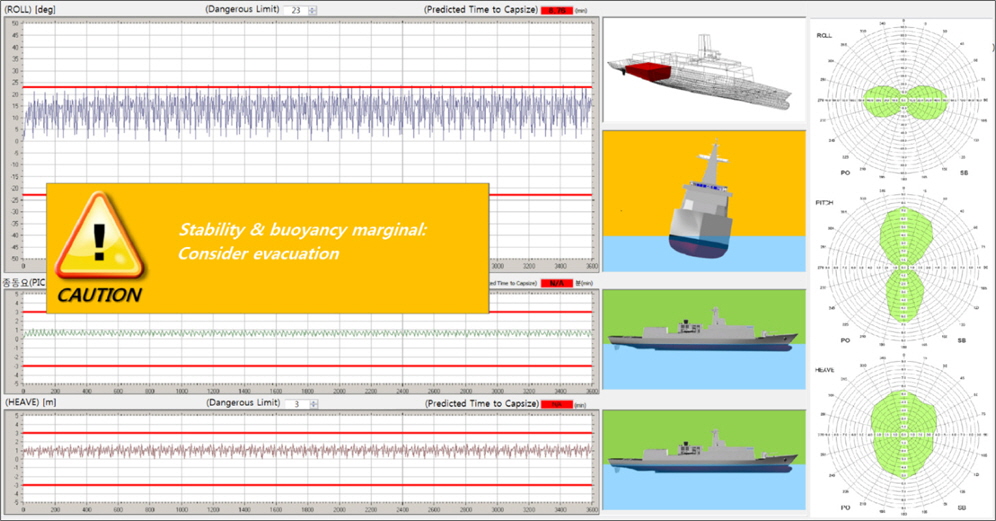
The first aid of the supporting systems is to support rapid decision making by presenting the analysis results as graphs, charts, and some signals, which express the current status of a damaged ship and predict the damage progression. Fig. 12 provides some examples of the graphical results. Motional graphs (the roll, pitch, and heave are shown at least) provide the information of the time-domain behavior prediction, and the colored (green/yellow/red) signal images indicate the status of the ship and the level of danger. Finally, the polar charts provide information on the behavior safety depending on the wave heading angles and help to turn a ship to the safer wave heading angle from a behavior perspective.
Studies on damage safety that aim to make ships safer are ongoing; in particular, there are many outstanding theories, formulas, and technical tools on this topic. This paper proposes factors that can be used to develop damage scenarios for collision, grounding, and attack accidents. In addition, a criterion that can be used to assess damage safety using polar charts from a behavior perspective is proposed.
Damage safety assessment is not only required in the design phase but can also be applied in the operation phase as an onboard support system. Such systems should guarantee high reliability and rapid response and provide intuitive, useful information to the decision makers in emergencies. Some graphical methods for describing the status of the damaged ship and the danger level are also proposed.
This study considers the methodologies available for damage safety assessment considering environmental conditions and its application. Future research on this topic should gather additional data and validate the proposed methodology.