High-speed marine vehicles can take advantage of aerodynamically supported platforms or air wings to increase maximum speed or transportation efficiency. However, this also results in increased complexity of boat dynamics, especially in the presence of waves and wind gusts. In this study, a mathematical model based on the fully unsteady aerodynamic extreme-ground-effect theory and the hydrodynamic added-mass strip theory is applied for simulating vertical-plane motions of a tunnel hull in a disturbed environment, as well as determining its steady states in calm conditions. Calculated responses of the boat to wind gusts and surface waves are demonstrated. The present model can be used as a supplementary method for preliminary estimations of performance of aerodynamically assisted marine craft.
Ultra-fast boats and wing-in-ground craft utilize aerodynamic lift to either partially or completely support the vehicle’s weight at sufficiently high speeds. This usually results in increased lift-drag ratio. However, such marine vehicles can also become less stable and respond more dramatically to wind gusts and surface waves (Matveev and Kornev, 2013).
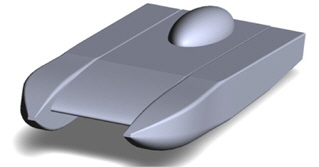
The main subject of this paper is the modeling of the vertical-plane dynamics of a tunnel hull (Fig. 1), which is one of the most common configurations of fast boats with aerodynamic unloading. Side planning hulls on this boat remain in contact with water most of the time, whereas the above-water platform generates aerodynamic support. Linear stability of a tunnel hull was analyzed by Kornev et al. (2010). Some aspects of aero-hydrodynamics, stability and dynamics of other aerodynamically assisted marine craft were considered by Nangia (1987), Collu et al. (2010), Gu et al. (2011), and Matveev (2012).
To calculate aerodynamic lift on a platform moving above but close to the water surface, the extreme-ground-effect theory can be applied (Rozhdestvensky, 2000). Previously, Chaney and Matveev (2012) utilized a steady quasi-one-dimensional formulation of that theory. In this paper, a fully unsteady nonlinear model with transverse variation of airflow and pressure is implemented. The unsteady hydrodynamic forces on planning hulls are determined with the commonly used added-mass strip theory (e.g., Martin, 1978). The next section outlines the mathematical model, and numerical results for a selected configuration are presented in the following section.
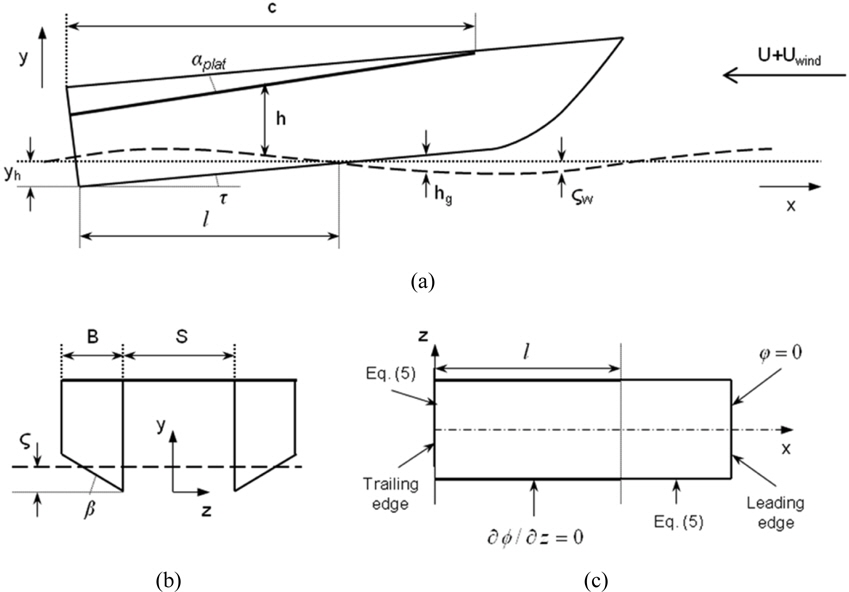
A schematic of a tunnel hull with simplified geometry is given in Fig. 2. Since only vertical-plane motions of this craft at relatively small pitch angles τ are considered here, the vehicle dynamics is governed by the following equations,


where
In the Extreme-Ground-Effect (EGE) theory approximation (Rozhdestvensky, 2000), i.e., when the clearance between the platform and surface is much smaller than the platform length, the aerodynamic lift is predominantly caused by increased pressure underneath the platform. The governing continuity equation for the under-platform quasi-two-dimensional airflow under inviscid and incompressible assumptions is

where

where
The velocity potential

where
The instantaneous platform lift


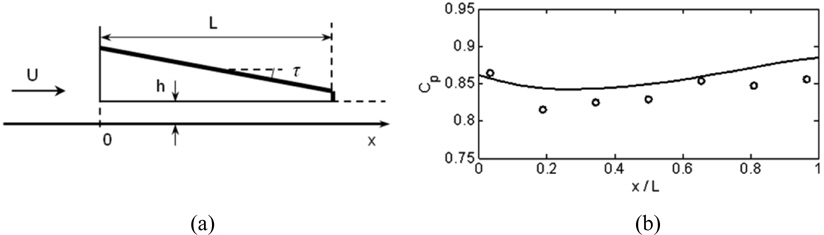
The aerodynamic extreme-ground-effect theory is relatively new and only a few validation cases can be found in the literature (Rozhdestvensky, 2000; Soderlund and Matveev, 2010). Here, a comparison with another experiment is demonstrated. Gallington and Miller (1970) carried out wind tunnel tests with a ground-effect platform, depicted in Fig. 3(a). The model had side plates and a trailing-edge interceptor (short vertical plate). The experimentally measured pressure coefficient,
Hydrodynamic forces on the planing hulls are determined with the standard added-mass strip theory (Martin, 1978). The hulls are divided into a number of transverse sections, and a local hydrodynamic force exerted normally to the hull surface is found from a local change of the water flow momentum. The total force is then determined by integrating over the wetted keel length

where

where


where
The water velocity normal to the hull that appears in Eq. (10) is determined via equation suggested by Martin (1978) under the assumption of small trim angles,

where

where
The added-mass theory has been previously validated for a variety of planing hulls (e.g., Martin, 1978; Payne, 1988). However, a combination of this theory with the aerodynamic model employed in this study has not been validated yet due to absence of complete experimental information for aerodynamically assisted boats in the open literature.
The propulsor thrust force is assumed to be parallel to the hull keel line. Additional drag force components, including hydrodynamic drag of appendages, friction drag on the wetted hull surface and aerodynamic drag of the boat superstructure, are modeled in a simplified form,

where
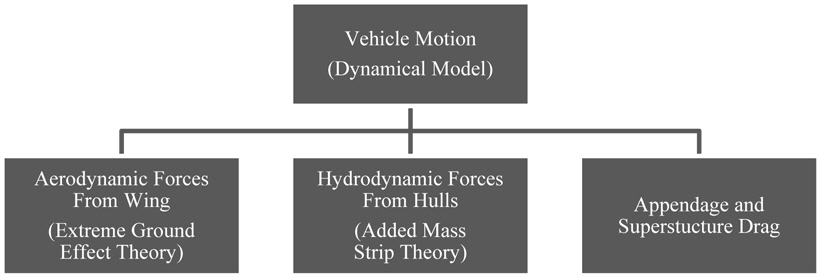
With given expressions for all forces, the governing dynamics equations (Eqs. (1)-(3)) can be integrated in time to predict the boat vertical-plane motions. The computational model hierarchy is schematically depicted in Fig. 4.
The configuration of the boat modeled in this paper is selected to resemble off-shore racing tunnel hulls. Simplified geometry is chosen to avoid unnecessary complexity in modeling and result presentation. Side hulls have single deadrise, as is typically used in such boats to reduce spray in the tunnel. Hull cross-sections are uniform and do not incorporate steps. The platform has a chord of 10
[Table 1.] Main parameters of the considered tunnel hull.
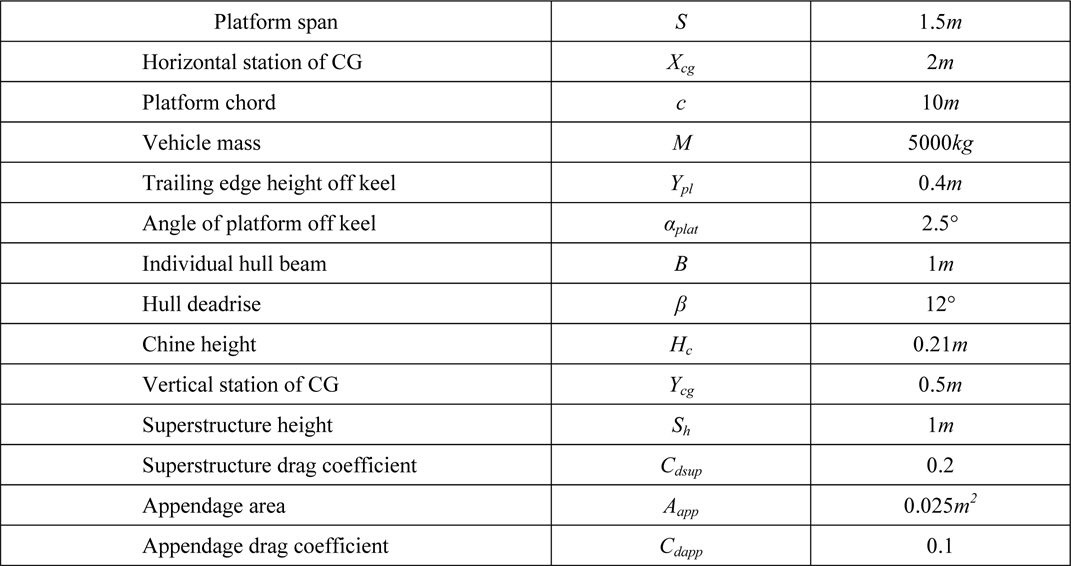
Main parameters of the considered tunnel hull.
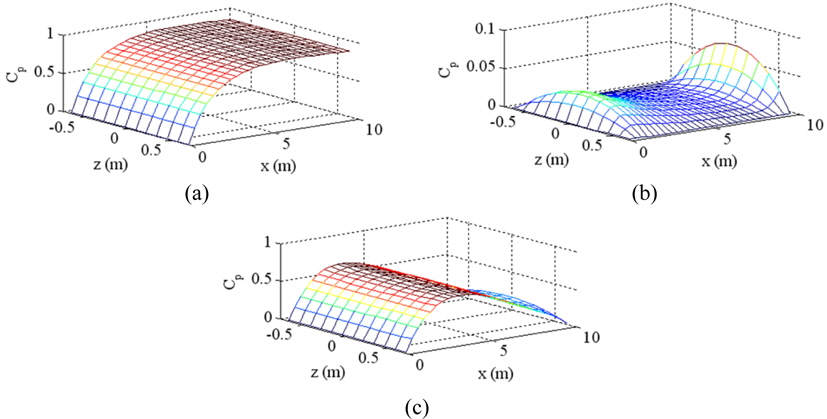
One of the novelties of this paper is the implementation of EGE theory for finding aerodynamic lift on the platform. Sample calculated pressure distributions are shown in Fig. 5. These results correspond to the geometry of the tunnel hull boat operating in a characteristic condition with completely sealed side plates (Fig. 5(a)), completely open side plates (Fig. 5(b)), and partly open sides (Fig 5(c)). For the partially sealed case, the aft 1.6-
The completely sealed condition, shown in Fig. 5(a), displays the anticipated 2D pressure distribution. With no lateral flow allowed, velocity and pressure vary only along x. For this condition, the trailing edge gap is sufficiently small to cause significant air stagnation and high pressure in the front part of the platform. Fig. 5(b) shows the pressure distribution under the platform for the case of no side hulls. Unimpeded lateral air flow results in small pressure recovery under the platform. The gage pressure is much smaller than in the case of sealed sides. A typical pressure distribution with partially restricted sides is depicted in Fig. 5(c). The most pressure is recovered at the sections where the hulls intersect the water surface.
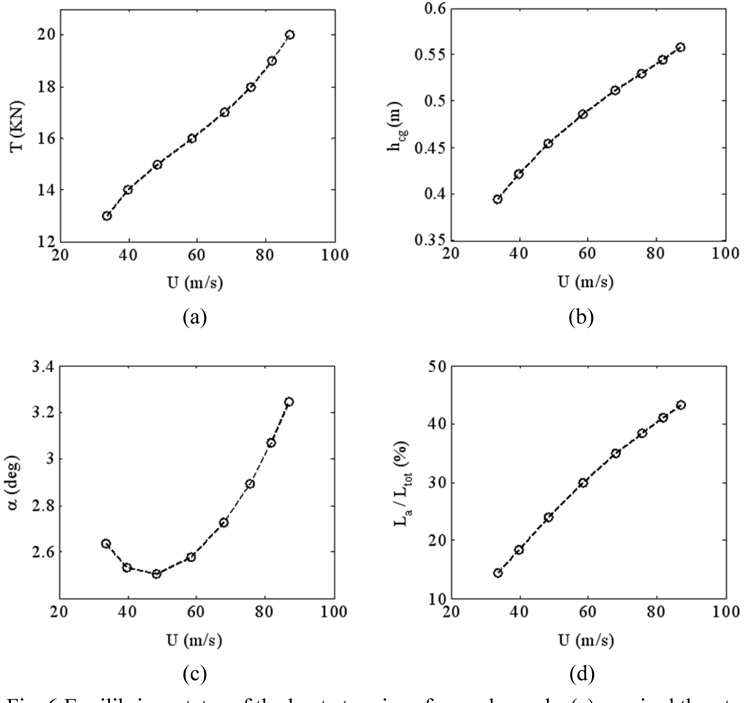
Calculations have been performed to determine equilibrium states for the specified tunnel hull boat. The required thrust,
Fig. 6(b) shows the CG height variation with speed. Equilibrium ride height increases with forward velocity. The change of the keel trim angle is illustrated in Fig. 6(c). This relation has a strong curvature, with high trim angles at either extreme. At low velocities, high trim angles are required to maintain sufficient lift to remain afloat. Trim angle initially decreases with forward speed, until the aerodynamic lift starts to become substantial at around 50
Fig. 6(d) illustrates the aerodynamic lift as a percent of the total lift. In equilibrium, the vehicle total lift always equals to its weight, therefore, this figure can be also used to quantify the ratio between aerodynamic and hydrodynamic lift components. At the highest speeds studied, the aerodynamic lift supports nearly half of the boat weight. Higher velocities are possible with sufficient thrust; however, the equilibrium pitch angle of the platform starts to become too large for the mathematical model to remain valid.
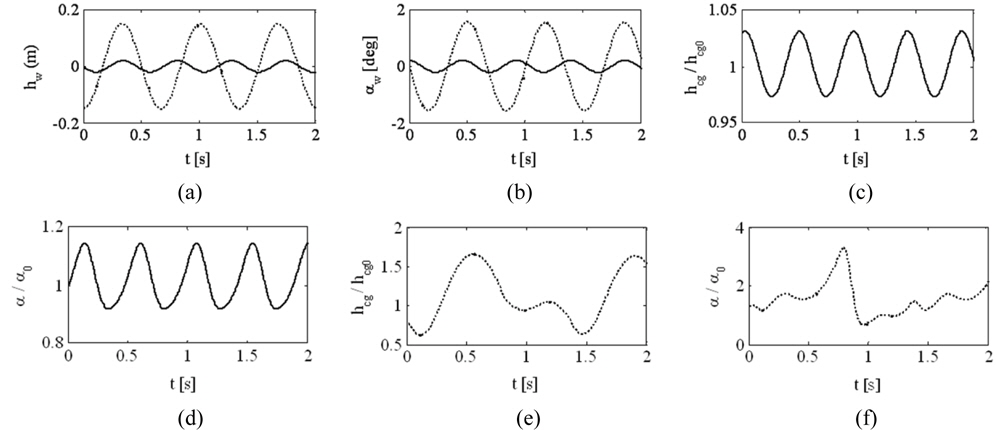
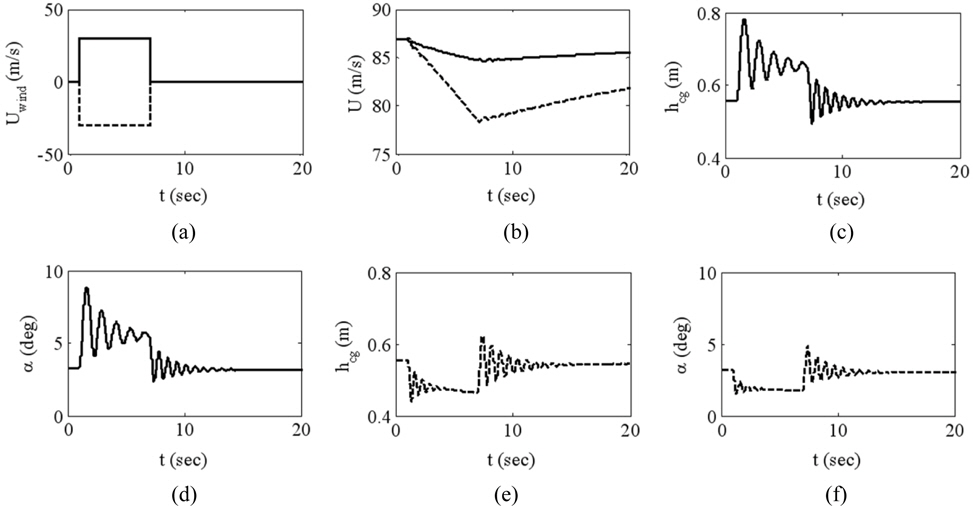
Time-domain simulations have been conducted for the tunnel hull boat moving under the influence of wind gusts. The vehicle’s response in velocity, trim, and CG height to both head and following gusts is shown in Fig. 7. The simulations start from an equilibrium state corresponding to thrust level of 20
The vehicle forward velocity decreases in response to both head and following wind gusts for the given equilibrium state (Fig. 7(b)); however this trend can change if the boat is perturbed from other equilibriums. The head gust increases aerodynamic lift which reduces lift-induced drag. However, this reduction is outweighed by the increase of superstructure drag. Very small surge oscillations are experienced during return to equilibrium. Time required for the boat speed to return to equilibrium is much longer than characteristic motions of heave and pitch. For the following wind gust, the reduction in superstructure drag is outweighed by the increase of hydrodynamic drag due to deeper hull submergence (Fig. 7(e)).
As seen in Figs. 7(c) and (d), the boat CG height and trim angle both increase in response to a head gust. Higher aerodynamic lift due to the wind gust decreases the required hydrodynamic lift. Additionally, the location of the aerodynamic center of pressure forward of the hydrodynamic center of lift results in an increased trim angle in response.
Figs. 7(e) and (f) show the vehicle response in CG height and pitch to a following wind gust. Opposite of the head gust, the following gust reduces both center of gravity height and trim angle. Reduced aerodynamic lift causes the vehicle to settle into the water, and increased hydrodynamic lift shifts the total center of lift backward, resulting in a more nose-down attitude. Like the head gust case, the following gust also produces attenuating oscillations in pitch and heave after the application and stop of the wind.
Another dynamic regime of interest is the boat response to water waves. A study is performed to show heave and pitch motions in response to head waves of both 2
The boat exhibits nearly linear behavior for the 2-
Very different results are demonstrated in Figs. 8(e) and (f) for the case of the 15-
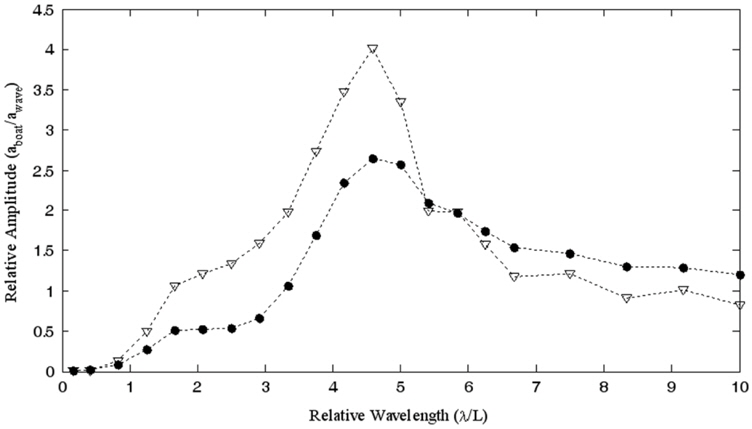
Simulations have been also performed on the boat to study its motions in a range of wavelengths. The boat thrust is fixed at 17
A simplified mathematical model developed in this work can be used for producing quick simulations of vertical-plane dynamics of tunnel hull boats in wind gusts and waves, as well as for determining their equilibrium states in calm conditions. When fully validated, the current method can be applied for design optimization of marine craft with aerodynamically supported surfaces operating in pronounced ground effect. Results presented in this study illustrate calculated vertical-plane responses of a selected boat configuration to head or following wind gusts and regular waves, acting separately. Since wind gusts and waves are often present simultaneously, the current method can be also used in the future to identify dangerous regimes in such conditions and suggest operational actions for reducing extreme motions and loads on aerodynamically unloaded boats.
Future development of the mathematical model can include more degrees of freedom, addition of control surfaces, and large-amplitude motions that may possibly lead to accidents, such as boat flipping and slamming. Application of Computational Fluid Dynamics (CFD) methods can improve accuracy of the model’s components, although complete unsteady CFD simulations for an entire air-assisted boat would be very costly, especially in a broad range of system conditions. While the present model’s expressions for the different forces have been previously validated, experimental validation of the combined dynamic model for a tunnel hull requires complete test information for boats of this type, which is currently unavailable in the open literature. Hence, the applicability of the present method for design of actual boats is rather limited. Calculation results obtained with this model will need further experimental verification.