The effects of hull-girder vibration on the fatigue strength of a Post-Panamax container ship are discussed in the present paper. Firstly, the short-term sea states are categorized according to the occurrence probability of each sea state. Time histories of hull-girder stress in short-term sea states are calculated by means of a nonlinear simulation code of ship response assuming that the hull-girder is rigid and flexible. Then, the calculated stress peaks are processed by the rainflow counting method, where two different counting procedures are used based on the considerations of crack propagation behaviors. Finally, the fatigue damage in life time of the ship in each categorized short-term sea state is estimated by means of Miner's rule. Based on the calculated results, the effects of hull-girder vibrations on the fatigue damage are clarified by disaggregated damage from short-term sea state.
According to the current trend of larger size container ship, the effect of hull-girder vibrations such as springing and whipping on the fatigue strength becomes the main concern of classification societies as well as ship structural designers. This is because the wave-induced hull-girder vibrations are likely to occur due to relative decrease of flexural rigidity of larger ships, and this fact has raised fears that the high frequency stress components of vibration increase the fatigue damages. In spite of the fear, however, serious damages attributed to such hull-girder vibrations were rarely reported in well-maintained properlyoperated ships up to now.
The fatigue strength of a ship is usually evaluated by using Miner’s rule. Miner’s rule is based on the linear cumulative law and the fatigue damage is considered to be proportional to the ratio of the number of applied stress cycle to that to cause failure at any stress range. This means that the small amplitude components are still effective on the fatigue damage, particularly in the case where the number of occurrence is large enough.
The fatigue strength has well been estimated by Miner’s rule in a practical sense so far. This is because the calibration of the method using accumulated experiences and past data was rightly done. However, the applicability of Miner’s rule to the case where the smaller amplitude higher frequency stress components are superposed on the larger amplitude lower frequency stress components is not clear at the moment. Actually, through fatigue tests and numerical simulations, it was shown recently that the smaller amplitude higher frequency stress component does not affect so much as is expected (Matsuda et al., 2011; Gotoh et al., 2012; Kitamura et al., 2012; Sumi, 2012).
In the present paper, the effects of hull-girder vibration upon fatigue strength of a Post-Panamax container ship are investtigated. Nonlinear time-domain simulations of ship response are performed in short-term sea states, and the obtained stress histories are processed by means of the rainflow counting method. The cumulative fatigue damage factors are then evaluated by using Miner’s rule disaggregated by short-term sea state. Through the calculated results, the characteristics of fatigue damage factor estimated by using Miner’s rule is discussed in the case where the smaller amplitude higher frequency stresses are superposed on the larger amplitude lower frequency stresses.
OCCURRENCE PROBABILITY OF SHORT-TERM SEA STATE
Assuming that the lifetime of a ship is 25 years and the mean duration of a short-term sea state is roughly 3 hours, the occurrence probability of a short-term sea state is given by (Fukasawa et al., 2007).

Eq. (1) means that the total number of short-term sea states which a ship encounters in her lifetime can be considered to be the order of 105. The occurrence probability of a short-term sea state is given in a wave scatter diagram such as the IACS North Atlantic wave scatter diagram.
In order to categorize the short-term sea state according to the occurrence probability, the following variable

where
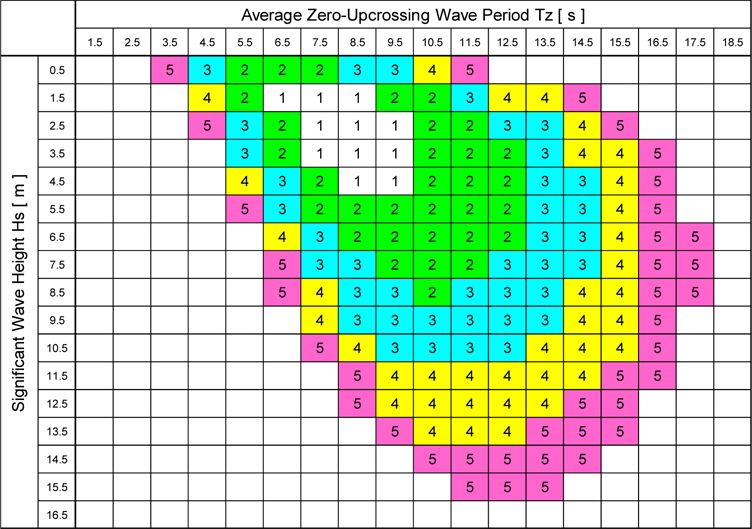
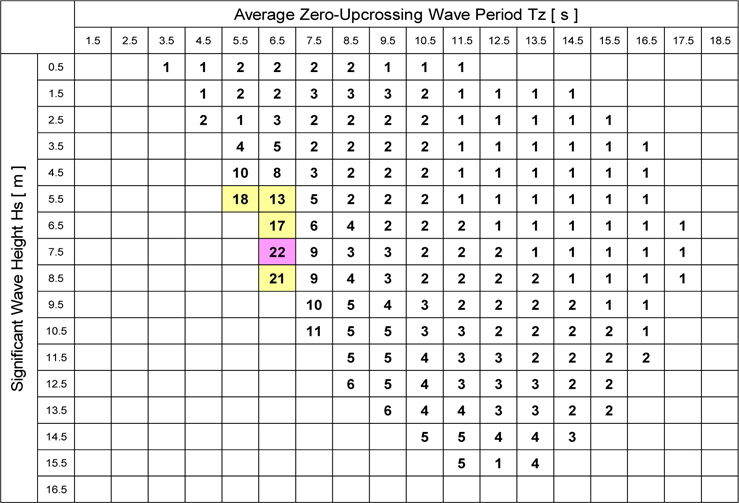
Occurrence probability index of a short-term sea state, K, obtained from IACS North-Atlantic wave scatter diagram.
HULL-GIRDER STRESS CALCULATIONS
The effect of hull-girder vibrations upon fatigue damage of a ship will be investigated in the present paper. A Post-Panamax type container ship is used in the study, of which particulars are
Ship responses in waves are more or less nonlinear and the strongly nonlinear phenomenon such as slamming occasionally occurs in rough seas. Moreover, hull-girder vibrations such as springing and whipping come to be significant with the decrease of flexural rigidity caused by scale-up of the ship. A computational code TSLAM, therefore, is used in the present paper in the calculation of nonlinear ship response in irregular waves because of its robustness in strong nonlinear phenomena. TSLAM is based on the time-domain nonlinear strip theory and the nonlinearities with respect to slamming impact and resulting whipping vibrations can be taken into account (Yamamoto et al., 1983). The hull-girder of the ship is considered to be both a rigid body and a flexible body to clarify the effect of vibratory stress component of the ship upon fatigue damages. As for the structural damping, the logarithmic decrement of vibration was taken as 0.05 for the flexible ship by reference to measured results in actual ships.
Numerical simulations are performed to calculate the stress due to longitudinal vertical bending moment at midship in irregular waves. The calculated vertical bending moment is converted to the hull-girder hot-spot stress with the stress concentration factor of 1.5. Numerical simulations are carried out over 3 hours in each short-term sea state, because the mean duration of a short-term sea was assumed to be 3 hours.
A ship in service experiences complex load histories and the resulting stress amplitude is not constant, which bears little resemblance to the constant amplitude fatigue test. In order to apply Miner’s rule in the assessment of the fatigue life of a ship, the complex stress time history have to be broken down into recognizable stress cycles by using a ‘cycle counting method’. The cycle counting is a procedure which is carried out to convert a complex stress history into a sequence of identifiable stress cycles; the complex stresses are divided into blocks of constant amplitude, and the service stresses are expressed in terms of numbers of complete cycles at particular stress levels.
The rainflow counting method is the most popular counting technique in the analysis of fatigue data, where a stress spectrum is reduced into a set of simple stress reversals (Matsuishi et al., 1968). The rainflow algorithm can be explained by an analogy to the flow of rainwater over a series of rooftops. The water flows down from each turning point and continues until either it is interrupted by flow from above or it reaches a turning point which is larger than the one that started. By using the rainflow counting method, the stress range against number of cycles occurring at that range can be obtained.
The fatigue life of a structural member subjected to the stress sequence is then estimated by summing up the calculated fatigue damage arising from each block of cycles using a cumulative damage rule.
FATIGUE DAMAGE ANALYSIS ACCORDING TO MINER’S RULE
The damage rule which is most widely used nowadays is Palmgren-Miner linear cumulative damage rule, or simply called as Miner’s rule. This rule states that the fatigue damage from any particular stress range is proportional to the ratio of the number of cycles applied at that stress to the number of cycles which is required to cause failure. The cumulative fatigue damage factor

where
The relationship between nominal stress range and number of cycles to failure for any particular type of loading can be established by a series test under the constant amplitude loading conditions of identical specimens in the laboratory, and the S-N curve is produced from the test results. The fatigue endurance of a structural member subjected to a particular cyclic stress can be estimated by using the S-N curve for that geometry of the structural member. The general equation relating the applied stress range and fatigue life is given by

where
Miner’s rule proves to be reasonably accurate if the applied stress spectrum resembles narrow-band random loading (Maddox, 1991). The significant characteristic of such a spectrum is that the stress range changes gradually, with the results ‘crack growth retardation’ is not significant. In the case of a ship, the wave-induced slowly-varying stress spectrum can be considered to be narrow-banded in a short-term sea state. The fatigue strength due to such stresses has well been estimated by Miner’s rule in a practical sense, with the aid of the calibration of the method using accumulated experiences and past data. However, as a ship is supposed to encounter a lot of different short-term sea states, the stress spectrum is unlikely to be narrow-banded in the long-term sense. Moreover, the stress spectrum is no more narrow-banded when the hull-girder vibrations such as whipping or springing occur. The applicability of Miner’s rule has not stringently been verified in this case.
SIMULATED RESULTS AND CONSIDERATIONS
The stress history of the ship in each short-term sea state was firstly calculated by means of nonlinear simulations of ship response. The calculated stress peaks were processed by the rainflow counting method, and the stress ranges against number of cycles occurring at that ranges were obtained. The fatigue damages were then estimated by applying Miner’s rule in each shortterm sea state.
>
Hull-girder vibration in each short-term sea state
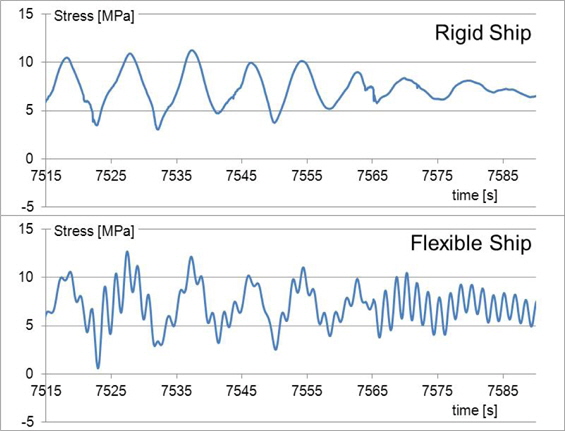
Firstly, the effect of the hull-girder vibrations to the fatigue damage factor is investigated in the disaggregated short-term sea state. For this purpose, the calculated results assuming the ship’s hull to be a rigid body are compared with the results assuming that to be a flexible body. The rigid ship is the rigid limit of the hull and there is no vibration expected.
Table 2 shows the rounded ratio of the fatigue damage factor in flexible body assumption to that in the rigid body assumption, where the ship is travelling in each short-term sea state for 3 hours. It can be seen from the table that the ratio is large around the sea state of

Ratio of fatigue damage factor in flexible body assumption to that in rigid body assumption in short-term sea state (Rounded to unit).
>
Fatigue damage factor disaggregated by short-term sea state
As was mentioned before, the total number of occurrence of short-term sea states in the lifetime of a ship can be considered to be the order of 105. In the present paper, therefore, the total number of short-term sea states a ship encounters is assumed to be
Firstly, in the case where the ship’s hull is assumed to be a rigid body, the fatigue damage factor in each short-term sea state is shown in Table 3. The largest fatigue damage can be seen in the short-term sea state of
[Table 3] Fatigue damage factor in each short-term sea state (Rigid body, Ntotal = 100,000).
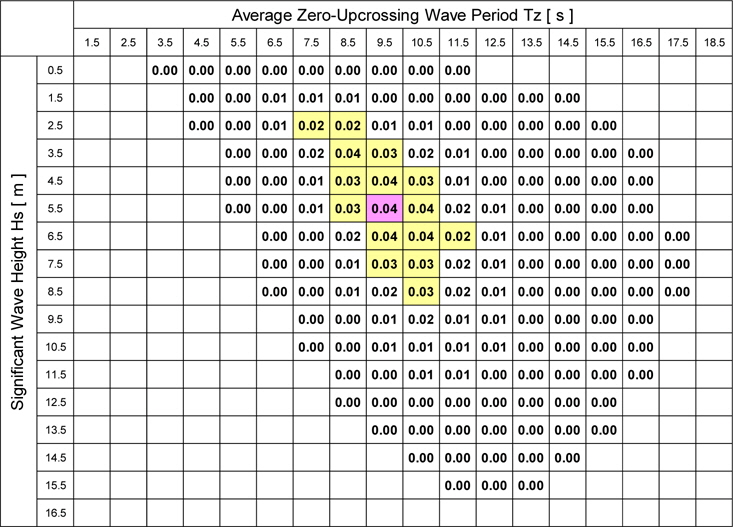
Fatigue damage factor in each short-term sea state (Rigid body, Ntotal = 100,000).
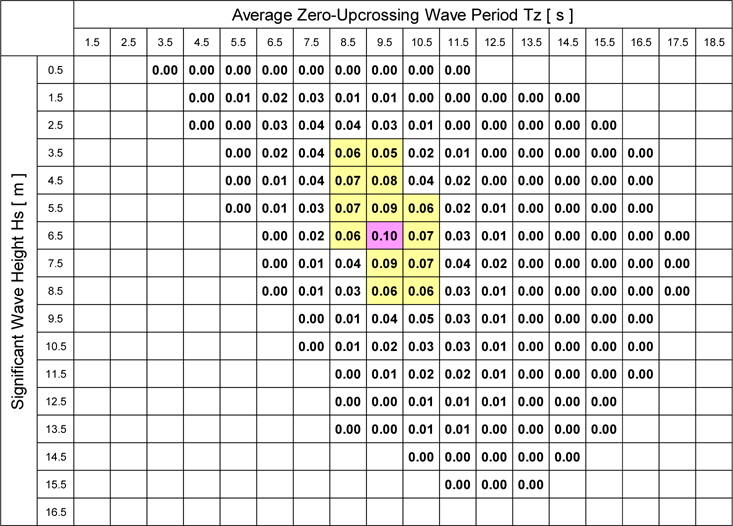
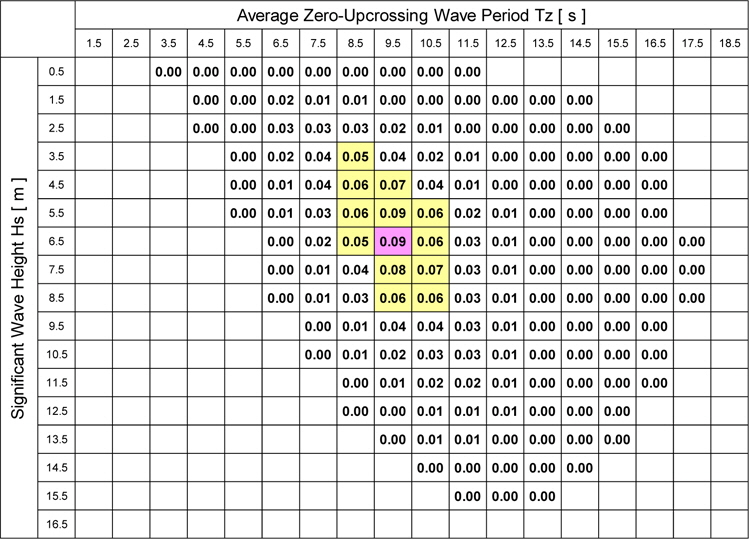
On the other hand, the fatigue damage factor in each short-term sea state is shown in Table 4, where the ship’s hull is assumed to be a flexible body. Comparing Table 4 with Table 2, the wave period of the sea state where the fatigue damage factor becomes larger is shifted to the longer wave period side due to the occurrence probability of the sea state, and the largest fatigue damage factor appears nearly in the same short-term sea state as that of the rigid body assumption case shown in Table 3. However, the fatigue damage factors are increased due to the flexibility of the hull; that is, the largest fatigue damage factor is 0.098 to be exact in the sea state of
[Table 4] Fatigue damage factor in each short-term sea state (Flexible body, Ntotal = 100,000).

Fatigue damage factor in each short-term sea state (Flexible body, Ntotal = 100,000).
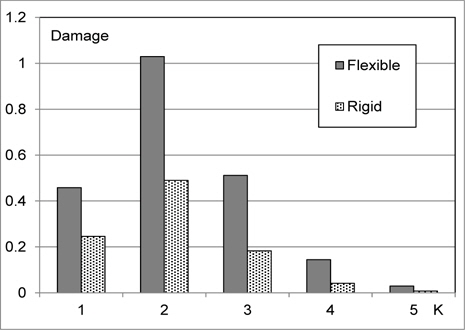
The cumulative fatigue damage factors in each short-term sea state category of the occurrence probability of 10
>
Effect of hull-girder vibration on fatigue damage factor
The fatigue damage factor is larger in the short-term sea state category of occurrence probability of 10-2 than that of other sea state categories as was shown in Fig. 2. The reason of this result will be considered in the followings.
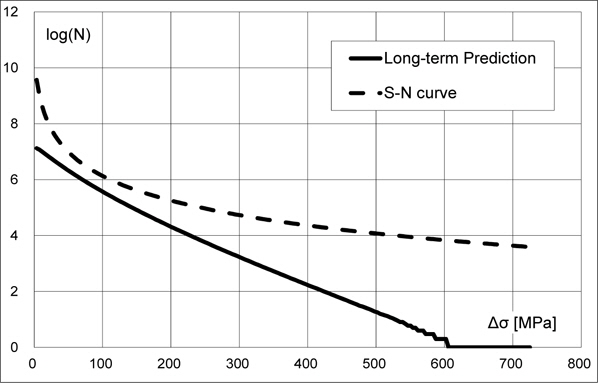
As the S-N curve falls to a straight line by using logarithmic scales, the S-N curves are usually plotted in a double logarithmic chart of stress range and fatigue life. The long-term prediction results of the applied stress, on the other hand, are usually plotted in a semi-logarithmic scale. For a better understanding of the relationship between the long-term prediction result and the S-N curve, it would be convenient that the S-N curve is plotted in the same semi-logarithmic chart as the long-term prediction result. Fig. 3 shows the comparison of these curves, where the abscissa is the wave-induced linear stress range and the ordinate is the logarithm of the number of stress cycles. In the fatigue strength estimation, the estimated number of stress cycles is compared to the number of cycle to failure given by the S-N curve. This leads to that the stress range where the long-term prediction curve comes closer to the S-N curve has a profound effect on the fatigue damages. According to Fig. 3, the stress range around 100
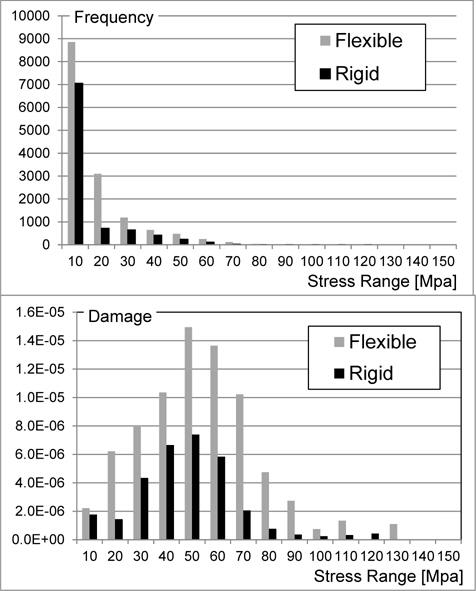
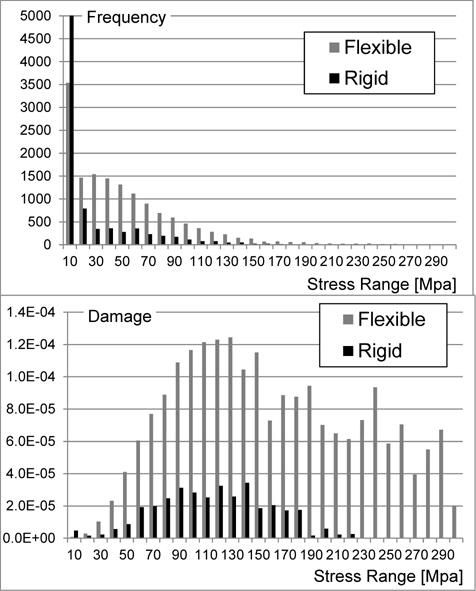
In the next place, the contribution rate of the stress range to the fatigue damage factor is investigated. The histograms of the hull-girder stress range and the corresponding fatigue damage factors in the short-term sea states of significant wave height
>
Consideration of cycle counting procedure based on the crack propagation behavior
The fatigue crack propagation behaviors under variable amplitude loading with different frequency components are investigated recently by means of fatigue testing and numerical simulations (Matsuda et al., 2011; Gotoh et al., 2012; Kitamura et al., 2012; Sumi, 2012). According to the results of such research works, the smaller amplitude component of higher frequency superposed on the larger amplitude component of lower frequency has not significant effect on the fatigue damage, but only the enlargement effect of the total amplitudes of the superposed stress is effective. This means that the smaller amplitude component of stress range does not affect the fatigue strength so much even if the number of cycles is large, but the enlargement effect in stress range by the smaller amplitude component of higher frequency is important in the fatigue strength. This effect can roughly be demonstrated by counting zero crossing peaks, rather than local peaks, in the rainflow counting method.
The fatigue damage factor in each short-term sea state obtained by using the zero crossing peak counting method is shown in Table 5, where the ship’s hull is assumed to be a flexible body. The largest fatigue damage factor is 0.094 to be exact in the sea state of
Fatigue damage factor in each short-term sea state (Zero crossing counting, flexible body, Ntotal = 100,000).
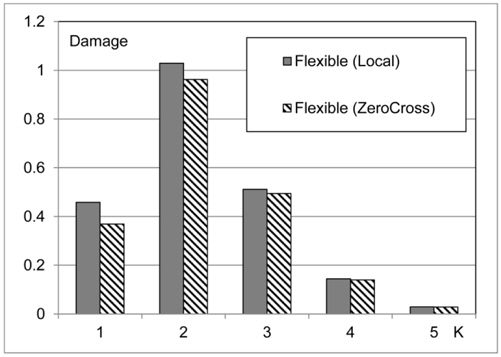
In order to confirm this result, the ratio of the fatigue damage factors obtained by the local peak counting method to that obtained by the zero crossing peak counting method in each short-term sea state is shown in Table 6. It can be seen from the table that the ratio is almost 1 except for the lower significant wave height region.
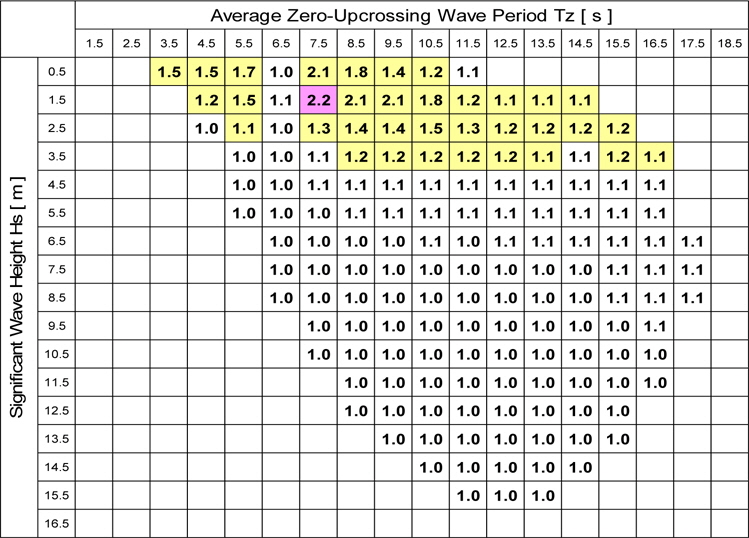
Ratio of fatigue damage factors counted by local peak and that counted by zero crossing peak in short-term sea state (Flexible body).
It would appear that the increase of the number of cycle of fluctuating stress due to hull-girder vibration affects the fatigue damage only in the region of lower significant wave height. In the region of moderate or higher significant wave height, the enlargement effect of the total amplitudes of superposed stress is dominant in the fatigue damage factor, and the number of cycle of the small amplitude component has insignificant effect. This finding is consistent with the fatigue test results and the crack propagation simulation results, therefore, it can be concluded that the fatigue damage factor is reasonably evaluated by the rainflow counting method even in the case where the smaller amplitude component of higher frequency vibration superposed on the larger amplitude component of lower frequency vibration.
The cumulative fatigue damage factors in the short-term sea state category of the occurrence probability of 10-
The crack initiation and propagation are nonlinear phenomena and there may be some limitation in the application of Miner’s rule to estimate the fatigue damage precisely, because Miner’s rule is based on the linear cumulative law. Including the behavior of fatigue damage factor around 100
The effect of hull-girder vibrations on the fatigue damage factor is investigated in the present paper for a Post-Panamax container ship by applying the rainflow counting method and Miner’s rule to the fatigue strength estimation. The conclusions obtained are as follows:
(1) If the ship is assumed to encounter 100,000 sea states according to the occurrence probability of the short-term sea state given in the IACS North Atlantic wave scatter diagram, the total cumulative fatigue damage factor is almost unity in the case where the ship’s hull is assumed to be rigid. In this context, Miner’s rule can be considered to be reasonably applicable to the fatigue strength design of a ship.(2) However, if the ship’s hull is assumed to be flexible, the total cumulative fatigue damage factor becomes almost double as many as that in the case of rigid body ship.(3) In the above two cases, the short-term sea state of the occurrence probability of 10-2 contributes largely to the fatigue damage factor among the categorized short-term sea states of the occurrence probability of 10-K.(4) The stress range around 100MPa has a significant effect on the fatigue damage in the present ship, and a peak can be seen in the fatigue damage factor around the stress range of 100MPa. It is important to confirm whether this phenomenon can be observed or not in the actual fatigue damage of a ship taking account of the nonlinearity in crack initiation/propagation behavior.(5) In the case where the smaller amplitude component of higher frequency vibration superposed on the larger amplitude component of lower frequency vibration, the enlargement effect of the total amplitudes of superposed stress is dominant in the fatigue damage factor, and the number of cycle of the small amplitude component has insignificant effect.(6) The fatigue damage factor is reasonably evaluated by the rainflow counting method even in the case where the smaller amplitude component of higher frequency vibration superposed on the larger amplitude component of lower frequency vibration.(7) The crack initiation and propagation behaviors are nonlinear phenomena and there may be some limitation in the application of Miner’s rule to estimate the fatigue damage precisely. Further investigation would be necessary to clarify the effect of hull-girder vibration upon the fatigue strength of a ship by taking account of stress histories which is effective in the crack initiation and propagation as well as the mean stress effect due to still water bending moment.