In an effort to cope with recent high oil price and global warming, developments of air lubricated ships have been pursued to reduce greenhouse gas emissions and to save fuel costs by reducing the frictional resistance. In this study, reduction in the frictional resistance by air lubrication with air layers generated on the lower surface of a flat plate was investigated experimentally in the large water tunnel of SSMB. The generated air layers were observed, and changes in the local frictional drag were measured at various flow rates of injected air. The results indicated that air lubrication with air layers might be useful in reducing the frictional resistance at specific conditions of air injection. Accordingly, resistance and self-propulsion tests for a 66K DWT bulk carrier were carried out in the towing tank of SSMB to estimate the expected net power savings.
The frictional resistance of a ship is one of major resistance components, approximately 60~70% of the total resistance. Therefore, if significant reduction in the frictional resistance is achieved, it will be useful in reducing greenhouse gas emissions and saving fuel costs consequently.
Air lubrication techniques can reduce the skin friction using air layers or artificial air cavities generated on the wetted hull surface by air injection (Bushnell and Hefner, 1990; Ceccio, 2010a). Some of the basic ideas had been proposed in the 19th century already (Latorre, 1997). However, some technical issues should be resolved for practical applications to large vessels sailing the ocean (Ceccio et al., 2010b): Hull attitude changes during turning or ship motions in waves may hinder resistance reduction with air lubrication by making air-water flows unstable. Moreover, an expensive air supply system should be installed to inject the right amount of air on the hull bottom surface of a large ocean-going vessel and the maintenance of the system should be considered as well. Nevertheless, air lubrication techniques are getting more attention as an effective means to save fuel costs in shipping industries because a recent surge in oil prices might shorten the payback period of an air supply system (Allenström and Leer-Andersen, 2010; Foeth, 2008; Foeth et al., 2010; Hoang et al., 2009; Insel et al., 2010; Thill, 2010). Recently, Mitsubishi Heavy Industries developed MALS (Mitsubishi Air Lubrication System), which has been applied to two module carriers of NYK-Hinode Line, a coal carrier built by Oshima Shipbuilding, a ferry of Japan's A-Line Ferry. It was announced that net power savings up to about 13% were obtained from the sea trials of the module carriers (Mizokami et al., 2010; Mizokami et al., 2011; Tanaka, 2011).
In this study, the feasibility of air lubrication technique without any significant changes of the hull form was investigated experimentally. Firstly, the experiments to generate air layers on the lower surface of a flat plate in the large water tunnel of SSMB were conducted The generated air layers were observed, and changes in the local frictional drag were measured. Secondly, resistance and self-propulsion tests for a 66K Supramax bulk carrier were carried out in the towing tank of SSMB. Air layers generated on the hull bottom were observed, and changes in the resistance and propulsion performance were investigated, and the expected net power savings were estimated.
FRICTIONAL DRAG REDUCTION WITH AIR LAYER
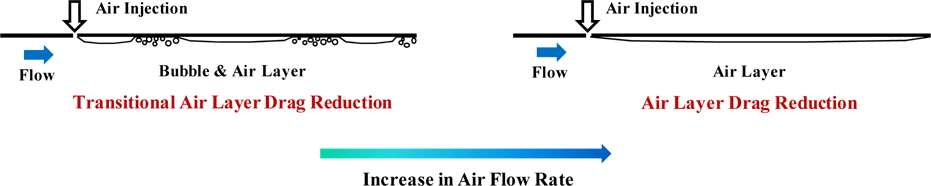
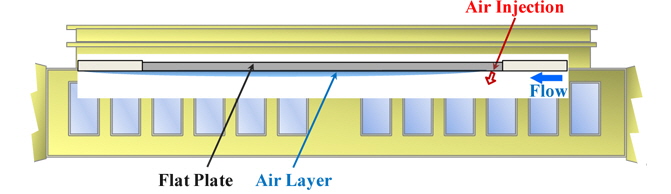
When air is injected into the boundary layer of the wetted surface, an air-water mixture flow containing both air bubbles and water can be formed. If the amount of injected air increases, air bubbles begin to coalesce into patches that cover the surface continuously, and a transitional air layer where the patches coexist with air bubbles is formed as shown in Fig. 1(Left). The frictional drag on the surface covered with a continuous air layer can be reduced effectively as if the wetted surface area were reduced because the friction with water may change into that with air (Bushnell and Hefner, 1990). Therefore, on the surface covered with a transitional air layer, it is expected that both air bubbles and patches of continuous air contribute to the frictional drag reduction. Elbing et al. (2008) described that reduction in the local frictional drag can be achieved from about 20% to 80% on the surface covered with a transitional air layer. If the amount of injected air is increased more, coalescence of air bubbles is promoted further and a fully continuous air layer covering the wetted surface on a large scale is developed as shown in Fig. 1(Right) and reduction in the local frictional drag can reach more than 80% (Elbing et al., 2008; Ceccio, 2010a).
GENERATION OF AIR LAYER UNDER A FLAT PLATE
Experiments with a flat plate were conducted in the large water tunnel. The experimental configuration is shown in the schematic drawing of Fig. 2. Air layers were generated on the lower surface of the flat plate horizontally mounted in the water tunnel to investigate the feasibility of air lubrication for reducing the frictional resistance of ships by injecting air on the bottom of the hull.
A flat plate with length of 7.5
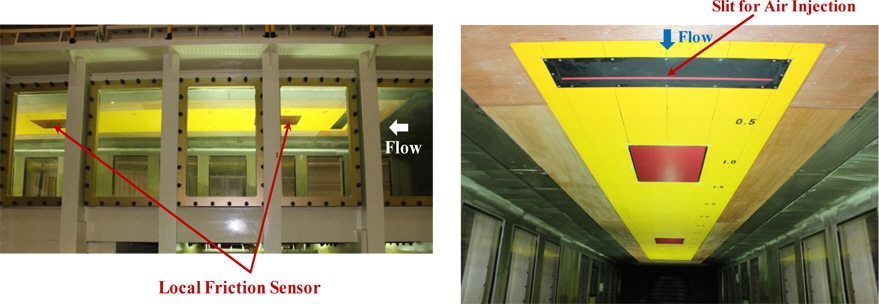
In order to measure the changes in the local frictional drag by air layers, two floating-plate-type friction sensors were installed flushing with the lower surface of the flat plate. The centers of the sensors were located at 1.1
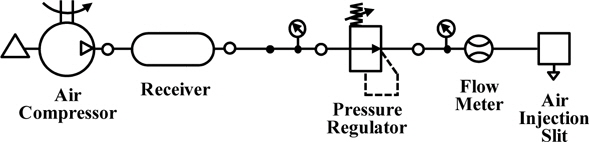
Air was injected according to the diagram shown in Fig. 4. The pressure of compressed air was controlled by a pressure regulator to adjust flow rates of injected air, and the flow rates were measured by a flow meter.
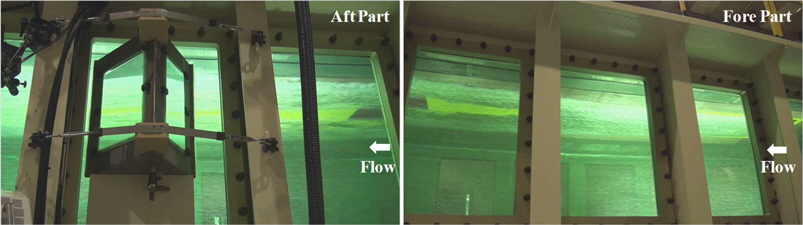
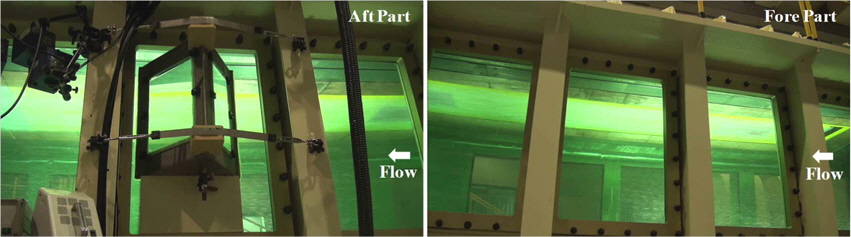
Air layers generated on the lower surface of the flat plate at various flow rates of injected air were observed, and changes in the local frictional drag were measured. Captured images of typical air layers and measured results of changes in the local frictional drag when the inflow speed was 5

In Eq. (1), QAir, VInflow, and BAir are volume flow rate of injected air, inflow speed, and the width of the air injection slit, respectively. Flow rates of air at normal condition, 1
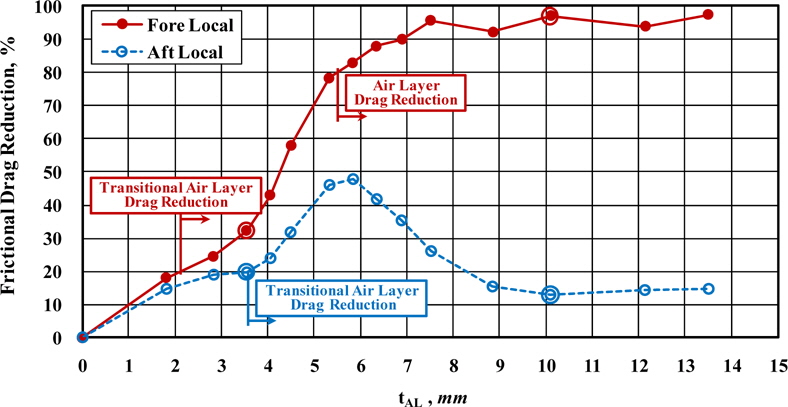
Firstly, we examined the case where the flat plate had no side wall in Figs. 5~7. As the flow rate of injected air increased, reduction in the frictional drag was enhanced on the floating plate of the fore local friction sensor: about 20% reduction in the local frictional drag at tAL ≅ 2
Although it is difficult to distinguish clearly from the captured images of air layers in Figs. 6 and 7, it is thought that a transitional air layer when roughly 2
On the floating plate of the aft local friction sensor, reduction in the frictional drag showed a similar tendency as the flow rate of injected air increased up to tAL ≅ 6
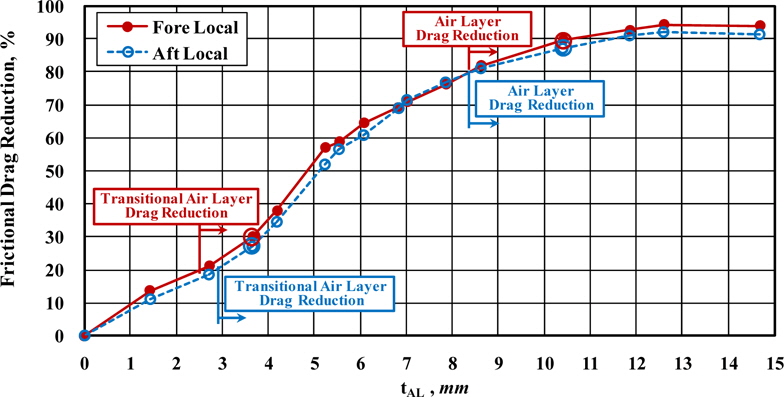
Secondly, we examined the case where the flat plate had side walls 10mm high at both sides in Figs. 8~10. As the flow rate of injected air increased, reduction in the local frictional drag was enhanced on the floating plates of the aft local friction sensor as well as the fore one. Therefore, as shown in Fig. 8, about 20% and more than 80% of local frictional drag on the floating plates of both local friction sensors were reduced at tAL ≅ 2.5mm and tAL > 8.5mm, respectively. From the captured images in Figs. 9 and 10, splitting of the air layers was not observed unlike the case where the flat plate had no side wall. It seems that the side walls contributed to weakening the strength of the streamwise vortices and reducing air leakage into both sides of the flat plate. It is thought that a transitional air layer at 2.5
ESTIMATION OF POWER SAVINGS OF A SHIP
A series of resistance and self-propulsion tests for a wide beam bulk carrier was carried out in the towing tank to investigate net energy savings with air layers generated on the hull bottom by air injection.
A 66K DWT Supramax bulk carrier was selected as a test hull form and a model ship was manufactured with a scale ratio of 24.0 to perform the resistance and self-propulsion tests.
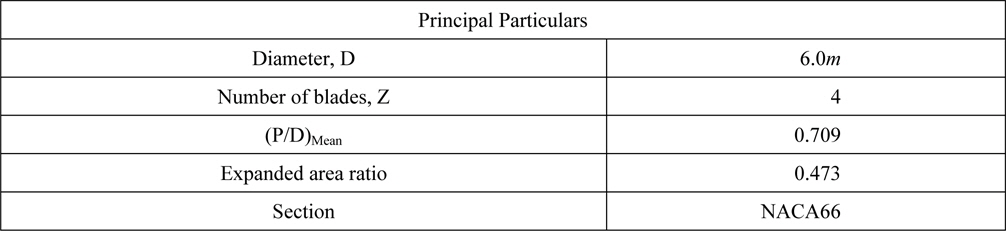
The principal particulars of the ship and a stock propeller are shown in Tables 1 and 2, and a body plan of the ship is shown in Fig. 11. The flat bottom area, where reduction in the frictional resistance can be expected to occur, is about 42.5% of the total wetted surface area.
[Table 1] Principal particulars of 66K DWT supramax bulk carrier.
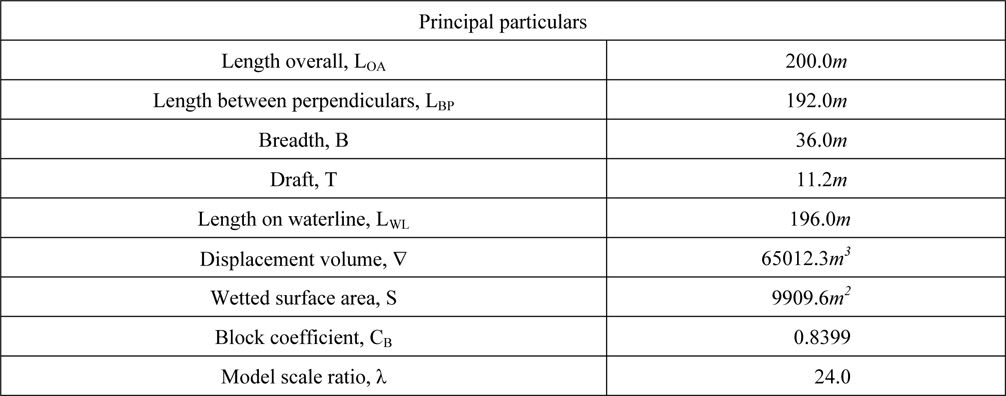
Principal particulars of 66K DWT supramax bulk carrier.
[Table 2] Principal particulars of stock propeller.

Principal particulars of stock propeller.
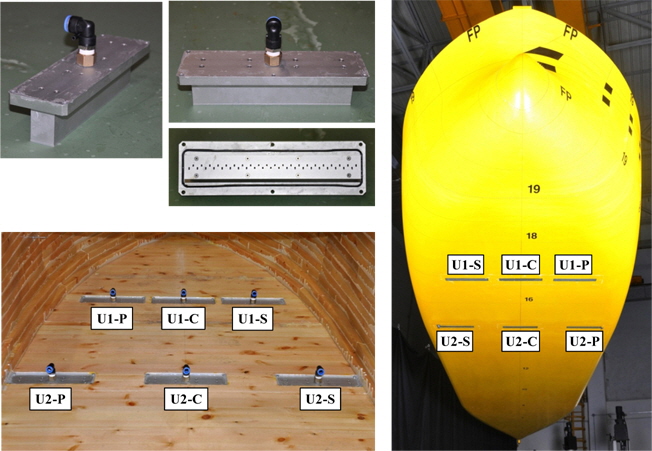
Six air injection units that operate independently were installed to the model ship as shown in Fig. 12. Three units, [U1-P], [U1-C], and [U1-S] were located at the 17th station and the other three units, [U2-P], [U2-C], and [U2-S] were located at the 15th station. In order to avoid undesirable increase in the resistance, the air injection units were mounted flushing with the bottom surface of the hull.
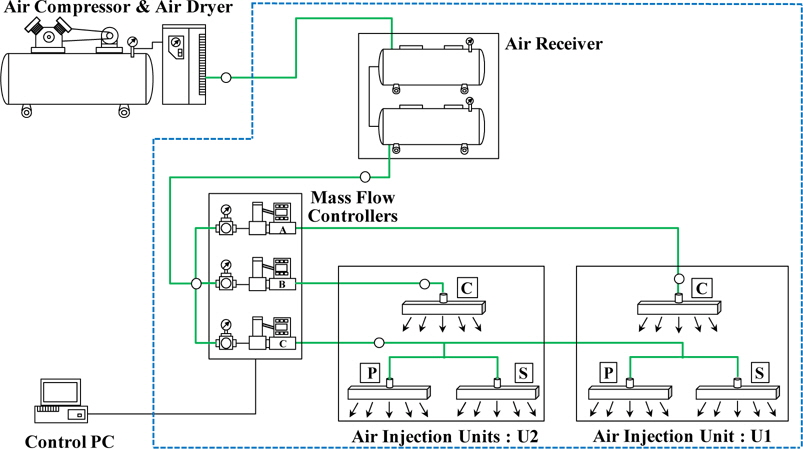
Air was injected through array of holes on the base plate of each air injection unit according to the air supply chain as shown in Fig. 13. Compressed air by an air compressor was stored in the air receivers on the deck of the model ship and the flow rate of air supplied to the air injection units were adjusted by PC-controlled mass flow meters.
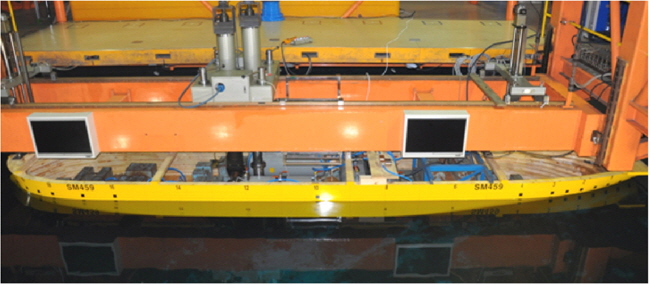
The model ship prepared for the tests in the towing tank is shown in Fig. 14. In order to avoid any interference, the tube to supply air from the air compressor to the air receivers in the model ship was disconnected during each test run.
>
Procedures to estimate changes in the power by air layer
The effective power when air is not injected, PE was estimated using a well-known procedure in Eqs. (2) and (3).


In Eqs. (2) and (3), CT is the total resistance coefficient, CF is the frictional resistance coefficient, CA is the model-ship correlation allowance coefficient, CR is the residuary resistance coefficient, CAA is the air resistance coefficient, S is the wetted surface area of the hull, SBK is the wetted surface area of the bilge keels, RT is the total resistance, and V is the ship speed. The subscript “S” denotes full scale value. The frictional resistance coefficient when air is not injected is obtained from the ITTC 1957 modelship correlation line.
The effective power when air is injected, PE,Air was estimated according to Eqs. (7) and (8) on the assumptions that air injection does not influence the residuary resistance and reduction ratio of the frictional resistance in the full scale is kept the same level as the model scale in Eqs. (4)~(6).


In Eqs. (4)~(8), the subscript “Air” denotes the case where air is injected and the subscript "M" is model scale value.


Finally, reductions in the total resistance of the model ship and the effective power are obtained according to Eqs. (9) and (10).
When air is not injected, the towing force to be supplied to the model ship for skin friction correction was determined by Eq. (11). The full scale wake fraction was corrected from the model scale wake fraction and the thrust deduction fraction obtained from the self-propulsion tests according to Eq. (12) based on Tanaka-Sasajima method. The advance ratio of the full scale propeller was obtained from the full scale propeller loading coefficient in Eq. (13).


FD is the towing force, wT is the effective wake fraction, t is the thrust deduction fraction, (KT/J2) is the loading coefficient of the full scale propeller, and D is the propeller diameter.
Likewise, when air is injected, the towing force (FD,Air), the effective wake fraction (wTS,Air), and the propeller loading coefficient (KT/J2)Air were obtained according to Eqs. (14)~(16).


The quasi-propulsive efficiency, ηD was estimated from the physical quantities at the self-propulsion point obtained using Eqs. (11)~(16).
Finally, delivered power savings were obtained according to Eq. (17).

Resistance tests of the 66K Supramax bulk carrier were performed at design draft to investigate the resistance reduction with air layers in various test conditions such as combinations of air injection units and flow rates of injected air. In this paper, noteworthy results among whole test results are discussed.
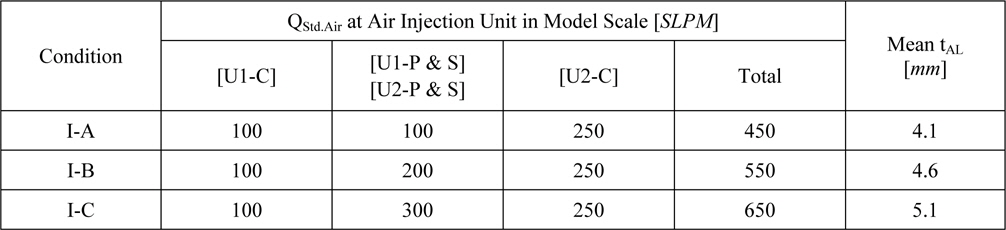
Firstly, air was injected from all injection units at the towing speed corresponding to 14.5
[Table 3] Air injection condition I (air injection from all units) at VS = 14.5knots.

Air injection condition I (air injection from all units) at VS = 14.5knots.
When air was injected with the flow rates of 100
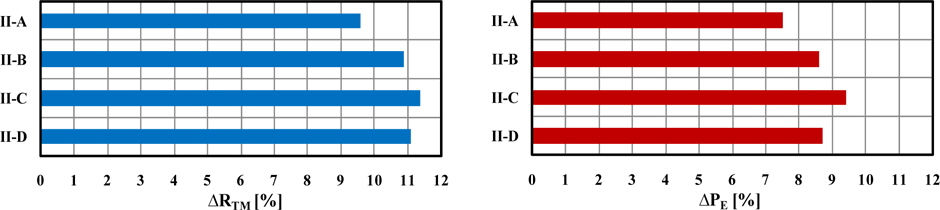
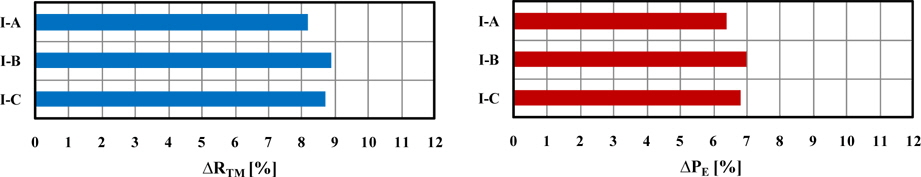
Secondly, air was injected from the only center injection units at the same towing speed as the previous case. With the unchanged flow rate of 100
[Table 4] Air injection condition II (air injection from units [U1-C] and [U2-C]) at VS = 14.5knots.
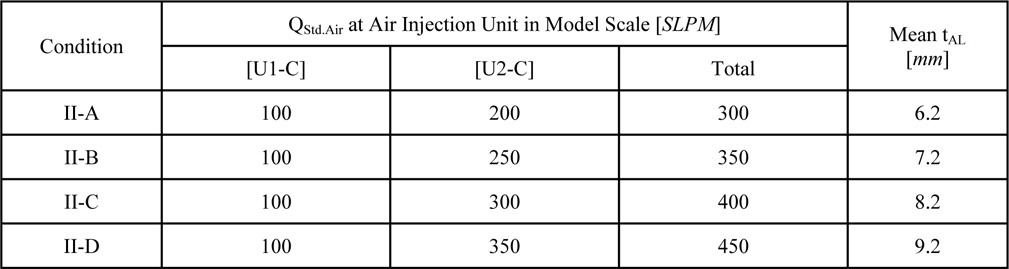
Air injection condition II (air injection from units [U1-C] and [U2-C]) at VS = 14.5knots.
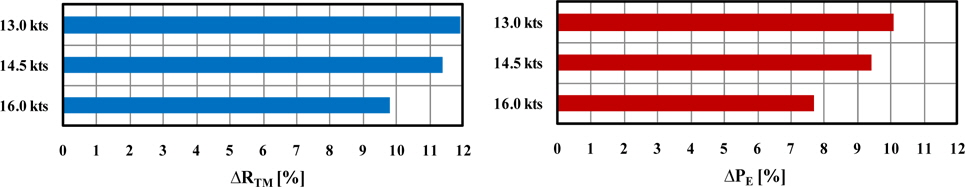
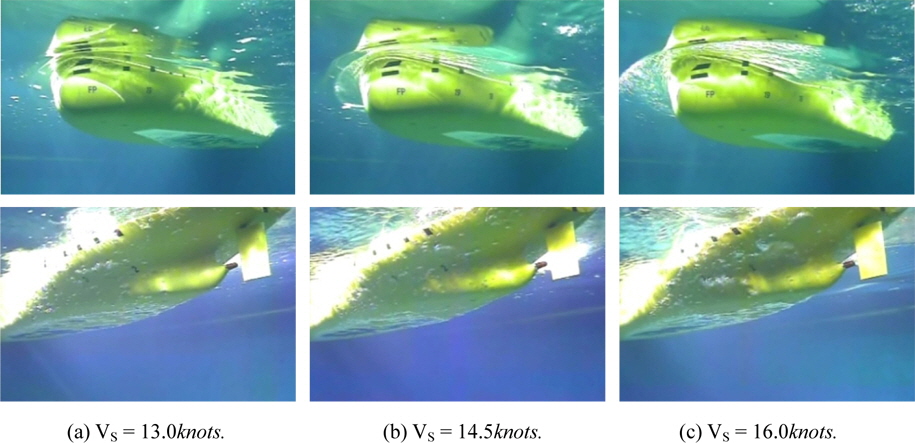
Lastly, additional tests were performed at 13.0 and 16.0
>
Effects of air layer on the propulsion performance
Self-propulsion tests of the 66K Supramax bulk carrier were performed at design draft, 11.2
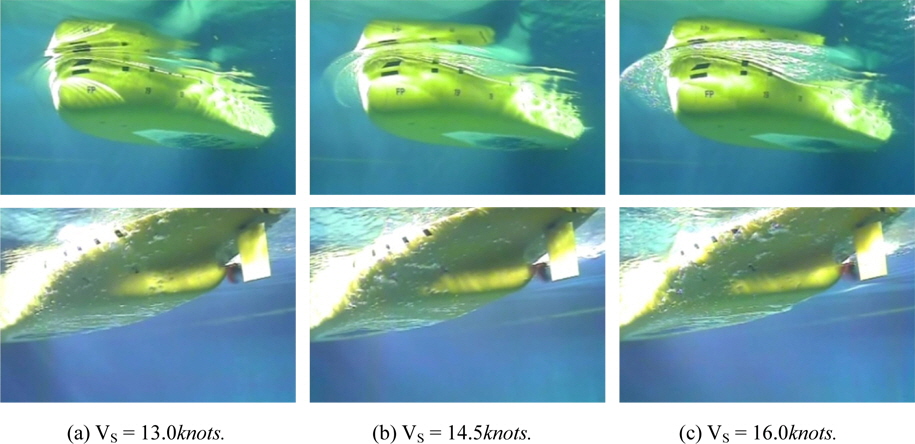
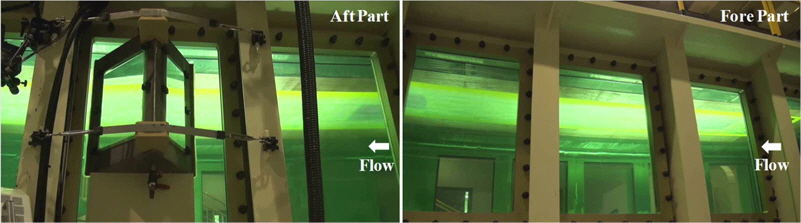
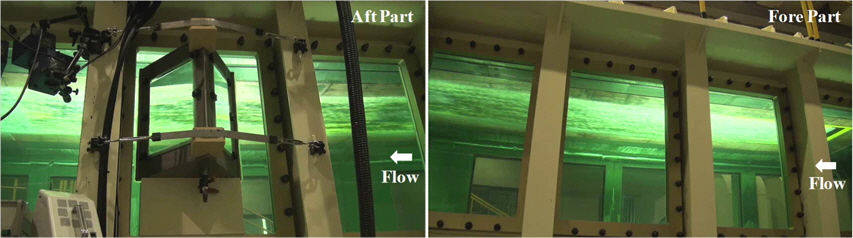
The captured images of the air layers from the resistance and self-propulsion tests are show in Figs. 19 and 20 and it is shown that the air layers similar in shape were generated on the bottom of the hull. It seems that the propeller suction almost did not affect the amount of air bubbles flowing into the propeller plane.
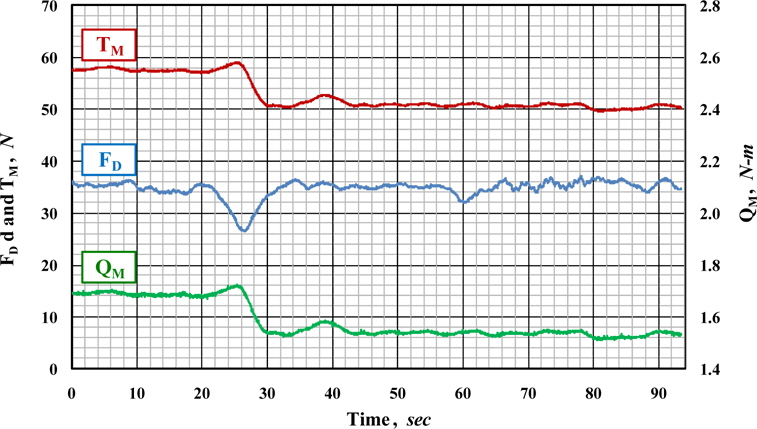
Fig. 21 shows the changes in the towing force (FD), propeller thrust (TM) and propeller torque (QM) measured during the self-propulsion tests when the rate of revolution of the propeller was 9.0
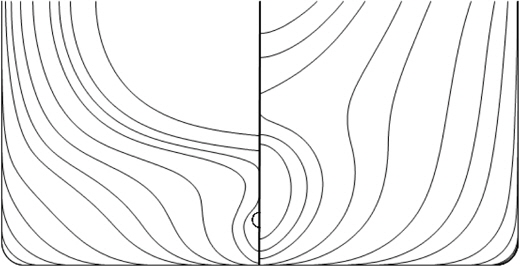
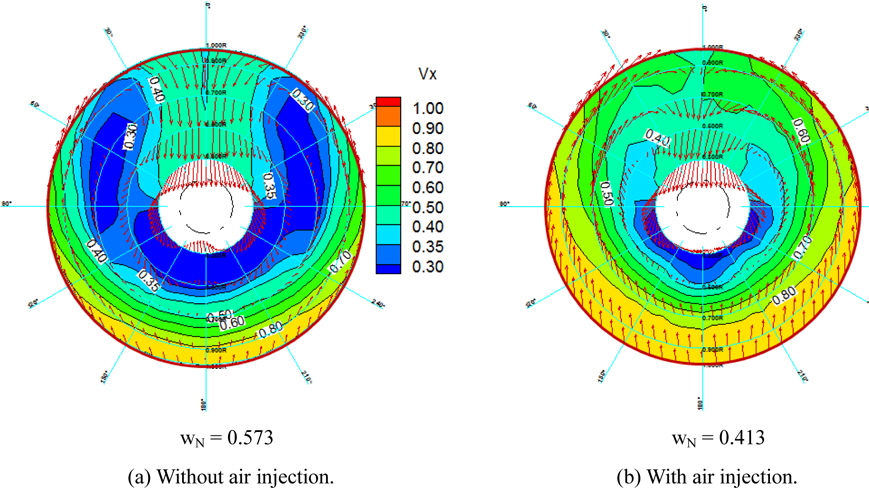
Nominal wake distributions were measured with the underwater PIV system of SSMB to investigate the reason why the propeller thrust and torque were reduced. As shown in Fig. 22, the level of the axial velocity increased significantly and the nominal wake fraction, wN was changed into 0.413 from 0.573 when an air layer was generated on the bottom of the hull. In addition, downward flow in the upper area of the propeller shaft decreased. It is thought that increase in the momentum of the flow along the hull bottom by the frictional resistance reduction made the flow into the propeller plane accelerated and this led to the reduction in the propeller thrust and torque.
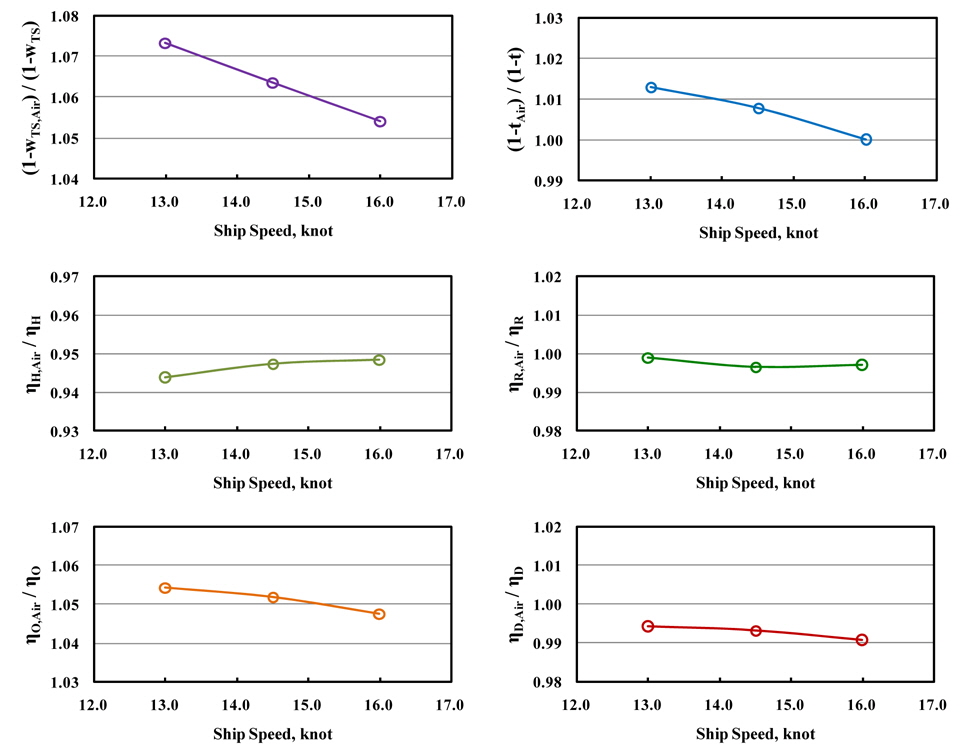
Differences of main self-propulsion factors were compared in Fig. 23. There were not any significant changes, less than 1%, in the relative rotative efficiency (ηR) and thrust deduction fraction (t), while the full scale wake fraction (wTS) decreased considerably due to flow acceleration effect by air layers generated on the bottom of the hull as mentioned in the nominal wake distributions. The hull efficiency (ηH) decreased by about 5~6%, but open water efficiency increased by about 5% as the propeller loading was reduced. Consequently, the quasi-propulsive efficiency (ηD) was reduced by about 0.6~0.9% compared with the case that air was not injected. This coincides with a preceding study that the loss in the propulsive efficiency was assumed to be about 1% when a small amount of bubbles flows into the top of the propeller plane (Kawakita et al., 2011). Finally, the reduction in the delivered power was estimated to be about 7~9.5% in the speeds range of 13.0~16.0
The required power for air injection, PAir was estimated as the power needed to compress a given quantity of air at standard condition, 1

In the above equation, QStd.Air is the full scale flow rate of air at standard condition and ηC is an efficiency of an air compressor, n is the polytropic index assumed to be 1.4 corresponding to the isentropic process. p1 is the atmospheric pressure and p2 is the delivery pressure to which air needs to be compressed for air injection on the bottom of the hull.
Using the hydrostatic pressure acting on the water depth corresponding to the bottom of the model ship and the water temperature, the mass flow rates of air measured by the flow meters were converted into the volume flow rates of air in model scale, and the values of the ideal air layer thickness in model scale were obtained. Then, the full scale volume flow rates were estimated on the assumption that the ideal air layer thickness, tAL in Eq. (19) should be roughly the same in the model and full scale. Finally, the full scale flow rates of air at standard condition, QStd.Air in Eq. (18) were obtained from the full scale volume flow rate, QAir under a polytropic process with n = 1.4.

In the above equation, QAir, VS, and BUnit are volume flow rate of injected air, ship speed, and the width of the air injection unit respectively.
The efficiency of an air compressor, ηC in Eq. (18) was assumed to be 0.75 from the comparison with the driving motor power values of air compressors on the market. The delivery pressure of air, p2 was obtained as the sum of the atmospheric pressure, the hydrostatic pressure at the hull bottom where air is injected, and the pressure drop due to piping losses, Δp according to Eq. (20).

In Eq. (20), ρS is the density of sea water at water temperature 15°

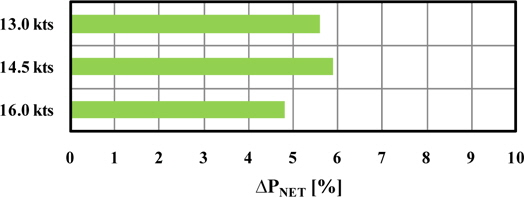
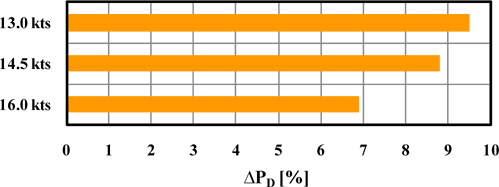
Finally, the expected net power savings, ΔPNet were estimated to be 5~6% in the speed range of 13.0~16.0knots according to Eq. (21) as shown in Fig. 25.
The experiments to generate air layers on the lower surface of a flat plate in the large water tunnel were conducted. From the experiments, it was ascertained that a transitional air layer generated by air injection on the bottom of the hull, where patches of continuous air layer coexist with air bubbles, can be utilized as one of effective means to reduce the frictional resistance of ships. It is necessary to make injected air spread evenly after injection to increase persistence length of the frictional resistance reduction.
For a wide beam 66K DWT Supramax bulk carrier, net power savings were estimated from the resistance and self-propulsion tests in the towing tank, considering power consumption for air injection. The resistance and propulsion performance was estimated on the assumption that air layers does not change the residuary resistance. In addition, it was assumed that the reduction ratio of the frictional resistance and the ideal air layer thickness in the full scale are maintained with the same level as the model scale. Full scale correction of wake fraction was done according to a procedure based on Tanaka-Sasajima's method. The power consumption for air injection was estimated as the required power to compress a given quantity of air at standard condition, 1
From the tests, it was estimated that the effective power was reduced by about 8~10% and the delivered power was reduced by 7~9.5% approximately due to the loss in the quasi-propulsive efficiency, less than 1%. Finally, net power savings were estimated to be around 5~6%, considering the required power for air injection, 2~4% of the shaft power when air was not injected.
It is thought that air lubrication with air layers generated on the bottom of ships has great potential for power savings if there is not any significant performance deterioration in real sea conditions. Accordingly, the performance in waves will be investigated to assess more rigorously the feasibility of the air lubrication technique as an effective energy saving means for ships.


![Air injection condition II (air injection from units [U1-C] and [U2-C]) at VS = 14.5knots.](http://oak.go.kr/repository/journal/13341/E1JSE6_2014_v6n2_363_t004.jpg)