SBV infected larva fails to pupate, and accumulates virus enriched ecdysal fluid beneath its unshed skin (Bailey
Illumina sequencing is a recently developed technology which can produce hundreds of millions of short reads from DNA or cDNA sample (Bentley
The
>
cDNA library preparation and Illumina transcriptome sequencing
To construct a cDNA library, the total RNA was isolated using Qiazol lysis reagent (Qiagen, Germany) according to the manufacture’s protocol. Five of the total RNA samples from the workers and larvae groups were pooled equal amount as one sample of 10 µg for transcriptome sequencing, respectively. The integrity of total RNA was examined by using 2100 Bioanalyzer (Agilent, USA) with RNA 6000 nano chip. The mRNA in total RNA was converted into a library of template molecules suitable for subsequent cluster generation using the reagents provided in the Illumina TruSeq RNA Sample Preparation Kit. The first step in the workflow involves purifying the poly-A containing mRNA molecules using poly-T oligo-attached magnetic beads. Following purification, the mRNA was fragmented into small pieces using divalent cations under elevated temperature. The cleaved RNA fragments were copied into first strand cDNA using reverse transcriptase and random primers. This was followed by second strand cDNA synthesis using DNA polymerase I and RNase H. These cDNA fragments then went through an end repair process, the addition of a single ‘A’ base, and ligation of the adapters. The products were then purified and enriched with PCR to create the final cDNA library. Finally the cDNA library of 250~300 bp insert was subjected to Illumina HiSeq 2000 sequencer to sequence the 101 bases of 5’ end.
>
Analysis of transcriptome sequencing results
The raw Illumina sequence reads were filtered to remove low quality sequences by using NGS QC Toolkit v2.3 (Patel and Jain, 2012) before bioinformatical analysis. The sequence reads of base called with error rate higher than 0.1% (quality score<30) were eliminated, and the remaining clean reads were used for further analysis. The filtered Illumina short reads were then mapped to
The reference mRNA sequences which were mapped with the Illumina short reads by Bowtie2 software were subjected to eggNOG (evolutionary genealogy of genes: Non-supervised Orthologous Groups) (Jensen
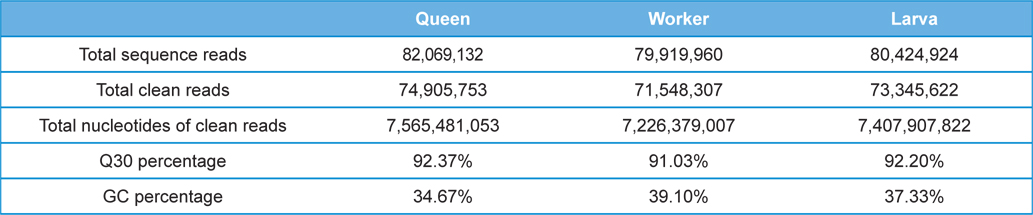
The Illumina sequencing generated a total of 242,414,016 single-end raw reads, and a total of 219,799,682 reads which was 90.67% of the raw reads was obtained after Q30 (sequencing error rate, 0.1%) filtration for further analysis. The accumulated length of the total filtered reads was 22,199,767,882 bases with GC percentage of 37.0%. The detailed transcriptome sequencing results of each sample group are summarized in Table 1. The raw Illumina sequencing results were submitted to NABIC (National Agrucultural Biotechnology Information Center, Rural Development Administration, Korea) NGS SRA database. The accession numbers for the transcriptome of Queen, workers, and larvae are NN0646, NN0650, and NN0648, respectively.
[Table 1.] Summary of the A. cerana transcriptome sequencing

Summary of the A. cerana transcriptome sequencing
>
Analysis of gene expression level
The Illumina short reads of each
[Table 2.] Detailed statistics of the gene expression levels of each sample
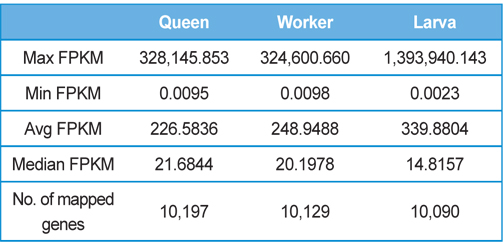
Detailed statistics of the gene expression levels of each sample
>
Gene ontology analysis of differentially expressed genes
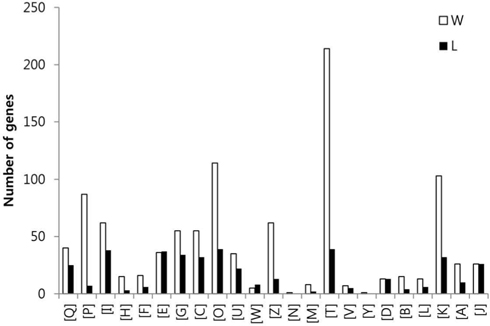
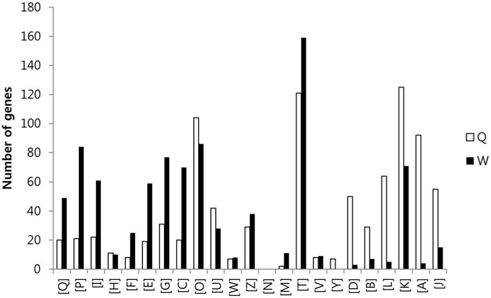
To compare the gene expression profiles, the FPKM values of each gene were then arithmetically normalized based on the ratio of the total numbers of Q30-filtered short reads between sample groups. The genes which were overexpressed over two-fold between the two sample groups were isolated, and the sum of FPKM value of each gene was calculated. A total of 9,221 genes with sum of FPKM value greater than 5 were subjected to eggNOG analysis. The eggNOG functional groups and their abbreviations are as follows; [Q] Secondary metabolites biosynthesis, transport and catabolism, [P] Inorganic ion transport and metabolism, [I] Lipid transport and metabolism, [H] Coenzyme transport and metabolism, [F] Nucleotide transport and metabolism, [E] Amino acid transport and metabolism, [G] Carbohydrate transport and metabolism, [C] Energy production and conversion, [O] Posttranslational modification, protein turnover, chaperones, [U] Intracellular trafficking, secretion, and vesicular transport, [W] Extracellular structures, [Z] Cytoskeleton, [N] Cell motility, [M] Cell wall/membrane/envelope biogenesis, [T] Signal transduction mechanisms, [V] Defense mechanisms, [Y] Nuclear structure, [D] Cell cycle control, cell division, chromosome partitioning, [B] Chromatin structure and dynamics, [L] Replication, recombination and repair, [K] Transcription, [A] RNA processing and modification, and [J] Translation, ribosomal structure and biogenesis.
In the comparison of queen and worker, total of 3,014 and 3,009 eggNOG tagged genes from queen and worker were compared their expression levels, and identified total of 887 (22.7%) and 879 (22.5%) genes which were overexpressed over two folds, respectively. In the comparison of worker and larva, total of 3,492 and 2,884 eggNOG tagged genes from worker and larva were compared, respectively, and identified total of 1,009 (25.9%) and 401 (10.3%) genes which were overexpressed over two folds, respectively.
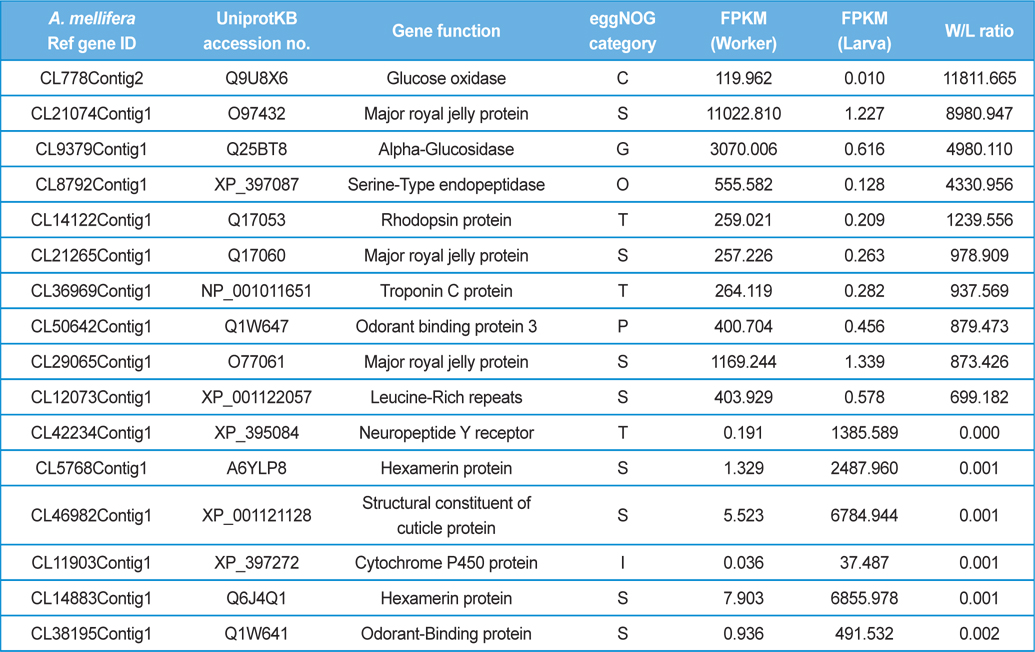
The GO distributions demonstrated that the genes related to nutritional metabolism were overexpressed in the worker while the genes related to cell division and nucleic acid processing were overexpressed in the queen. These results reflect the role of each caste which are honey and royal jelly production, and reproduction of worker and queen, respectively (Fig. 1). On the other hand, the genes related to transcription, translation, and transduction were overexpressed in the larva which reflect the highly active genes of developing larvae (Fig. 2). The genes significantly overexpressed over 500-fold are summarized in Table 3 and 4.
[Table 3.] The differentially express genes over 500 folds in queen and worker.
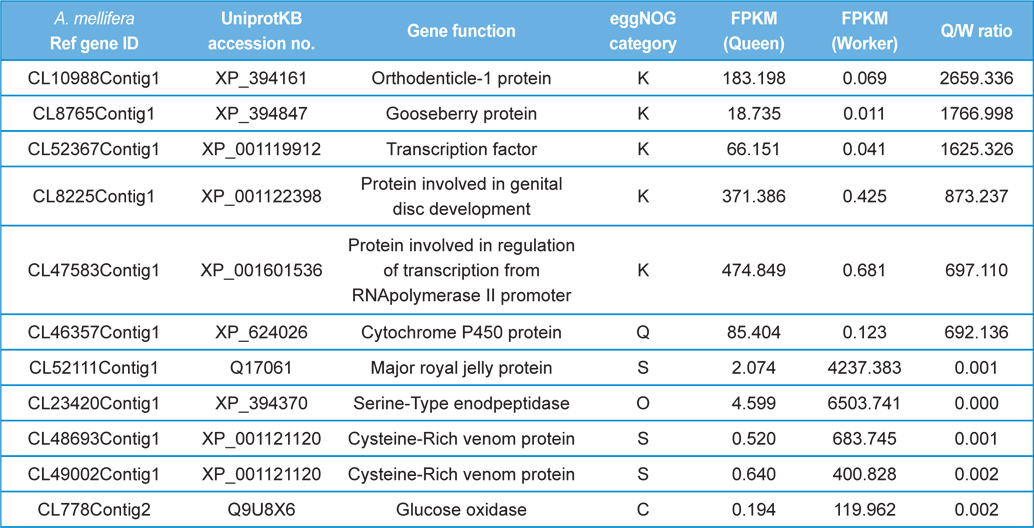
The differentially express genes over 500 folds in queen and worker.
[Table 4.] The differentially express genes over 500 folds in worker and larva.

The differentially express genes over 500 folds in worker and larva.