As income levels have increased, trends in processed food production have also changed from higher-temperature sterilization, or the addition of preservatives to products, to the use of packaging and storage techniques to deliver fresh or semi-prepared food. The fish market is no exception to this trend and the production and market volume of prepared or freshly processed food products have been growing. The meat structure of edible invertebrates and molluscs such as sea squirt is easily mechanically damaged and can be attacked by microbial organisms to the extent that they spoil more easily than other seafoods. These animal seafood resources have an important role as sources of nutrients including protein, taste compounds, bioactive substances, vitamins, and minerals, but manufacturing them as fresh processed food is very difficult.
As a representative seafood in Korean culture, the importance of sea squirt has been emphasized by the development of ocean agriculture technologies and the expansion of farming areas. Many studies have been conducted to investigate the chemical ingredients and taste components of sea squirts (Lee et al., 1993a, 1993b, 1993c, 1993d, 1993e, 1993f, 1993g), and the precursor and production mechanisms of scent compounds (Fujimoto et al., 1982a, 1982b). However, the high moisture content in sea squirt meat (>80%) can result in its freshness diminishing quickly and the discoloration of the brown meat due to strong enzyme activity (Jeon et al., 1996). Due to these characteristics, manufacturing it as a processed food is difficult. In addition, most harvesting occurs in late spring and summer, and thus more research is required to determine new techniques for food processing and preservation. Food irradiation is one such technique that could potentially increase the shelf life. Because it can also maintain food quality, the use of food irradiation has increased internationally (World Health Organization, 1981). Using γ-irradiation, one can continuously sterilize a packed product and prevent secondary pollution (Diehl, 1990; Thayer, 1994b). Studies on irradiated seafood have already been undertaken to determine nutritional and storage quality, including a determination of the microbial characteristics of gamma-irradiated fermented squid (Kim et al., 1999), the quality of gamma-irradiated Kochujang-Gulibi (Kang et al., 2011a, 2011b), and the shelf life and quality of gamma-irradiated squid sundae (Kim et al., 2012). Therefore, the application of γ-irradiation has the potential to prolong the shelf life of seafood products.
Moisture content and water activity (Aw) play a large role in food freshness and the growth of microorganisms. If both could be reduced, the freshness of food and its shelf life would be improved. Therefore, in this study, we used 5% dehydrated sea squirt meat produced by an expressing technique (pressed samples by paper tower). Sesame oil and olive oil were added to improve the acceptability to the consumer and the anaerobic condition of bottled products. The smell of Korean-style sesame oil, which is roasted and heat-pressurized, is aromatic but those oil can display severe rancidity (Nam and Chung, 2008). However, a simple pressurized or solvent-extracted sesame oil inhibits automatic linolenic acid oxidation by reducing oxygenated radical chains due to the presence of sesamol (Yoshida and Takagi, 1999; Lee et al., 2008). Olive oil is known to lower the cholesterol level in blood and prevent arteriosclerosis and stomach disorders (Choi, 2006). Thus, sesame oil and olive oil may be effective for improving the sensory and nutritional quality of stored squirt meat products.
Response surface methodology (RSM) was used to determine the best mixture of ingredients based on consumer acceptability. To obtain basic data for improving the nutritional quality and storage stability of oil-based bottle products of sea squirt meat, two groups of tasters group were established that consisted of adults from different generations. The panelists conducted a consumer taste survey and texture analysis. Through the nutritional evaluation and testing of the storage stability of bottled sea squirt meat made to an optimal mixing ratio, we evaluated whether RSM could be used for the optimization of the seafood mixing ratio.
Determining the best optimized and standardized mixture of sesame and olive oils, and sea squirt meat based on consumer acceptability of the bottled products, is important. As the first step in this procedure, an accurate statistical analysis model should be applied to evaluate the method used to plan the mixture of ingredients (Saguy et al., 1984; Naes et al., 1999). RSM is considered to be appropriate for this activity and is widely used as the first step in optimizing food mixture. It is referred to as a statistical analysis method that evaluates the surface response that results when an independent variable (X) interacts with and influences a dependent variable (Y) (Giovanni, 1983; Mudahar et al., 1989). Variables causing a response are independent variables or factors, and variables responding are dependent variables. The outcomes of RSM are the following: 1) it assumes meaningful effects and a functional relation between independent and dependent variables so that it can predict changes according to the variation of those variables, and 2) the level of independent variables enables the maximum desirable independent variables (Cornell, 1990). Therefore RSM can be usefully applied for food mixture optimization in bottled food production. Seafood processing involves the use of various ingredients, and therefore, studies on the mixing ratio optimization in test planning must be conducted before processing. Focusing on consumer tastes is critical.
In this study, a central composite design of mixture test planning was used to determine the best mixing ratio of ingredients focusing on consumer tastes to obtain basic data for sea squirt meat products. To develop an appropriate model for each generation (Prinyawiwatkul et al., 1983), consumer taste evaluations were undertaken to determine the perception of value, behavior patterns, and time values for each generation.
Live sea squirts (average, 155 ± 11 g) were purchased and exuviated in Namcheon Seafood Market, Busan, Korea. After placing the sea squirt meat in a cooler (4ºC) within 5 min of purchase, meat samples were dehydrated by pressing with a kitchen towel and vacuum-packed (70 g and 80 g). Vacuum-packed samples were frozen at -20 ± 5ºC, and these samples were used in the experiments. Sterilized bottles and irradiated frozen sea squirt meat samples without viscera were used to prepare bottled products with the aim of extending its shelf life. Irradiation was performed with γ-ray (Co 60) 10 kGy/h of absorbed dose at the Advanced Radiation Technology Institute in Jeongeup, Korea. Sterilization was performed at 121ºC for 15 min using an autoclave (HB-506-4; Han Baek Scientific Co., Seoul, Korea).
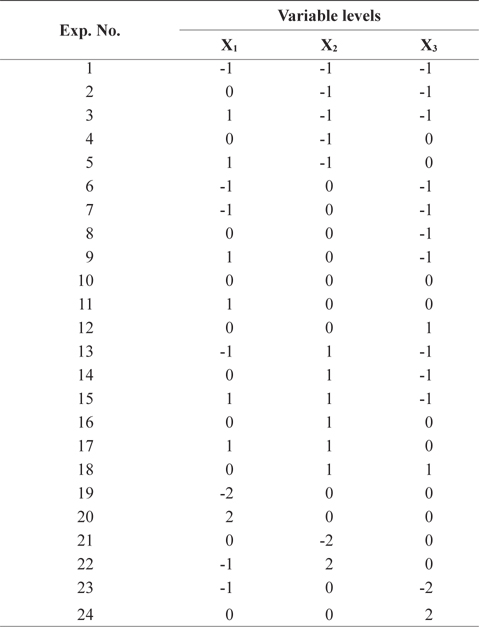
RSM was used to study the effects of three independent variables (Table 1). The three factors were expressed as X1, X2, and X3. The effects of independent variables were the following: [X1] ratio of olive oil and sesame oil, [X2] amount of sea squirt meat, and [X3] amount of oil added.
[Table 1.] Independent variables and their levels for central composite design
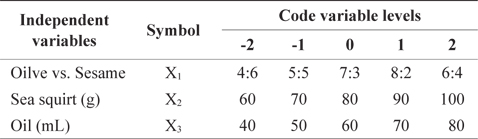
Independent variables and their levels for central composite design
>
Bottled sea squirt meat in oil preparation
Various amounts of sea quirt meat, complying with the ratios determined by the central composite design shown in Tables 1 and 2, were mixed with olive oil and sesame oil according to the ratios in proportion to the total amount. All bottled sea squirt meat in oil (BSMO) products were stored at 4°C for 60 days.
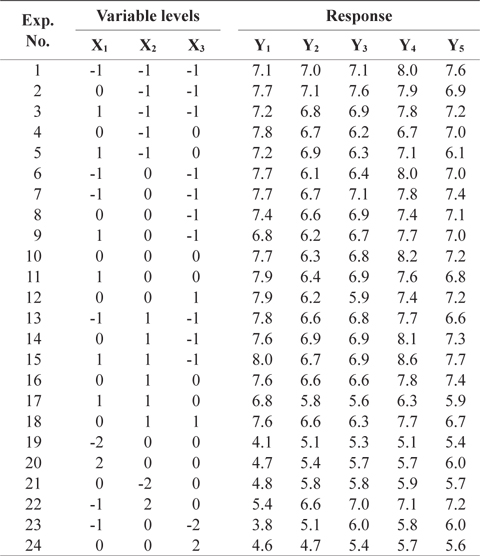
[Table 2.] Central composite design arrangement and variable levels
Central composite design arrangement and variable levels
A sensory evaluation was undertaken to optimize the best bottled sea squirt meat. The sensory panelists were divided into two age groups of group 1 (10 individuals aged 20-29 years) and group 2 (9 individuals aged ≥30 years). Evaluation was based on a 9-point grade (1 was very bad, 5 was normal, 9 was very good), with the hedonic scale used in a questionnaire test of color, flavor, taste, texture, and overall acceptability. Fresh drinking water was provided to panelists, with each panelist required to rinse his or her mouth with water between sample evaluations. Because providing the same surroundings for every evaluation was difficult, a balanced evaluation was performed by each group over 2 days.
The sensory evaluation was used to determine the best bottled sea squirt meat products, raw sea squirt meats, and dehydrated meats, which were then used in every experiment.
The proximate composition of raw and freeze-dried samples was determined using the Association of Official Analytical Chemists (AOAC) methods (AOAC, 1990). Moisture was determined by oven-drying (J-DS4l; JISICO) at 105ºC until a constant weight was achieved. Crude ash was determined by the dry ashing method in a muffle furnace (HY-8000S series; Kukje Scien, Korea). Crude fat was determined using the Soxhlet solvent extractor (SER 148; Velp Scientifica, Italy). Crude protein was determined by the semi-micro Kjeldahl method using Kjeldahl apparatus (Gerhardt Vapodest 30; Germany). The carbohydrate contents were calculated by the difference in the proximate composition, and were determined with the exception of moisture, crude ash, crude fat, and crude protein.
Aw measurements were taken for all samples, using water activity-measuring equipment (BT-RSI-7557 012; RSI, Switzerland).
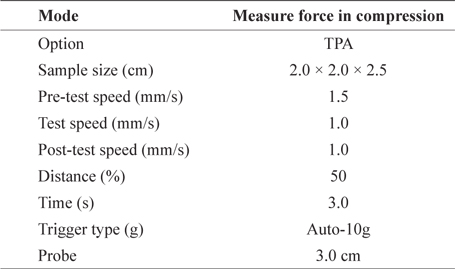
Texture profile analysis was performed using a texture analyzer (TA-XT2i; Stable Microsystems, Godalming, England). Before testing hardness, fracturability, adhesiveness, springiness, cohesiveness, gumminess, chewiness, and resilience, sea squirt meat samples were cleaned with paper towels and cut into 2.0 × 2.0-cm sections. The samples were pressed twice at 50% using a 3.0-cm cylindrical probe (P/3) at a test speed of 1.0 mm/s (Table 3).
[Table 3.] Operation condition of texture analyzer for sea squirt meat

Operation condition of texture analyzer for sea squirt meat
>
Volatile basic nitrogen measurement
Volatile basic nitrogen (VBN) was measured using the Conway micro diffusion method (Korean Food and Drug Administration, 2002). Two-gram samples were added to 16 mL of distilled water and 2 mL of 20% trichloro acetic acid, stirred for 2 min using a homogenizer, and then filtered. The remaining 1 mL of sample was placed into the outer chamber of a Conway dish with 1 mL of 0.01 N H3BO3in the inner chamber and 1 mL of saturated K2CO3 was quickly poured into the outer chamber. Then samples were mixed with K2CO3in the outer chamber and left at 37ºC for 80 min. After the reaction, 0.02 N HCl was dripped into the dish to take a measurement. To save time for each sample, VBN was measured for 50 days. VBN (mg%) = 0.14 × (Sample titration amount - Blank titration amount) × Factor × 100/Sample (g)
>
Total cell count measurement
The method used mixed the clinical material with standard agar medium so that it coagulated to culture bacteria and then aggregated the number of bacteria colony counts to calculate the total cell count. One milliliter of test solution and 1 mL of a solution diluted tenfold was placed onto sterilized petri dishes. Then 15 mL of sterilized standard agar medium, whose temperature has been maintained at 45ºC, was sprayed onto the plates. The plates were spun and tilted from side to side while being careful not to allow the medium to attach to the plate cover. The clinical material was mixed well with standard agar medium until it coagulated. The plates were placed upside down in an incubator at 32-37ºC for 24-48 h to culture bacteria. Finally the bacteria colony count was determined (Park et al., 2004).
>
Determination of in vitro digestibility
The
The sensory evaluation results were obtained using Minitab by RSM. Other data analysis was performed by followed Duncan's multiple range test using a one-way analysis of variance (ANOVA), expressed as the mean ± SD among treatments. The significance of results was set at 5% using SPSS (version 18.0; SPSS Inc., Chicago, IL, USA).
>
Sensory evaluation by group 1 (10 individuals aged 20-29 years)
The sensory evaluation performed in this study was based on a 9-point grade (1 was very bad, 5 was normal, 9 was very good), with the hedonic scale used in a questionnaire test of color, flavor, taste, texture, and overall acceptability for a panel of 10 adults aged 20-29 years (group 1). According to the central composite design, bottled sea squirt meat was prepared using a quadratic canonical polynomial model. The average sensory evaluation scores for those products are shown in Table 4.
[Table 4.] Central composite design response by group 1 panel (10 of twenties)

Central composite design response by group 1 panel (10 of twenties)
The ANOVA of the color, flavor, texture, taste and overall acceptability indicated a significant difference (
>
Sensory evaluation by group 2 (9 individuals aged ≥30 years)
The sensory evaluation performed in this study was based on a 9-point grade (1 was very bad, 5 was normal, 9 was very good), with the hedonic scale used in a questionnaire test of color, flavor, taste, texture, and overall acceptability for a panel of 9 adults aged ≥30 years (group 2). According to the central composite design, bottled sea squirt meat was prepared using a quadratic canonical polynomial model. The average sensory evaluation scores for those products are shown in Table 5.
[Table 5.] Central composite design response by group 2 panel (9 of more thirties)
Central composite design response by group 2 panel (9 of more thirties)
The ANOVA of the color, flavor, texture, taste and overall acceptability indicated a significant difference (
>
Nutritional evaluation of bottled sea squirt meat products
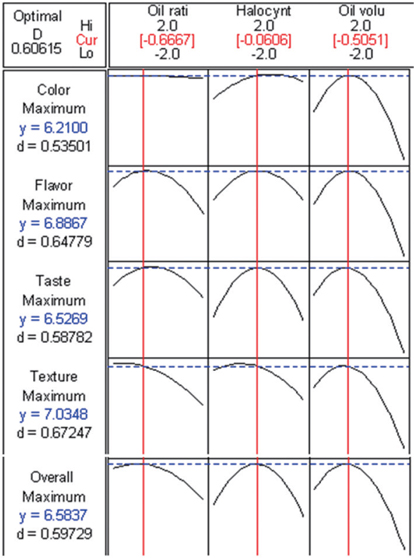
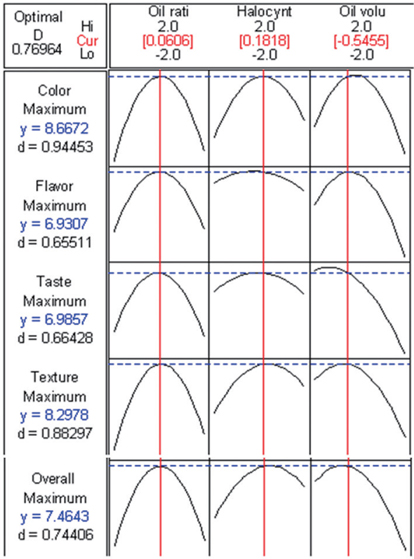
Nutritional evaluations were undertaken using the bottled sea squirt meat products prepared following the optimal recipes obtained from Figs. 1 and 2 (Table 6).
[Table 6.] Optimizing recipes of bottled sea squirt meat products by response surface methodology
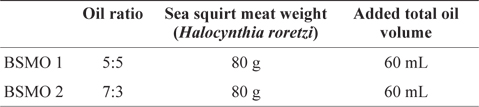
Optimizing recipes of bottled sea squirt meat products by response surface methodology
The proximate compositions of fresh sea squirt meat, dehydrated sea squirt meat, and bottled sea squirt meat in oil (BSMO 1 and BSMO 2) are presented in Table 7. The proximate composition of raw sea squirt meat was similar to that reported by the National Fisheries Research and Development Institute (NFRDI, 2009). A small difference in the composition of marine products can be related to the various environmental conditions at the time of the harvest, the season, and the location where the specimen was harvested. The moisture content of raw sea quirt meat was 88.73%, and that of the dehydrated sea squirt meat was 82.94%. The moisture content of BSMO 1 and BSMO 2 prepared at the optimal recipe was about 75%. The moisture content is known to decrease due to dehydration during pressing and the addition of vegetable oil, and these processes also resulted in a higher content of other components. Dipping dehydrated sea squirt meat in vegetable oil resulted in a higher lipid content than in raw and dehydrated sea squirt meat. The lipid content of BSMO 1 was 1.73% and that for BSMO 2 was 2.13%. Vegetable oil was thought to have permeated the sea squirt meat, which increased the lipid content of the sea squirt meat itself. The protein content of raw sea squirt meat was 6.04%, and BSMO 1 and BSMO 2 had a protein content of 10.04% and 10.23%, respectively. The ash content was 1.37% in raw sea squirt meat, 2.00% in BSMO 1, and 2.13% in BSMO 2. Moisture content is the most important factor for determining the shelf life of all of food products, especially seafood products. The lower moisture content in dehydrated sea squirt meat used in bottled products was thought to contribute to prolonging the shelf life of BSMO by improving the freshness related to enzyme activity.
[Table 7.] Proximate composition of sea squirt meat, dehydrated sea squirt meat, BSMO 1 and BSMO 2
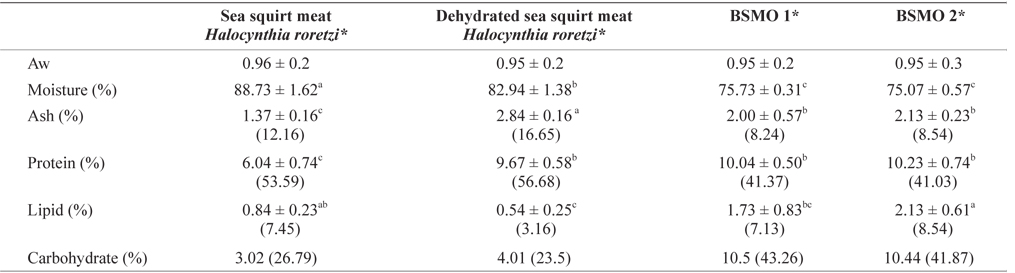
Proximate composition of sea squirt meat, dehydrated sea squirt meat, BSMO 1 and BSMO 2
The Aw results for the samples tested displayed no significant differences as shown in Table 7, and ranged from 0.96 in the raw samples to 0.95 in the bottled samples. Usually, an Aw of 0.9-1.0 is classified as water-rich and considered to be a suitable range for bacterial growth and chemical reactions to occur. Therefore, all of the sea squirt meat samples had a weakness in terms of storage stability and had to be preserved to prevent spoilage (Pigott and Tucker, 1990). The predominant component in seafood is water, particularly free water, which can easily interact with other ingredients and promote enzyme activity and the growth of microorganisms. Therefore, the free water content should be lowered or changed to bound water. Because bound water is dependent on water activity, a lower water activity would guarantee storage stability.
Table 8 shows the texture properties of fresh sea squirt meat and bottled products (BSMO 1 and BSMO 2). The bottled sea squirt meat had higher values of hardness, springiness, cohesiveness, gumminess, chewiness, and resilience than fresh sea squirt meat. Because olive oil and sesame oil permeated into the sea squirt meat, the physical demerits such as elasticity and chewiness rendered it inferior to fresh meat.
[Table 8.] Texture properties of sea squirt meat, BSMO 1 and BSMO 2
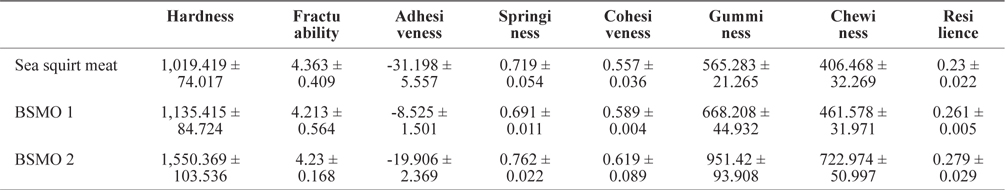
Texture properties of sea squirt meat, BSMO 1 and BSMO 2
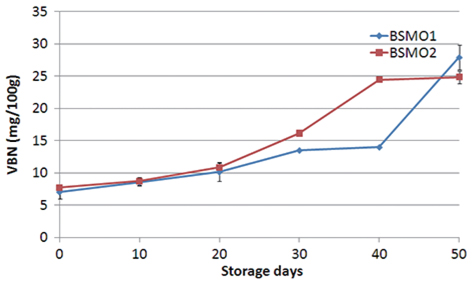
Determining the VBN content can be used to assess the freshness of preserved samples. The experiment investigated changes in the freshness and storage stability of the bottled sea squirt meat products during 50 days of storage at 4°C. The experiment was undertaken at 10-day intervals, and the results are shown in Table 9 and Fig. 3. The VBN content of both BSMO 1 and BSMO 2 increased as the period of storage became more prolonged. The VBN of BSMO 1 rapidly increased until 40 days of storage, whereas it rapidly increased until 30 days of storage and then reached a maximum value for BSMO 2. When evaluating the freshness of the food by VBN content, although differences existed between varieties, 25 mg/100 g (Cho et al., 1985) or more is considered to be the level that represents the early decomposition phase for marine products. Because in both BSMO 1 and BSMO 2, the VBN content did not exceed 25 mg/100 g after 40 days, it was considered to have remained fresh. However, after 50 days, the BSMO 1 approached the 25 mg/100 g threshold, and thus in terms of the VBN content, the food could be safely stored for up to 50 days.
[Table 9.] Change in VBN of BSMO 1 and BSMO 2
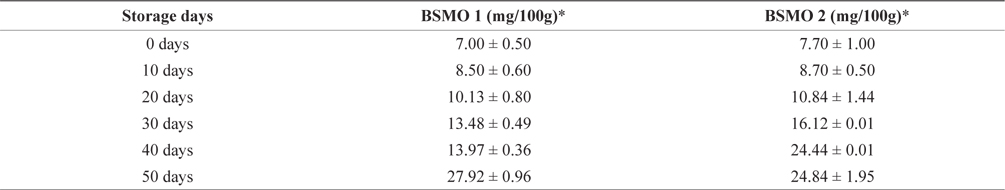
Change in VBN of BSMO 1 and BSMO 2
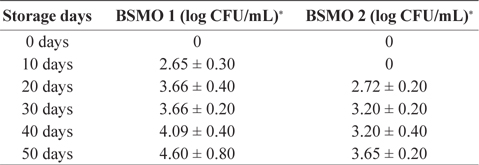
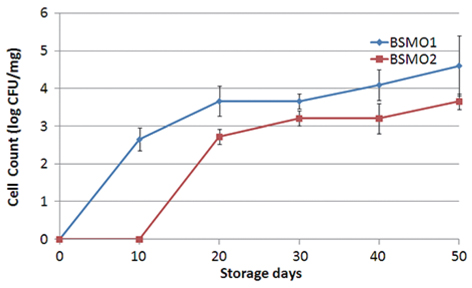
A total cell count of microorganisms was undertaken for BSMO 1 and BSMO 2, and the results are shown in Table 10 and Fig. 4. In both BSMO 1 and BSMO 2, as the preservation period passed, the total cell count increased with storage time up to 50 days. In BSMO 1, the bacterial count was checked before 10 days storage, but for BSMO 2, the same total cell count was only noted at 20 days storage. The results revealed that samples with a higher proportion of olive oil were more effective in retarding growth. BSMO 1 and BSMO 2 were therefore considered to be safe in terms of microbiological hazards because the cell count of general bacteria was less than 5 log CFU/mL, as suggested by the Korean Food and Drug Administration (2002).
[Table 10.] Change in total cell count of BSMO 1 and BSMO 2

Change in total cell count of BSMO 1 and BSMO 2
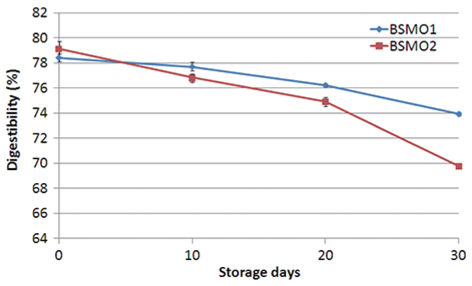
Protein is a major component of sea squirt meat products in which moisture has been removed. The samples tested here had a protein content of more than 50% on a dry weight basis. In this study, the change of
[Table 11.] Change in in vitro digestibility of BSMO 1 and BSMO 2
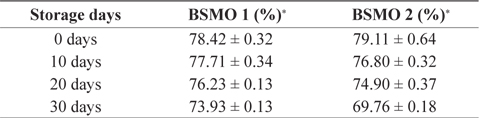
Change in in vitro digestibility of BSMO 1 and BSMO 2