Rice is a primary food crop and edible grain, and is used by 65% of the Chinese population as a staple food. China is the world’s largest rice producer and consumer, accounting for more than 30% of the total produced and consumed. However, with recent reforms and economic development, the diet and food habits of the Chinese population are diversifying. As meat consumption grows continuously, per capita rice consumption has declined from 85.9 kg in 1991 to 67.6 kg in 2008 (Feng et al., 2010).
Thai Jasmine rice has historically been popular in China because of its non-glutinous, fluffy texture and fragrant smell. Additionally, this rice has a high nutritional value, which makes it attractive to more and more Chinese consumers. At present, China imports ~300,000 tons of Thai rice annually, a large part going to southern coastal areas (Guangdong province); in particular, Thai rice represents more than 70% of rice consumed in Hong Kong. However, a diet based on Western-style fast food is becoming more common in China. The high energy and sugar levels in these foods lead not only to obesity but also to diabetes, coronary heart disease, and various types of cancer. In contrast, the traditional Oriental diet, based on grain and plants with rice as a main element, seems to be more healthy and balanced. It is therefore becoming increasingly important to enhance the nutritional value of white rice and to improve its taste.
This research focused mainly on addition of seaweed and olive oil during cooking rice; we investigated formulas and explored their nutritional values according to food nutrition theory and statistical analyses. Refined white rice lacks dietary fiberadding sea tangle can make up for this deficiency. Sea tangle contains alginic acid (11-45%), fiber, and mannitol, which cannot be digested, in addition to kelp elements (Lee et al., 2002). All components have multiple health benefits, such as regulating blood lipids, lowering blood glucose and blood pressure, and anti-coagulation, anti-tumor, anti-virus, anti-radiation, and immunity-enhancing functions. In addition, sea tangle is rich in protein, vitamins, and minerals, especially iodine, calcium, selenium, and other nutrients beneficial to humans (Choi et al., 2003).
It is the custom when cooking Thai Jasmine rice to add animal fat. This can improve the taste of rice, and make it soft and smooth in texture. However, animal fat contains a high level of cholesterol and saturated fatty acids, which may cause health problems such as cardiovascular diseases, high blood sugar, and high cholesterol. Olive oil may be a suitable alternative. While some components of the Oriental diet may protect against heart problems, the higher sodium content of sauces counters any benefit. Many cooks use salt when cooking rice dishes to prevent them from boiling over, but using a dash of olive oil and reducing the heat slightly is an alternative solution. Olive oil can improve metabolic function because it has marked antioxidant activity and is rich in vitamins and unsaturated fatty acids. It has important effects in lowering blood glucose, cholesterol, and in preventing cardiovascular disease, as well as in improving digestive system functions and controlling obesity.
The glycemic index (GI) reflects the rise in blood sugar after eating. It can track changes in blood glucose caused by the digestion and absorption of food. In addition, it reflects the effect of food on blood sugar. Food with a high GI can be digested rapidly and absorbed into the blood, causing blood sugar to peak (Wolever et al., 1991). Rice is important in blood sugar regulation if used as a staple food. A rise in blood sugar can increase the sugar intake of muscle, liver, and adipose tissue, and can also inhibit glycogen release during hepatic lipolysis. Consumption of food with a high GI can accelerate this process and lead to fat and sugar being absorbed rapidly. The decrease in fat and sugar can lead to reactive hypoglycemia and 48higher free fatty acid levels. This may result in the sensation of hunger. If this trend continues, chronic metabolic disease will emerge slowly. The GI of food is a quantitative value that represents food glycemic effects compared to those of a standard control food (glucose). It is a physiological parameter that reflects the carbohydrate level of a food (Brand-Miller et al., 1999). All carbohydrates in the human body are digested and degraded to monosaccharides, leading to an increase in blood sugar and inducing the body to produce signs of satiety. The secretion of insulin allows blood glucose to ceil to restore normal blood glucose levels. A rapid reduction in insulin level may lead to sudden hunger. Therefore, it is preferable to maintain blood glucose at a stable level in both normal individuals and those with diabetes. Food with a low GI can cause the blood glucose level to decline slowly, while food with a high GI facilitates absorption by the tissues of blood glucose. The carbohydrate content does not chemically reflect the degree of utilization and the GI enables a new, nutritional evaluation method for carbohydrate-rich food.
>
Materials and standard recipe
We used a fragrant type of Thai Jasmine rice (Golden Elephant Brand, Tsing yi, Hong Kong) produced by Tresplain Investments, Ltd., Hong Kong (10 kg). This is a non-elutriating (vacuumed) rice series and did not need to be washed before cooking. We additionally used dried sea tangle
The standard recipe was as follows:
1. Weigh 300 g of Thai Jasmine long-grain rice.2. Add water, sea-tangle, and olive oil according to the central composite design.3. Steep for 20 min.4. Cook using electric cooker under low-pressure conditions.
>
Cooked long-grain Jasmine rice (CLR)
CLR was prepared using an electric cooker (0.9-1.0 kg/cm2 pressure; Cuckoo Electronics Co., Ltd., Yangsan, Korea).
>
Cooked long-grain Jasmine rice containing sea tangle and olive oil (CLTR)
CLTR was prepared using an electric cooker. The ratios of CLR, sea tangle, water, and olive oil followed those in Tables 1 and 2 (the central composite design).
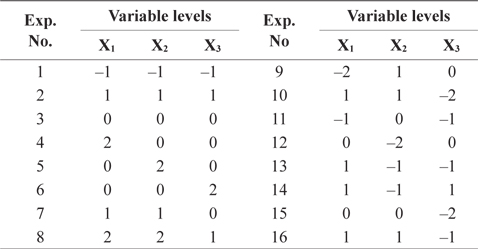
[Table 1.] Independent variables and their levels for central composite design
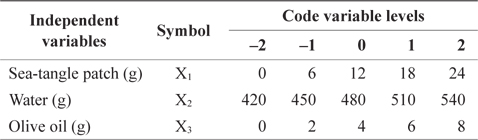
Independent variables and their levels for central composite design
[Table 2.] Arrangement of the three-variable, five-level response surface design
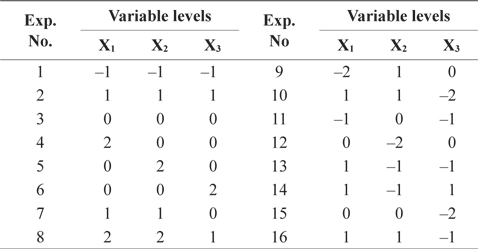
Arrangement of the three-variable, five-level response surface design
A response surface design was used to investigate the relative contributions of different variables to rice quality, and to determine optimal CLTR formulas. The objectives of this study were to optimize the mixture ratio for CLTR containing sea tangle and olive oil, and to compare CLTR to CLR based on taste and nutritional value (Ryu et al., 2004).
>
Central composite design for RSM
RSM was used in this trial to investigate the simultaneous effects of three compositional variables: sea tangle (0-24 g), water (420-450 g), and olive oil (0-8 g) (Table 1). These three factors were expressed as X1, X2, and X3, respectively (Ryu et al., 2004). Five content levels of each variable were used in accordance with the principles of the central composite design. For statistical analysis, the five levels of the three variables were coded as –2, –1, 0, 1, and 2. We also analyzed the effects of any interactions among the variables on the quality of CLTR using RSM. The arguments were coded according to the equation:
xi = (Xi -X0)/ΔX,
where xi is the coded value of the independent variable, Xi is the true value of the independent variable, X0 is the true value of the experimental center point from the variable, and ΔX is the step change of the variable. The average sensory evaluation score, Y, is the response value. The relationships between coded variable levels (x1) and true values (X1) are as follows:
x1 = ( X1 – 4)/2x2 = ( X2 – 480)/30x3 = ( X3 – 4)/2
We used the statistical software Minitab version 16 in this study. The number of formulas in the optimizing design was 16, as shown in Table 2.
Twenty-six Chinese panelists, ~40 years old and from various professions and social classes, were divided into two teams and completed sensory evaluation questionnaires independently. A questionnaire with a nine-point hedonic scale was used to record results regarding color, glossiness, flavor, adhesiveness, and overall acceptability, as follows: very good (9), good (7), neutral (5), bad (3), unacceptable (1). Panelists first evaluated the smell of rice when hot, and then observed its color and shape. Lastly, they evaluated taste by chewing the rice. All panelists received sensory evaluation education before performing this evaluation. Clean drinking water was provided for rinsing between samples (Wu et al., 2009). Scores were then summarized and averaged.
The various CLTR and CLR formulas were cooked using a rice cooker. The texture of cooked rice was then measured with a texture analyzer (model TA-XT2; Stable Microsystems, Surrey, UK) using the compression test (5). One gram of cooked rice was arranged in a single-grain layer on a base plate. A compression plate was set 5 mm above the base. A two-cycle compression force versus distance program was used to allow the plate to travel 4.9 mm, return, and repeat, with a test speed of 1 mm/s. A cylindrical plunger, 50 mm in diameter, was employed. We used hardness (height of the force peak on the first cycle), adhesiveness, cohesiveness, springiness, and gumminess as parameters (Pitiphunpong et al., 2011).
We aimed to determine the optimal cooking conditions for CLTR from contour and response surface plots of overall acceptability; we then used Minitab to analyze the sensory evaluation results. Furthermore, we used SPSS version 11.5 (SPSS Inc., Chicago, IL, USA) for multivariate analysis. Significant differences between means were detected by Duncan’s multiple-range test at α = 0.05 (Ryu et al., 2004). The results were measured by variance analysis and effectiveness. Duncan’s multiple range tests were used to determine the effectiveness of those projects which have effective values. Incremental area under the curve (IAUC) was calculated using the geometric method, and the GI of the other two groups was calculated by assuming that the IAUC of glucose is 100% (Wolever et al., 1991).
The proximate compositions of all samples were determined using the following Association of Official Analytical Chemists (AOAC) procedure (AOAC, 1990). Sample moisture was determined after drying at 105℃ to constant weight. Crude protein was calculated by multiplying the nitrogen in the samples by a factor of 6.25, using the semi-micro Kjeldahl method (Gerhardt Vapodest 30). Crude lipid (Soxhlet extraction) and ash (gravimetric) contents were also determined using AOAC methods (AOAC, 1990). The carbohydrate concentration was calculated by subtracting the concentrations of moisture, crude protein, crude lipid, and ash from the sample. The concentration of total dietary fiber (TDF) was measured using the Prosky method (Prosky, 2003).
>
Determining in vitro protein digestibility
The
% Digestibility (3-enzyme method) = 234.84 – 22.56 x, where x is the sample pH at 20 min.% Digestibility (4-enzyme method) = 1.03 × (3-enzyme digestibility) – 0.34.
>
Determining in vitro starch digestibility
The
>
Measurement of degree of gelatinization
The degree of starch gelatinization was measured by malt diastase, using the Yamasita method (Yamasita, 1968).
This study was conducted using internationally recognized GI methodology. The function of the GI in preventing chronic diseases has been confirmed since the 1990s (Wolever et al., 1991). Subjects fasted overnight prior to each study day. We used 8-12 subjects assigned in random order to each group. We evaluated the test meal by measuring blood glucose levels in the group subjects over 2 h. The carbohydrate content of CLTR and CLR, equivalent to 50 g glucose for each meal, was calculated by proximate composition. We used glucose (50 g) as a control food in this study. The GI of the test meal was calculated using the method of Wolever et al. (1991). To minimize day-to-day variation in glucose tolerance, the reference food was tested three times for each subject. Ten healthy subjects 20-30 years of age were recruited. All test and reference foods were served with 200 mL of water. Each subject was asked to consume 50 g available carbohydrate portions of test food and reference food. Finger capillary blood samples were collected at the start of eating and 15, 30, 45, 60, 90, and 120 min after food consumption. A glucose meter was used to collect finger capillary blood samples (1-2 μL; ACCU-CHEK Active Test Strips, Mannheim, Germany). We tested each group at 3-d intervals (Yuan et al., 2011). We compared CLTR with CLR and glucose, to determine whether CLTR decreased and stabilized blood glucose.
Test food GI = (Test food IAUC/ Reference food IAUC) × 100%.Glucose GI (reference food) = 1.
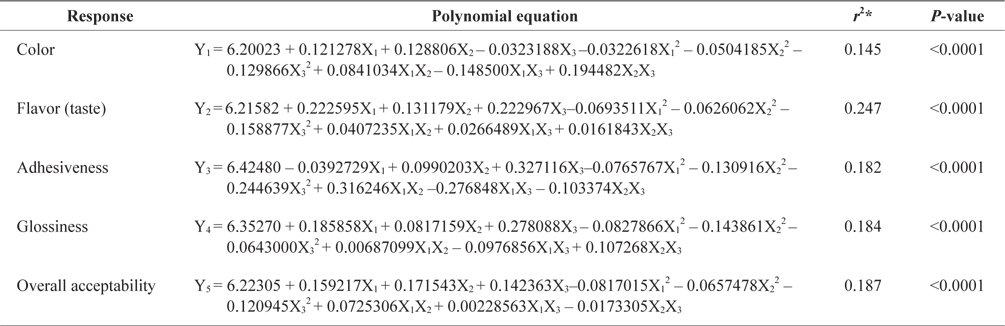
A response surface regression model can be built to optimize response factor levels using Minitab version 16. Based on the 16 CLTR formulas according to the central composite design, the average sensory evaluation score can be considered as the response value (Table 3). We used a quadratic canonical polynomial model for the 16 formulas (Ryu et al., 2004). The experimental data in Table 3 were processed using quadratic regression fitting and tested using lack-of-fit and significance tests of regression coefficients for the mathematical model predicting sensory scores of CLTR with different formulas. The experimental data were processed based on polynomial regression analysis, using sensory evaluation as the response variable. This analysis determined the polynomial equation model (Table 4).
[Table 3.] Central composite design arrangement and responses by Chinese forties
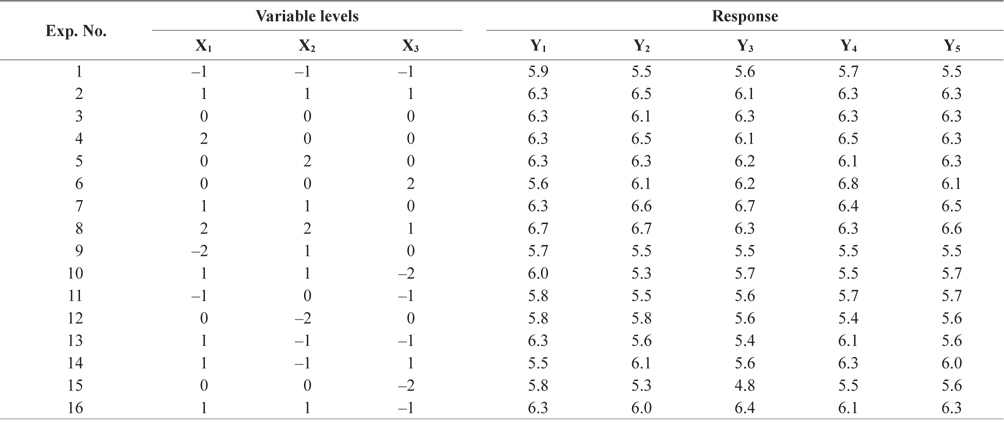
Central composite design arrangement and responses by Chinese forties
[Table 4.] Response surface methodology program-derived polynomial equation by the Chinese forties

Response surface methodology program-derived polynomial equation by the Chinese forties
The
[Table 5.] SAS output of ANOVA table for overall acceptability by the forties
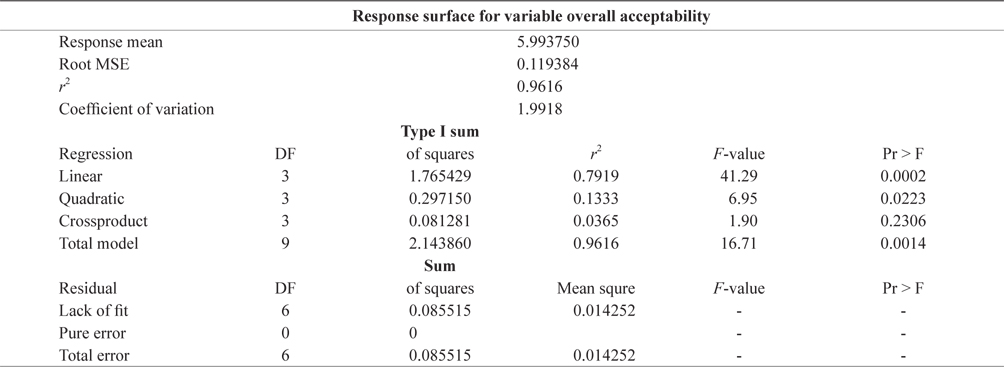
SAS output of ANOVA table for overall acceptability by the forties
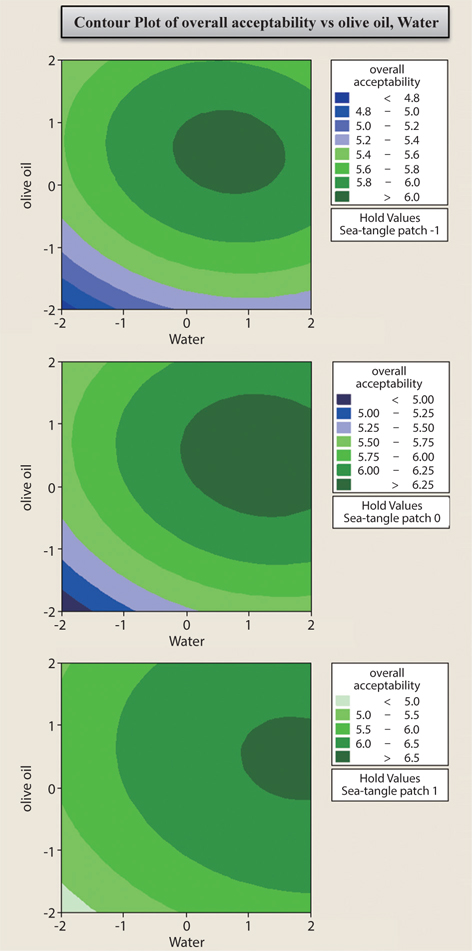
The experimental data were processed using Minitab version 16, and plotted using statistical analysis software. The best CLTR recipe was analyzed using the response-surface methodology, including contour and response surface plots. The RSM graph shows a specific response variable, Y, and the corresponding arguments comprise a three-dimensional diagram. The graph reflects any influence of the arguments on the response variables. Figs. 1 and 2 reflect the impact of various factors on the response value. In a contour map, the extreme condition should be at the center of the circle. The response surface chart shows the impacts of various interactions (sea tangle and water, sea tangle and olive oil, and water and olive oil) on sensory evaluation scores. The sensory score for all five variables increased with increasing amounts of sea tangle, and the score was maximal when the amount of sea tangle peaked. Fig. 1 shows the contour map of the overall acceptability of all response variables for 6 g, 12 g, and 18 g sea tangle.
Fig. 1 reflects the fact that the subjects did not mind the taste and texture of sea tangle and that its acceptance was quite high. The average age of the 26 panelists was 40 years, putting them in a middle-aged category of people, who tend to pay more attention to health because the incidences of diabetes and cardiovascular disease are higher in middle-aged individuals. This category of person also has more nutritional knowledge, and is aware that sea tangle is high in dietary fiber, as well as a variety of healthy bioactive substances. Thus, they may consume more sea tangle in their diets than other groups. Therefore, the sensory evaluation may have been somewhat subjective, possibly leading to higher scores.
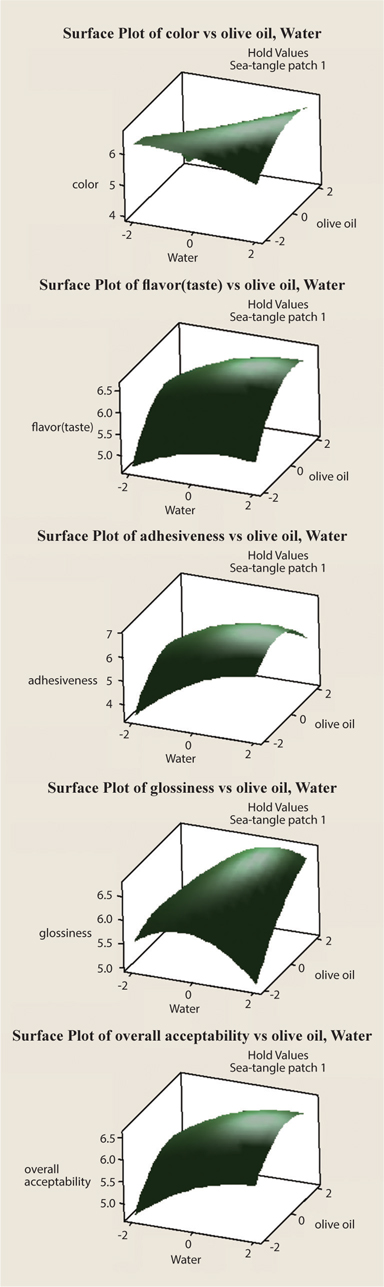
This study also includes the sensory evaluations of college students, ~20 years old. The diet of such young people is more biased toward Western-style fast food that includes fried food. A meat-based diet is predominant, and the acceptance of staple lant-based foods is relatively low. Our test results showed that the scoring of the five variables by young people declined with the addition of sea tangle. The highest average score given by this group was to rice without sea tangle. It will get more praise if olive oil is added. As these results did not match the goals of our study, this group was excluded from further analysis or discussion. Fig. 2 shows the response surface plot of the five variables when the sea tangle content was maintained at 18 g (X1 = 1).
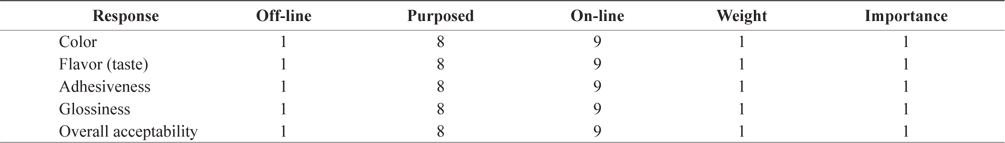
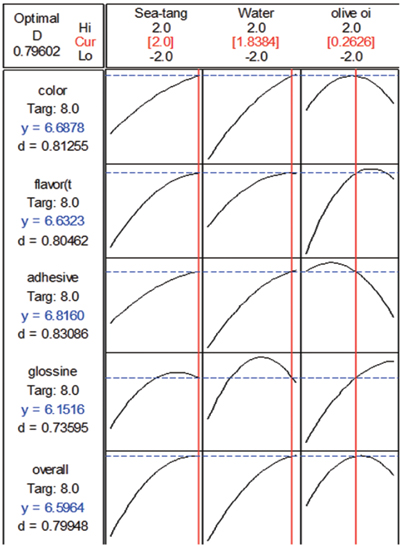
We found that color, flavor, adhesiveness, and glossiness strongly correlated with overall acceptability. According to the response surface plot of sensory scores, the sea tangle peak appeared when the water and olive oil contents were constrained. The best CLTR recipe was determined using the Minitab response optimizer, assuming a sensory score goal of eight points. With this recipe, responses for the five variables using sensory evaluation are optimized. The maximum point of the comprehensive response surface map, also called the optimal level of the three main factors, can be determined by deriving a regression equation and setting the response surface map to zero. The goals, purposes, on-line, weights, and importance of the five variables are shown in Table 6 (Cao et al., 2009). The Minitab response optimizer analysis result is shown in Fig. 3.
[Table 6.] Response value optimization settings

Response value optimization settings
The optimal CLTR formula was 34.8% rice, 2.8% sea tangle, 61.9% water, and 0.5% olive oil. According to our analysis of the Minitab response optimizer, the optimum CLTR recipe occurred when the amount of sea tangle was the maximum of the target scope while the amounts of water and olive oil were in a horizontal scope, which is consistent with experimental targets. Early in the study, we used the central composite design to identify the key indicator of the optimum CLTR recipe and to determine the horizontal range of the optimum amounts, on the basis of preliminary experiments and review of the literature. The amount of sea tangle to be added should be determined based on (i) the fact that the primary CLTR cooking implement may be a general household rice cooker, and (ii) that 300 g of rice are usually set as the standard. We conducted preliminary experiments and determined that at a sea tangle content ≥ 30 g, the overall appearance of the rice becomes unappetizing and CLTR palatability decreases. Therefore, the optimal amount of sea tangle in CLTR recipes is 24 g.
Using RSM, we established a quadratic mathematical model of the key factors affecting CLTR quality. The model was statistically tested and the optimum CLTR recipe was determined, as follows: 34.8% rice, 2.8% sea tangle, 61.9% water, and 0.5% olive oil. For analysis of texture and nutritional quality of CLTR recipes, rice was cooked alone and with sea tangle and olive oil under the same conditions (Ryu et al., 2004). The textural analysis of CLTR using optimized recipes is shown in Table 7.

Texture profile analysis of cooked Thai Jasmine rice, long grain Indica var (CLR) and CLR containing grainy sea-tangle patch (CLTR)
Compared to CLR, CLTR had a lower hardness, but higher springiness and cohesiveness. However, CLR and CLTR had identical adhesiveness and chewiness (
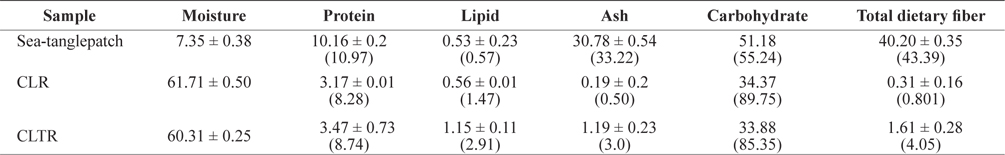
The proximate compositions of dried sea tangle and CLTR and CLR recipes are shown in Table 8. Dried sea tangle is high in dietary fiber; therefore the CLTR recipes containing sea tangle (2.8%) had more dietary fiber and health benefits than CLR. Furthermore, CLTR is higher in protein and ash than CLR.
[Table 8.] Proximate composition and total dietary fiber content of sea-tangle, CLR and CLTR

Proximate composition and total dietary fiber content of sea-tangle, CLR and CLTR
>
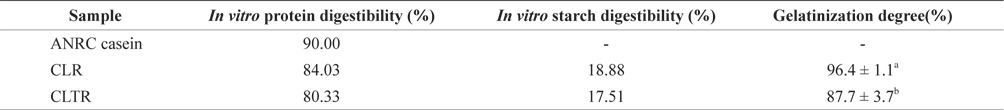
Protein and starch digestibility
[Table 9.] In vitro protein and starch digestibility, and gelatinization degree of CLR and CLTR (%)

In vitro protein and starch digestibility, and gelatinization degree of CLR and CLTR (%)
The starch digestibility and the degree of gelatinization of CLTR were also lower because the dietary fiber and active substances in kelp can constrain the activity of α-amylase. Likewise, physical attributes, such as size, temperature, and cooking time, are influenced by the added olive oil. Under these conditions, the degree of gelatinization is reduced.
>
Postprandial glucose responses of CLTR and CLR
We tested CLTR, CLR, and glucose as a reference food in 50-g portions of available carbohydrates (Yuan CS et al., 2011) (Table 8). The formula was as follows:
Test food quality = 100 × 50/CHO (Test food %).
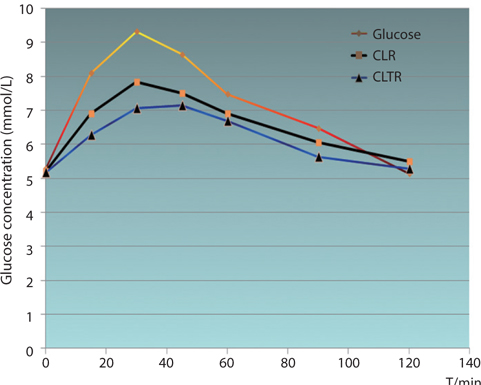
When testers consumed 148 g of CLTR, 145 g of CLR and 50 g of glucose, glucose response times differed. Blood glucose levels increased rapidly in the first 30 min, when testers consumed CLR and glucose, and then declined substantially. However, the blood glucose levels of testers who consumed CLTR stabilized after 30 min, and the rate of decline was slow. For testers who consumed CLTR, the highest blood glucose level was 7.4 mmol/L; for those who consumed CLR, the highest value was 10.1 mmol/L; and for those who consumed glucose, the highest value was 10.9 mmol/L. Therefore, the blood glucose levels of testers who consumed CLTR was lower than those of testers who consumed CLR and glucose (Fig. 4).
>
Influences of CLTR and CLR on GI
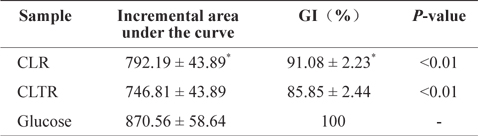
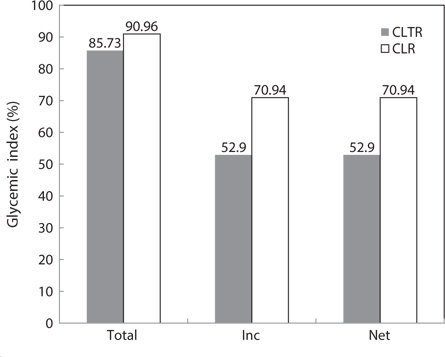
Testers were required to eat 148 g of CLTR, 145 g of CLR, or 50 g of glucose. Then, for 2 h, we tested the IAUC to determine the GI. Given a glucose GI of 100%, we compared the GI of CLTR and CLR. The IACU and GI of glucose and CLR were markedly higher than those of CLTR (
[Table 10.] The influences of CLTR, CLR and glucose on GI

The influences of CLTR, CLR and glucose on GI
The GI of CLTR was considerably lower than those of glucose and CLR, as was the glucose response level. Furthermore, the natural quality of CLTR was lower than that of CLR, considering primary nutrients. Therefore, as the main component, CLTR could improve the quality of the modern diet and lower postprandial glucose levels, which will ameliorate obesity.
Thai Jasmine rice has a high starch digestibility, which leads to an increased GI. Therefore, diabetes patients may require modified cooking methods. Our study focused on adding sea tangle and olive oil as auxiliary ingredients, optimizing the recipe, and analyzing the nutritional value of the optimum formula according to food nutrition theory and statistical analysis. The optimal CLTR formula was 34.8% rice, 2.8% sea tangle, 61.9% water, and 0.5% olive oil. Compared to CLR, CLTR had a lower hardness, but higher springiness and cohesiveness. However, the two had identical adhesiveness and chewiness (
The degree of gelatinization,
The GI of CLTR was considerably lower than those of glucose and CLR, as was the glucose response level. Furthermore, the natural quality of CLTR was lower than that of CLR, in terms of primary nutrients. Therefore, as an important component, CLTR could improve the quality of the modern diet and lower postprandial glucose levels, which will ameliorate obesity. Twenty years of research indicates that the glucose response in the body after ingesting starch-rich food is similar to the digestion rate of carbohydrates outside the body, when starch content is similar (Englyst et al., 1996; Araya et al., 2002). Therefore, starch hydrolysis, based on enzymes, can be used to predict the glucose response of the body to food (Gee and Johnson, 1985). Using
Various ingredients affected CLTR pasting properties due to processing effects, types of ingredients, and differences in hydration/swelling behaviors. The physical state of rice, such as its size, as well as temperature and cooking time, are influenced by the abundant fiber in CLTR, and olive oil. Under these conditions, both the degree of gelatinization and the GI are reduced. As reported by Barclay et al. (2008), ingestion of low-GI foods can reduce the risk of diabetes, coronary heart disease, breast cancer, and other chronic diseases because such food has less effect on blood glucose levels.
Instant noodles, developed for many years in China, have become common consumer goods. However, few types of instant rice are available, although more are under development. We propose that long-grain Thai white rice containing sea tangle can be sold as instant rice in the Chinese market, as stated by C.J. Hetbahn. Compared with common long-grain rice, CLTR can improve the organoleptic quality and, more importantly, the GI. Our results show that CLTR can contribute to development of a healthier meal for both families and the fast food industry. Moreover, CLTR may have the potential to replace instant noodles and be widely accepted in southern China, benefiting the economy.