Selectivity of trawl gear is related to pulsing or fluttering of the codend by wave and ship motion and by the wake of the gear (O’Neill et al., 2003; Jones et al., 2008) as well as by mesh size, hanging ratio, and mesh type such as the square mesh window. The motion of the codend also causes turbulent flow inside the codend (Kim and Whang, 2010; Kim, 2013) which may affect the fish swimming and escape responses (Broadhurst et al., 1999; Webb and Cotel, 2010).
The motion of the otter board can change the shearing force or distance between the otter boards and affect net gear motion in terms of net height or spread (Crewe, 1964; FAO, 1974; Lee et al., 1986). The tilt of the otter board caused by rigging (FAO, 1974), wave, and contact with the bottom (Park et al., 1993; Matsushita et al., 2005; Politis et al, 2012) can be affected by stability in action and spreading efficiency (Lin et al., 1989; Matuda et al., 1990). The damping motion of a trawl has been observed in warp tension (Koyama et al., 1968; Matsushita et al., 2005). However, the variation in warp tension has not been analyzed in terms of its periodicity or amplitude in relation to wave or bottom condition. Pulsing codend motion has been investigated under sea state in field conditions, and was associated with higher escape rates in high seas (O’Neill et al., 2003).
The turbulent flow inside the codend has been measured and analyzed in model experiments (Pichot et al., 2009) and in relation to tilt of the codend as a certain period with damping on a shrimp beam trawl (Kim, 2012) and bottom trawl (Kim, 2013). The entire motion of the codend, such as tilt or turbulence, may be closely related to wave motion and the ship’s motion connected through warp, the otter board, the pendant, and the wing and bag nets. However, those effects on fishing gear shape, particularly on variations in partial gear motion, have not been investigated. The purpose of this study was to examine the tilt variations in otter board and codend motion, particularly in yaw, pitch, and roll, by comparing tilt periods and amplitudes.
Preliminary experiments on the tilt of bottom trawl gear used on the training ship
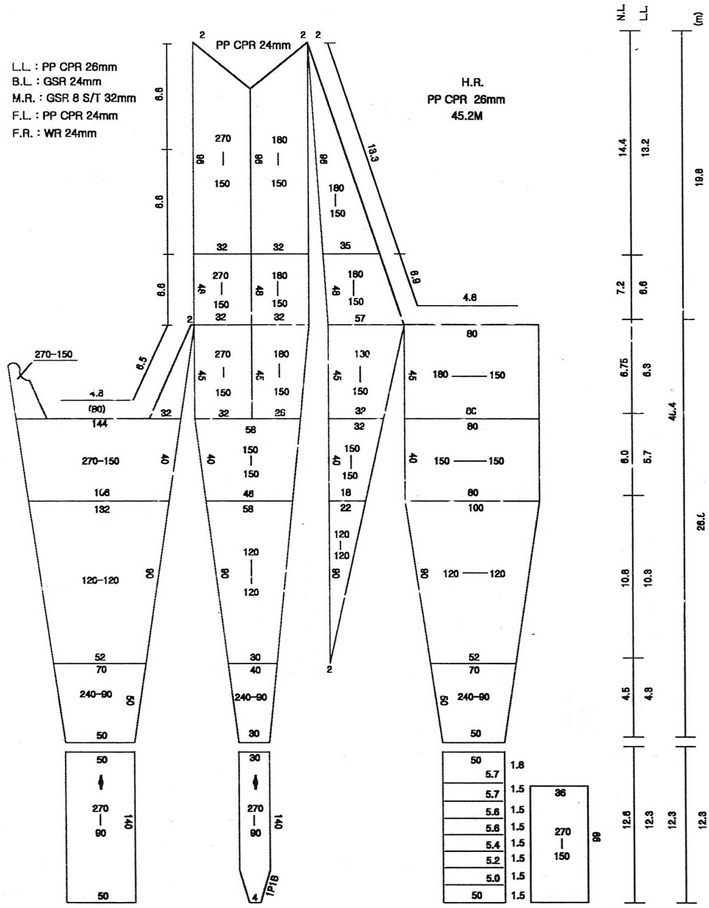
The experimental fishing gear was a bottom trawl towed by the training vessel
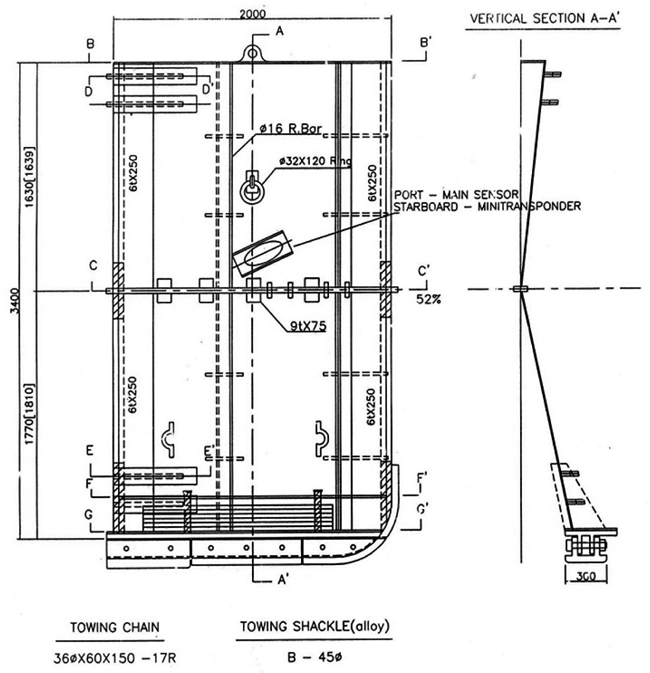
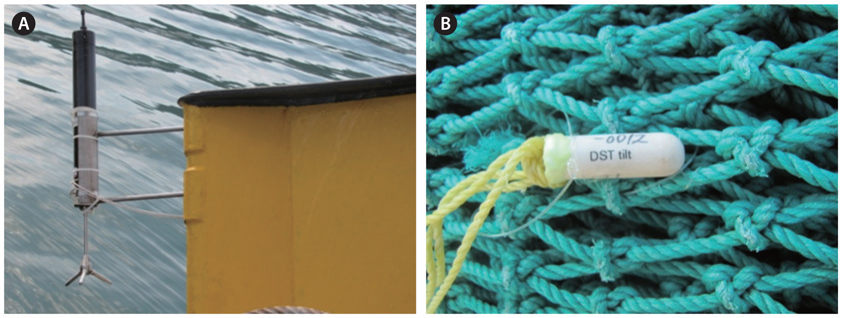
The tilt of the otter board was measured by Vector (Nortek, Rud, Norway) (Kim, 2013). The overall length of Vector was 55 cm, diameter was 7.5 cm, and it weighed 1.5 kg in water. It also included sensors for measuring temperature (accuracy, 0.1℃), yaw (compass accuracy, 2°; resolution, 0.1°), tilt (accuracy, 0.2°; resolution, 0.1°), and depth pressure (accuracy, 0.25%; resolution, 0.005%) with a 1-s sampling interval. Vector was fixed 40 cm from the trailing edge at the upper part of the otter board on the port side using an extended stainless frame (15-mm diameter), as shown in Fig. 3A. A positive pitch indicated forward down, and a positive roll indicated tilt to starboard in the range of ±180° when Vector was positioned vertically parallel to the trailing edge of the upper panel of the otter board. Yaw indicated a compass heading of 360°.
The tilt of the codend was measured by a DST-tilt logger (Star-Odi, Gardabaer, Iceland) fixed at 1.5 m anterior to the end of the codend in the middle upper panel, as shown in Fig. 3B. The specifications of the tilt sensor were diameter 15 mm, length 46 mm, weight in water 12 g, depth accuracy 0.4% (resolution, 0.03%), tilt accuracy 1° (resolution, 0.1°), temperature accuracy 0.1℃, and sampling interval 1 s. The yaw, pitch, and roll tilt of the DST-tilt logger were the same as for the Vector on the otter board.
Seven fishing operations were carried out, mostly south of Geomun Island in the South Sea of Korea at depths of 90-94 m with warp length of 500 m, except trial 4 west of Galdo with warp length of 300 m southwest of Tongyoung on October 6-7 and November 28, 2011 (Table 1). During the fishing trials, sea conditions were mostly calm, with wave heights <1 m. The towing speed of the fishing boat was determined using a built-in acoustic Doppler current meter (TS-310; Tokimec, Tokyo, Japan), and over-the-ground speed was measured using a global positioning system.
[Table 1.] Conditions for the seven experimental fishing trials using the bottom trawl
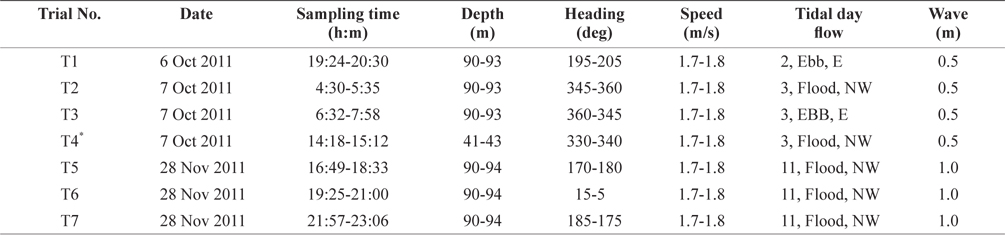
Conditions for the seven experimental fishing trials using the bottom trawl
The tilt data from Vector and the DST-tilt sensor were processed for periodicity and amplitude to assess the relationship between the otter board and codend. The time series of the tilt data such as yaw, pitch, and roll were analyzed as period by FFT in MATLAB software (Matlab, Inc., Natick, MA, USA); period estimation using the global wavelet method and software from Torrence and Compo (1998) was also performed. However, these methods could only be used for period without amplitude as angular change and were thus unsuitable for widespread periodic data. Therefore, event analyses such as calculation of peak and valley values in the tilt data were adapted by self-made software referred to in Narasimha et al. (2007). When the tilt angle increased to the peak and then decreased in consecutive time-series data, that peak value was detected as positive, and the lower valley value was detected as a negative valley event value. The minimum time interval between peaks or valleys was limited to >3 s, and the threshold value between the peak and valley had a mean value of ±0.5 standard deviations (SDs). The mean period was estimated from the average of the total intervals between peaks and between valleys, whereas mean amplitude was estimated from the angular difference between a peak event and a valley event occurring consecutively as a pair.
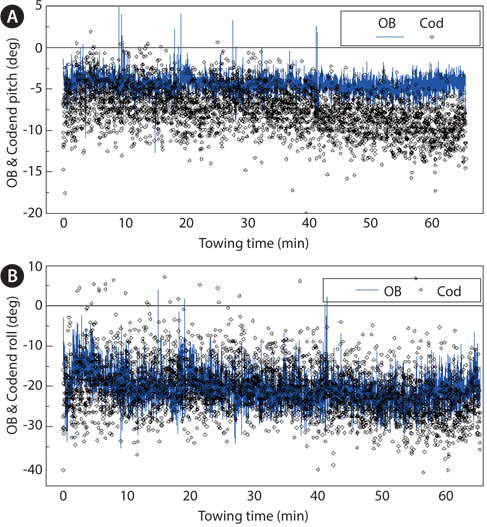
The tilt of the otter board and codend varied with towing time, as shown in Fig. 4, and the mean values and SD of yaw, pitch, and roll are shown in Table 2. The yaw angle of the otter board and codend may have been affected by trawler towing direction. The negative mean pitch of the otter board was –3 to –7°, and roll ranged from –5 to –25°, indicating that the orientation of the upper of the part otter board was slightly backward and outward. The mean value of the pitch or roll in the codend was slightly deflected to the other side from the middle angle and was distorted due to the smaller tilt sensor. However the SD as a measure of tilt fluctuation was the main interest in this study to analyze the relationship between the otter board and codend motion. The SD of yaw in the otter board was included as SD of yaw in the codend (3-8°), and no significant difference was observed. The SD of pitch in the codend (3-18°) was greater than that in the otter board (1-3°), and the SD of roll in the codend (4-22°) was greater than that in the otter board (4-8°). The large variation in pitch and roll in the codend may derive from more flexible netting and its free end motion compared with the otter board. Additionally, the SDs of pitch and roll of the codend as recorded by the DST-tilt logger were greater than those recorded by Vector in the frame due to differences in the fixing area of the net panel (Kim, 2013).
[Table 2.] The mean ± SD (°) of the measured tilt in the otter board and the codend
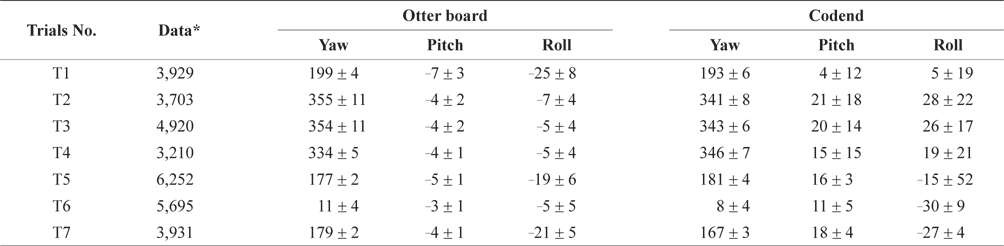
The mean ± SD (°) of the measured tilt in the otter board and the codend
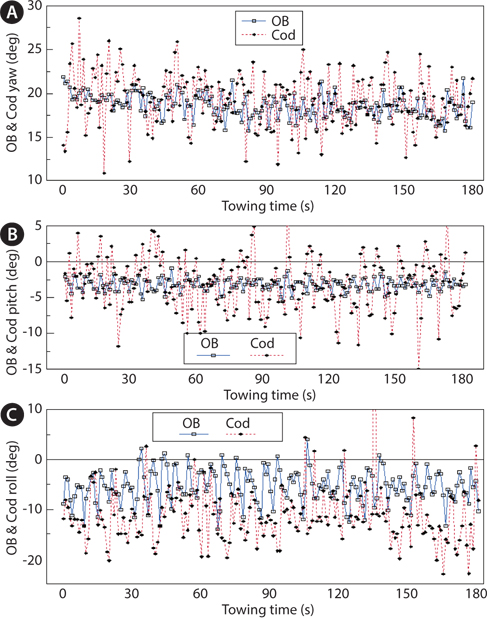
The detailed time series of yaw, pitch, and roll tilt of the otter board and codend are shown in Fig. 5 as examples from trial T2. The event values of the tilt as peaks and valleys appeared to be periodic in both the otter board and codend. Therefore, a period analysis using the traditional FFT method and global wavelet analysis, followed by self-made event analysis, were carried out for each tilt of each trial.
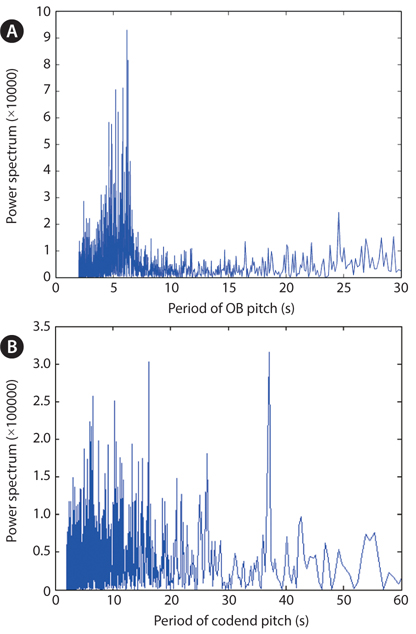
The period analysis was obtained by the FFT method using the tilt time-series data, as shown in Fig. 6 for pitch and Fig. 7 for roll in trial T7. The dominant peak periods within 30 s mostly appeared in tilt of the otter board, whereas several peak periods within 30 s mostly appeared in the tilt of the codend, indicating that the tilt of the codend revealed a wide period range. Those dominant peak periods of the otter board and the shortest period under 10 s of the codend are shown in Table 3. The shortest periods of roll of the codend were slightly longer, with a mean value of 6 s, than were the periods of the otter board, which had a mean value of 5 s (
[Table 3.] Period (s) of the otter board and codend by fast Fourier transform analysis
Period (s) of the otter board and codend by fast Fourier transform analysis
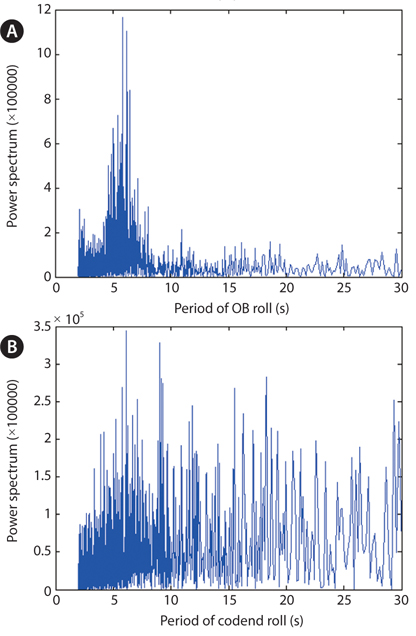
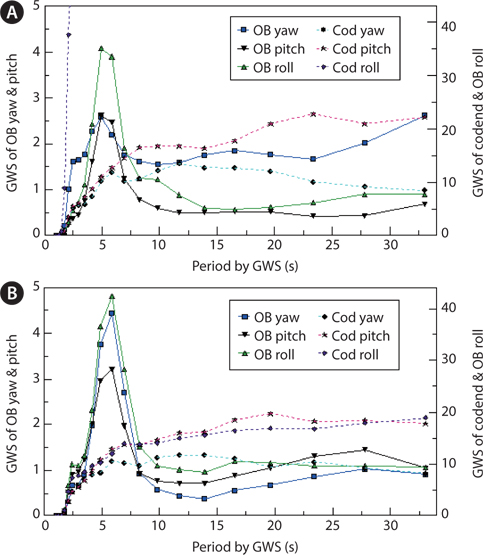
Period spectra of tilt in the otter board and codend by global wavelet analysis are shown in Fig. 8. The dominant peak periods within 30 s mostly appeared in the tilt of the otter board; however, several cases appeared with no dominant peak period in the codend. The dominant peak periods of the otter board and the codend by global wavelet analysis are shown in Table 4. The dominant period of yaw of the codend, with a mean value of 7 s, was longer than that of the otter board, with a mean value of 4 s (
[Table 4.] Periods (s) of otter board and codend by global wavelet analysis
Periods (s) of otter board and codend by global wavelet analysis
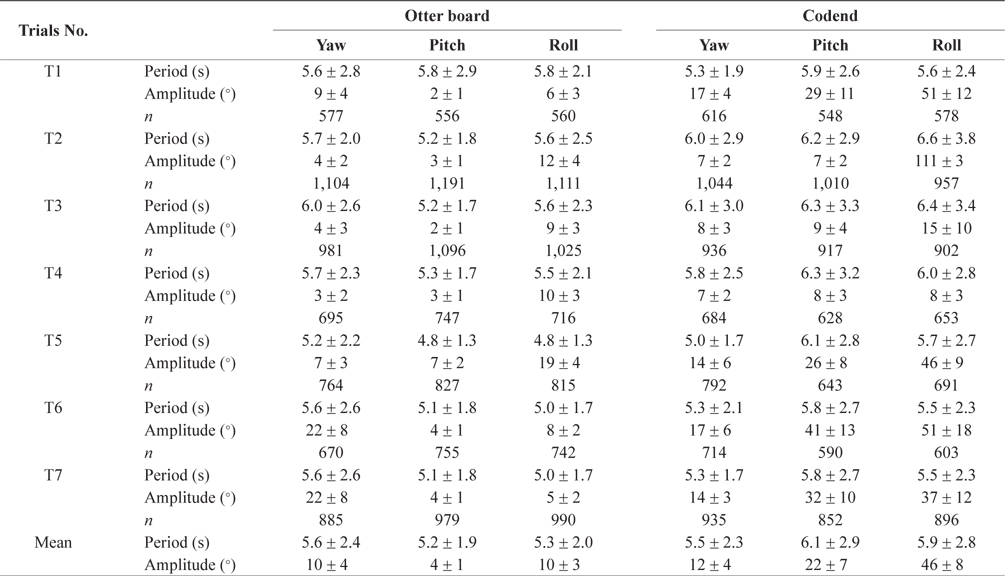
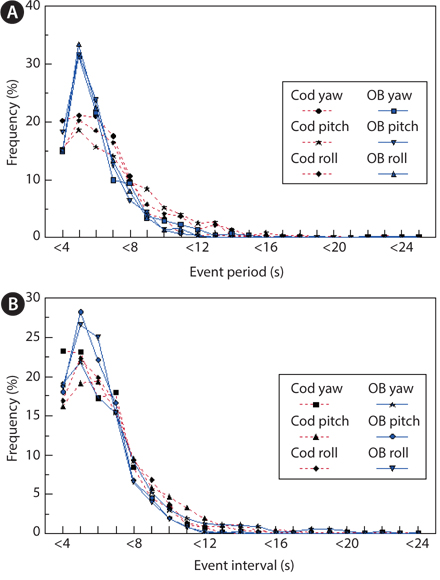
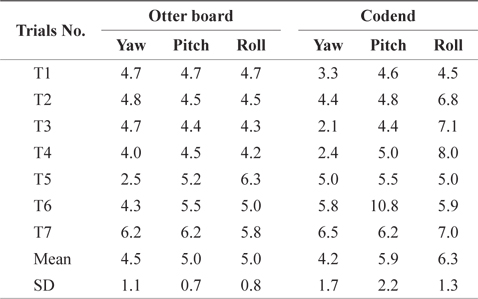
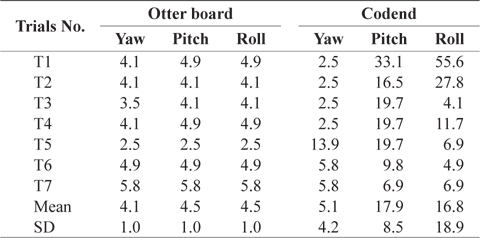
Additionally, a period analysis event analysis was carried out to estimate the period and amplitude of tilt. As shown an example of Fig. 5 one period of tilt was defined as the time difference from a peak value to the next peak or from a valley point to the next valley point. Then, the amplitude of tilt was derived as a positive amplitude in the case of a peak period and a negative amplitude in the case of a valley period. The mean values of peak and valley cases and the number of events for each period as well as its amplitude are presented by trials in Table 5. The product of the number of events and the mean period was nearly equal to the total sampling time, as shown in Table 2. The mean ± SD of the yaw period of the otter board was similar to that of the codend, whereas the means ± SDs of the pitch or roll periods of the otter board were slightly shorter than those of the codend. Additionally, period frequencies of the tilt by trial are shown in Fig. 9. Almost all period frequency and amplitude distributions appeared as normal distributions.

Periods and amplitudes represented as mean ± SD of the otter board and codend by the event analysis
The amplitude of tilt in the codend was greater than that in the otter board (
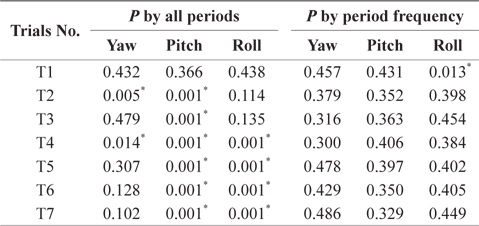
Results of probability (P) from a t-test for all periods of tilt and from a paired t-test for period frequency by the event analysis between otter board and codend respectively
The estimated pulsation period of the codend of a North Sea bottom trawl during underwater video observations was 3-8 s in relatively high sea waves of 1.2-2.8 m (O’Neill et al., 2003).
The tilt period of the codend in the present study, (4-6) ± (2-3) s, was similar to the pulsing period of the codend in the North Sea study, although sea conditions were different. The period of warp tension from the short example of 60 s by Matsushita et al. (2005) can be estimated to be 5-6 s, which was similar with the period of otter board tilt in this study. Codend motion can be related to sea conditions through ship motion and otter board motion in connection with the motion of flexible bodies such as the warp, hand rope, wing net, and bag net, and it is also influenced by the inside wake. For example, the tilt of the otter board can change due to operating conditions such as changing direction, warp length, and towing speed, which were nearly constant except during headings changes at T2 and T3 as shown in Table. Although SDs of the yaw of the otter board in T2 and T3 were greater than those in other trials a shown in Table 2, SDs of the codend were not different. Therefore, tilt variation of the otter board and gear can be measured by changes in the ship’s heading and changes in warp length or towing speed. Additionally, damping motion of the otter board should be investigated in relation to motion of the trawler as well as three-dimensional flow around the otter board.
The drag of the codend could increase due to the catch-associated increase in towing time, as the rear of the codend was blocked from video observation during field operation (O’Neill et al., 2003). The flow field definitely changed from the empty codend to one blocked by the catch (Pichot et al., 2009). If there was an uneven accumulation of catch at the rear of the codend, the codend could generate a damping motion, easily resulting in tilt variation. Therefore, the tension of the codend in relation to the amount of catch should be examined as well as the damping motion caused by accumulating catch. Additionally, fluttering of the codend should be studied in relation to tidal flow of the bottom layer, which may differ from towing direction.